
A technical report is a structured document that presents scientific research, engineering developments, or technical findings in a clear, concise, and formal manner. These reports are widely used in industries such as engineering, IT, energy, and manufacturing to document research outcomes, provide solutions to technical problems, and support decision-making. Whether you are an engineer, researcher, or student, mastering the art of writing a technical report is crucial for communicating complex information effectively. This step-by-step guide will walk you through the technical report writing process, covering formatting, structure, and best practices to ensure clarity and professionalism.
Need help writing a technical report? PatSnap Eureka provides expert guidance on structuring, formatting, and presenting data effectively, helping you create clear, concise, and impactful reports for technical and business applications.

Step 1: Understand the Purpose and Audience
Before writing a technical report, it’s essential to define its objective and target audience. A well-structured report should provide accurate information that meets the reader’s needs.
Key Questions to Consider:
- What is the purpose of the report? (Research findings, product analysis, case study, troubleshooting, etc.)
- Who is the target audience? (Engineers, managers, researchers, regulatory bodies, clients, or stakeholders)
- What level of technical knowledge does the audience have? (General, intermediate, or expert-level readers)
Best Practices:
- Use clear and precise language suited to the audience’s expertise.
- Avoid unnecessary jargon unless writing for specialists in the field.
- Focus on objective data, factual evidence, and well-structured arguments.
Step 2: Structure the Technical Report Properly
A technical report follows a structured format to ensure clarity, logical flow, and professionalism. Below is the standard format for technical reports.
Step 3: Gather Data and Conduct Research
A technical report must be based on accurate, well-documented data from reliable sources. Depending on the subject, gathering data may involve experimental research, literature reviews, market analysis, and competitor intelligence.
Key Actions
- Collect data from scientific journals, technical reports, patents, and experimental findings.
- Use graphs, tables, and figures to support your findings.
- Ensure data accuracy and consistency by cross-checking multiple sources.
Best Practices for Data Collection
- Use verified sources such as IEEE, ScienceDirect, Google Scholar, and industry white papers.
- Maintain detailed records of experimental results, calculations, and observations.
- Apply data visualization tools like charts, graphs, and infographics to enhance clarity.
How PatSnap Eureka Helps
PatSnap Eureka, an AI-driven intelligence platform, enhances the data collection process by providing:
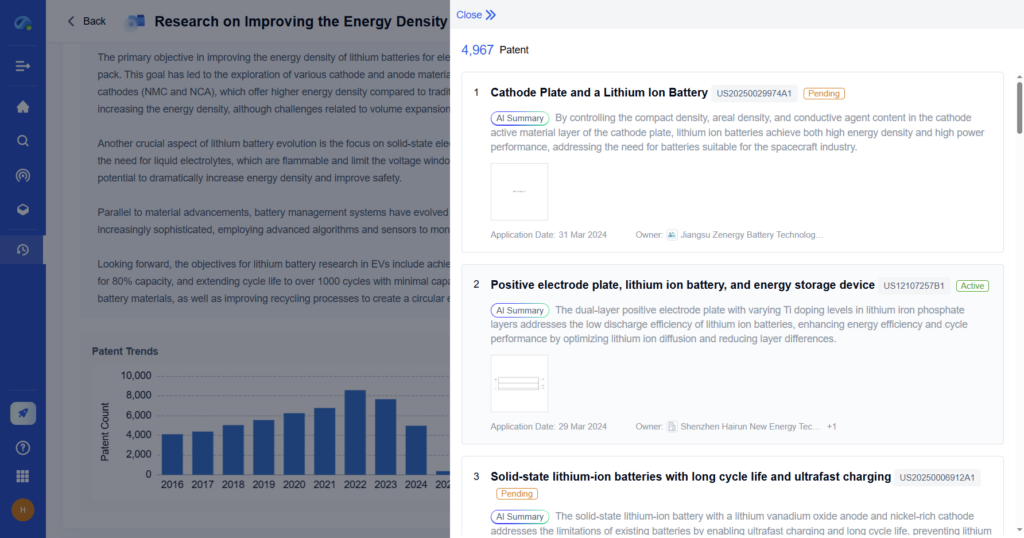
- AI-powered literature review that scans millions of patents, research papers, and technical reports in real time, identifying the latest trends in your field.
- Competitive intelligence tracking that monitors competitor R&D investments, patent filings, and market innovations, allowing for data-driven insights into industry movements.
- Patent and scientific data integration that aggregates global patent databases, scientific research, and material innovations, providing comprehensive datasets for in-depth analysis.
- Automated data comparison that compares technology performance metrics, such as battery efficiency improvements in cathode materials, against competitors and industry benchmarks.
- Real-time market trend analysis that tracks emerging industry trends, ensuring that research aligns with the latest technological advancements.
Step 4: Write the Technical Report Clearly and Concisely
Technical writing should be precise, objective, and easy to understand. Use the following techniques to enhance readability and clarity.
- Use headings and subheadings to organize content logically.
- Write in a formal tone, avoiding personal opinions or unnecessary details.
- Keep sentences concise and avoid long, complex structures.
- Define technical terms if necessary for non-expert readers.
- Use bullet points, tables, and numbered lists for clarity.
- Label diagrams, graphs, and tables properly for quick reference.
Example of a Well-Written Sentence vs. Poorly Written Sentence:
- Poor: The study was conducted with the purpose of determining whether or not the new material is capable of improving battery performance by analyzing various characteristics such as energy density, charge cycles, and thermal stability.
- Better: The study evaluates the new material’s impact on battery performance, focusing on energy density, charge cycles, and thermal stability.
Step 5: Edit, Proofread, and Format Professionally
Before finalizing the technical report, ensure it is error-free, well-structured, and follows industry standards.
Key Actions
- Verify that data, calculations, and references are correct.
- Check for grammar, spelling, and punctuation errors.
- Ensure figures, tables, and citations are consistently formatted.
- Seek peer feedback from colleagues or supervisors.
- Use professional formatting tools like Microsoft Word, LaTeX, or Google Docs.
Best Practices for Editing and Formatting
- Maintain a clear and logical structure with proper headings and subheadings.
- Use bullet points, numbered lists, and visuals to break down complex information.
- Keep the tone objective and formal, avoiding unnecessary technical jargon.
- Follow a consistent citation style, such as IEEE, APA, or Harvard.
- Ensure graphs, tables, and figures are labeled correctly and referenced within the text.

Example Use Case: Editing and Formatting a Technical Report on Cathode Materials
A research team using PatSnap Eureka can:
- Identify missing references or inconsistencies in their data by cross-checking with the latest industry reports.
- Ensure clarity in technical descriptions by using AI-powered readability improvements.
- Automatically format their citations and figures to meet publication or internal company standards.
- Generate structured summaries that align key research findings with market trends and competitor innovations.
PatSnap Eureka simplifies the finalization process, reducing time spent on manual editing and formatting while ensuring the report meets professional standards.
How PatSnap Eureka Enhances Technical Report Writing
PatSnap Eureka, an AI-powered intelligence platform, streamlines technical research and report writing by providing data-driven insights, patent tracking, and competitor analysis.
- AI-Powered Research Aggregation: Scans thousands of scientific publications, patents, and industry reports to find the latest breakthroughs.
- Trend Analysis and Market Insights: Identifies emerging technologies, industry trends, and competitor R&D strategies.
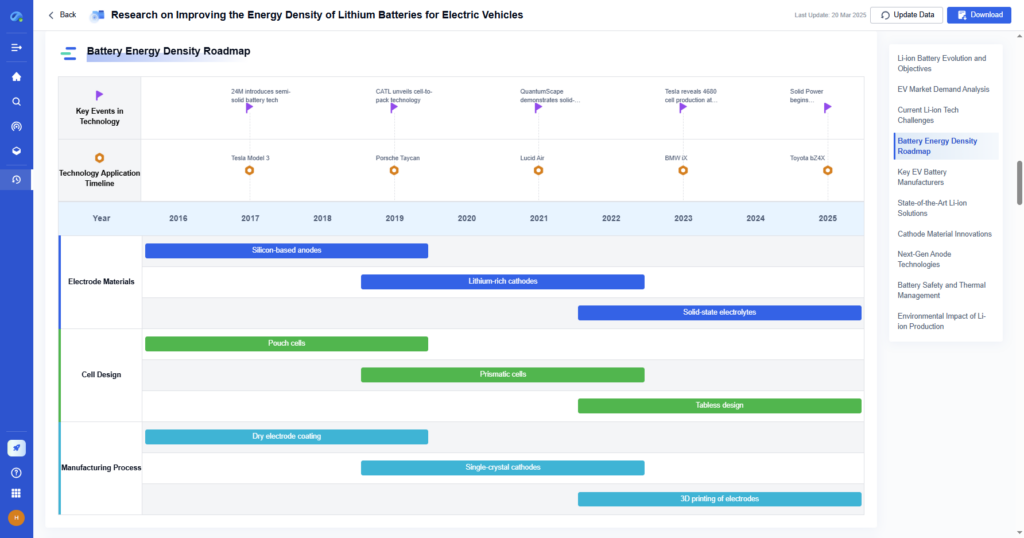
- Automated Data Visualization: Converts complex data into easy-to-understand charts and reports.
- Patent and Scientific Literature Monitoring: Helps engineers and researchers stay ahead of innovation in their field.
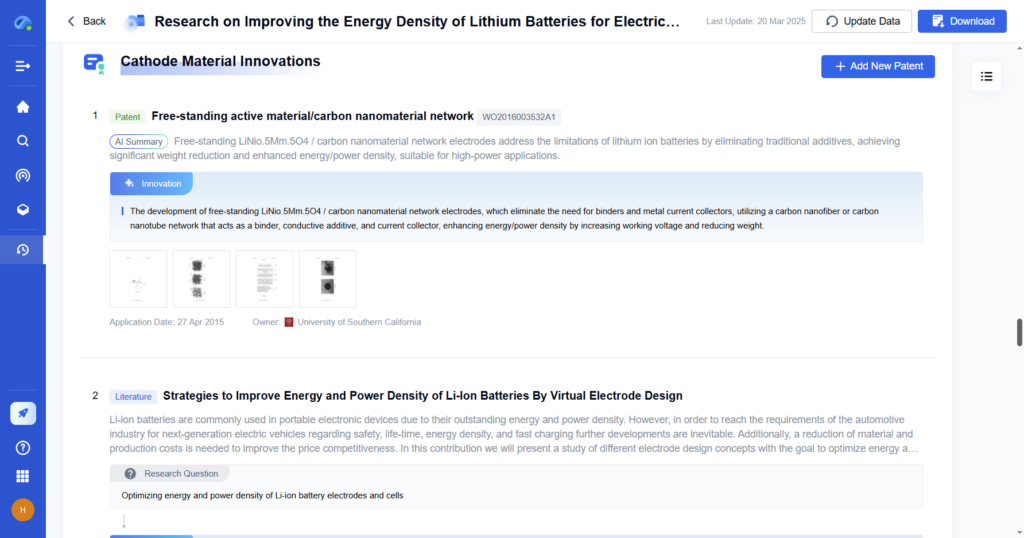
Example Use Case: Technical Report on Cathode Materials
A research team using PatSnap Eureka can:
- Instantly access patent filings and research papers on lithium-ion cathode materials.
- Compare battery performance trends across different manufacturers.
- Identify future R&D opportunities in next-gen battery materials.

Conclusion
Writing a technical report requires clear structuring, factual accuracy, and precise language to effectively communicate scientific findings or engineering solutions. By following this step-by-step guide, you can create well-organized, professional reports that meet industry standards and technical accuracy.
PatSnap Eureka further enhances the technical report writing process by providing:
- AI-driven research aggregation for gathering the latest scientific and technical data.
- Patent intelligence and market insights to strengthen competitive analysis.
- Automated data visualization to simplify complex research findings.
- Technology forecasting tools to identify future innovations.
Want to streamline your technical research and report writing process? Try PatSnap Eureka today.