
In the world of experimental research, accuracy, efficiency, and resource optimization are critical. Repeated measures design stands out as a statistical framework that addresses these demands by evaluating the same subjects under multiple conditions. Whether you’re conducting psychological assessments, product testing, or longitudinal healthcare studies, this approach allows for more sensitive and reliable results. This article explores what repeated measures design is, its benefits and limitations, and how you can enhance its execution using the AI-powered capabilities of PatSnap Eureka.
What Is Repeated Measures Design?
How are repeated measures studies framed across industries? Eureka Technical Q&A explores how various industries frame repeated measures studies to track changes, compare interventions, and improve decision-making. Healthcare, psychology, marketing, and manufacturing teams adapt these designs to analyze subjects over time using within-subject analysis.

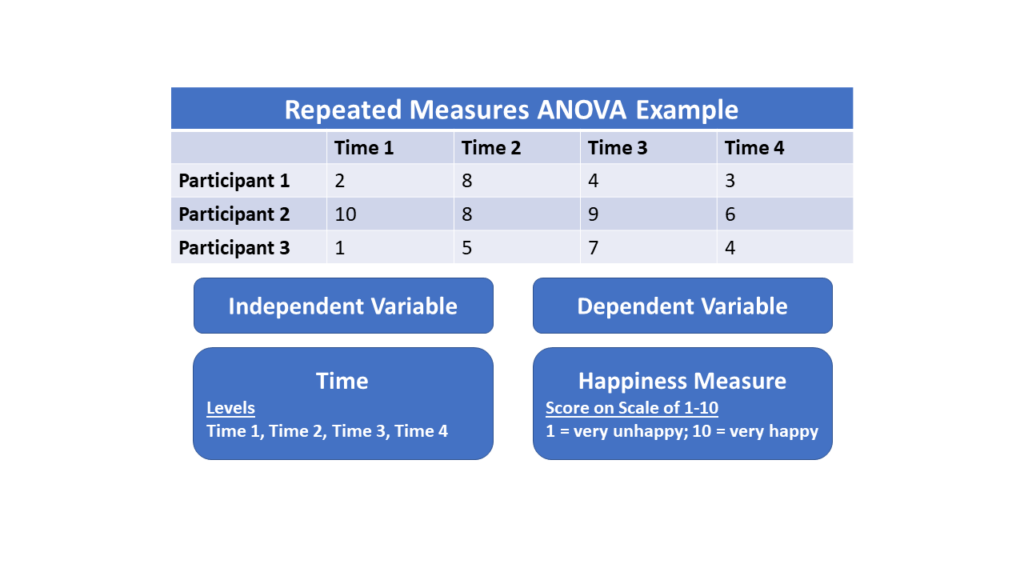
Researchers use repeated measures design as a within-subjects methodology by exposing the same participants to all levels of the independent variable. This design eliminates between-subject variability, enabling researchers to track changes more precisely within individuals over time or across different conditions.
Advantages of Repeated Measures Design
Improved Statistical Power
By using participants as their own control group, the design reduces individual variability, increasing sensitivity to detect effects.
Fewer Participants Needed
Because each subject provides multiple data points, researchers can use smaller sample sizes while still achieving robust results.
Temporal Tracking
It’s especially useful for tracking behavioral, physiological, or performance-based changes across time points in longitudinal studies.
Cost Efficiency
Researchers save resources on recruitment, training, and data management by using the same group across all conditions.
Challenges of Repeated Measures Design
Order Effects
The order of condition administration can influence results through learning, fatigue, or expectation. Researchers often use counterbalancing to offset this.
Carryover Effects
Exposure to one condition may affect subsequent ones. Researchers may apply washout periods or design variations to minimize these effects.
Assumption of Sphericity
Repeated measures often assume equal variance of differences between conditions. Researchers apply adjustments like the Greenhouse-Geisser correction when someone violates this assumption.
How to Conduct a Repeated Measures Design
Step 1: Define Your Objective
Start by determining what you’re testing—whether it’s a new drug’s effect, user experience across product versions, or learning progression over time.
- With PatSnap Eureka: Use Eureka’s semantic AI to identify how similar repeated measures studies have been framed across industries. This helps refine your hypothesis and structure.

Step 2: Select Your Variables
Clearly define your independent variable as the condition you change and your dependent variable as the outcome you measure.
- With PatSnap Eureka: Eureka’s literature database enables researchers to review measurement standards, validated instruments, and variable interactions relevant to their study field.

Step 3: Recruit and Prepare Participants
Choose a consistent group of participants who can undergo all conditions. Consider sample size, attrition, and baseline variability.
- With PatSnap Eureka: Analyze prior case studies and industry benchmarks to determine the optimal sample characteristics and cohort size for similar studies.
Step 4: Develop the Experiment Schedule
Design the timing, order, and conditions of exposure. Incorporate counterbalancing or randomization where needed.
- With PatSnap Eureka: Use Eureka’s AI-supported planning tools and historical datasets to compare experimental timelines, reduce bias, and simulate condition schedules.
Step 5: Run the Experiment and Collect Data
Implement your study under controlled conditions. Ensure consistency in how each session is administered.
- With PatSnap Eureka: Automate variable tracking and data logging with Eureka’s experimental monitoring features. Detect anomalies or condition drift early using real-time analysis.
Step 6: Analyze Results
Apply statistical methods such as repeated measures ANOVA, linear mixed models, or non-parametric tests if assumptions are violated.
- With PatSnap Eureka: Tap into statistical case comparisons and visualization tools to interpret your data effectively. View how similar experiments evaluated patterns and anomalies.

Step 7: Report Findings and Share
Summarize outcomes, discuss implications, and share findings with internal or external stakeholders.
- With PatSnap Eureka: Build dynamic dashboards, export visual reports, and share documented protocols or trends for faster decision-making and collaborative analysis.
Conclusion
Repeated measures design offers a versatile and powerful way to study changes within individuals over time or across multiple experimental conditions. It minimizes error, strengthens conclusions, and conserves resources—making it ideal for researchers in science, business, and product development.
By integrating PatSnap Eureka into each phase of the repeated measures process, researchers gain not only speed and clarity but also access to deep, contextual intelligence. From designing the study to interpreting complex results, Eureka brings AI precision and global insights to your experimental workflow—ensuring your repeated measures research delivers reliable, actionable outcomes.
To get detailed scientific explanations of Repeated Measures Design, try Patsnap Eureka.