
Stratified sampling is a widely used statistical technique that helps researchers gain accurate insights by ensuring every segment of a diverse population is properly represented. It’s particularly valuable when a population consists of varied subgroups with different characteristics. From academic studies to R&D market analysis, stratified sampling provides a reliable method for extracting actionable insights. In this article, we explore how stratified sampling works, why it’s essential, and how innovation platforms like PatSnap Eureka elevate its application.
What Is Stratified Sampling?
Need to use stratified sampling in your research? Patsnap Eureka helps you define strata, select representative samples, and ensure accuracy—making your data more reliable and your analysis more precise.

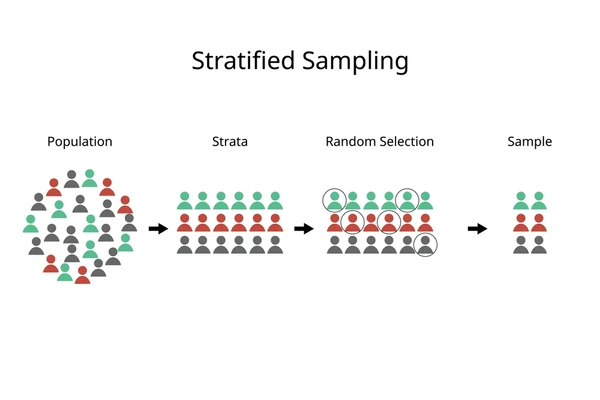
Stratified sampling is a method of dividing a heterogeneous population into distinct, non-overlapping subgroups called strata. These strata are formed based on shared attributes such as age, occupation, geographic region, or industry sector. Researchers then select samples from each stratum, either proportionally or disproportionately, depending on the study’s goals.
Types of Stratified Sampling
Proportional Stratified Sampling
In this approach, the number of observations selected from each stratum is proportional to the size of that stratum in the overall population. This method preserves the true distribution of characteristics in the population.
Disproportional Stratified Sampling
Here, researchers intentionally select unequal sample sizes from each stratum. This is useful when certain subgroups are small but critical, and need to be adequately represented in the final sample.
Benefits of Stratified Sampling
- Improved Accuracy: Stratified sampling reduces variability within each group, leading to more precise and reliable estimates.
- Greater Representativeness: Ensures that smaller or underrepresented groups are included in the sample.
- Segment-Specific Insights: Allows researchers to analyze data across subgroups for deeper understanding.
- Efficient Resource Allocation: Reduces sampling error without requiring large overall sample sizes.
How to Implement Stratified Sampling
Step 1: Define the Target Population
Start by identifying the complete population from which you intend to sample. This could be innovators, companies, technologies, or market segments relevant to your research question.
- With PatSnap Eureka: Leverage Eureka’s global innovation intelligence platform to discover and validate your population using current patent records, scientific literature, and technology landscapes.
Step 2: Choose Stratification Variables
Determine how to segment the population. Common stratification variables include industry type, geographic location, company size, or technological field.
- With PatSnap Eureka: Use built-in filters and classification schemes in Eureka to organize data by region, sector, innovation maturity, or funding profile.
Step 3: Segment the Population into Strata
Divide the population into non-overlapping subgroups that reflect homogeneity within and variability between.
- With PatSnap Eureka: Automatically cluster your dataset using Eureka’s AI-powered tagging and similarity algorithms to generate precise, meaningful strata based on innovation behavior and competitive profiles.
Step 4: Determine Sample Sizes for Each Stratum
Choose a proportional or disproportional sampling strategy depending on whether you want statistical representativeness or strategic emphasis.
- With PatSnap Eureka: Analyze technology saturation and innovation impact across strata to allocate sampling quotas more effectively.
Step 5: Conduct Random Sampling Within Strata
Select a random or systematic sample within each stratum to minimize bias.
- With PatSnap Eureka: Export filtered data from each stratum into structured sample lists, ensuring that selection is based on accurate and traceable data.
Step 6: Collect and Compare Data Across Strata
Compile observations and insights from each subgroup and begin cross-stratum comparisons.
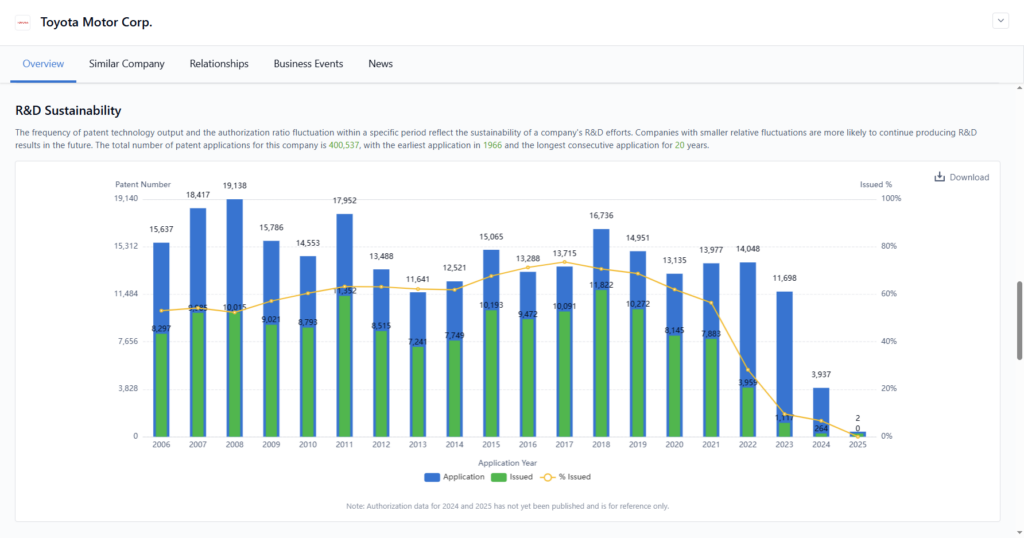
- With PatSnap Eureka: Use comparative dashboards, citation tracking, and benchmarking tools to analyze trends, gaps, and strategic strengths across strata in real time.

Step 7: Visualize and Report Findings
Create compelling reports and visual summaries for stakeholders to understand the implications of the sampled data.
- With PatSnap Eureka: Generate customizable dashboards with heatmaps, timelines, and collaborative report templates to share actionable results.
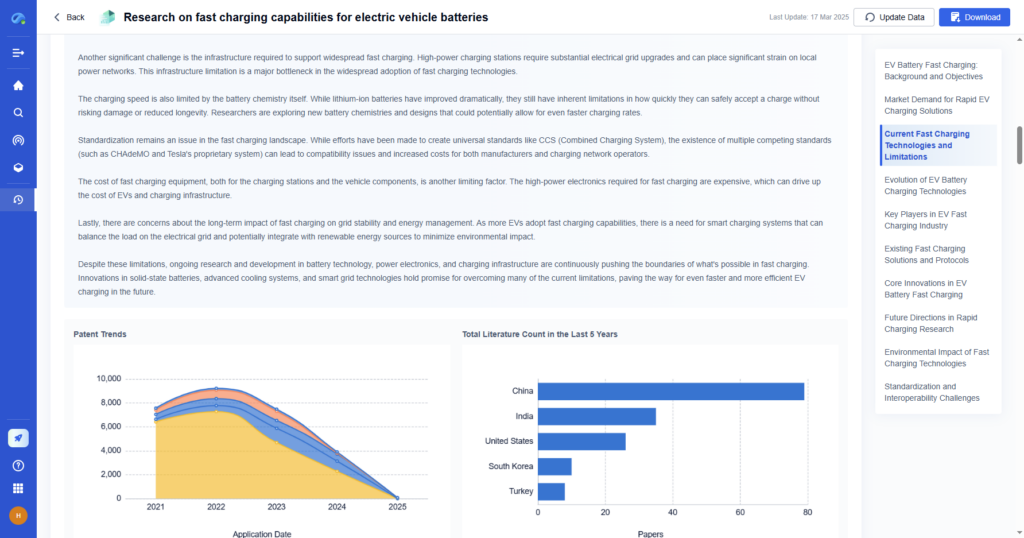
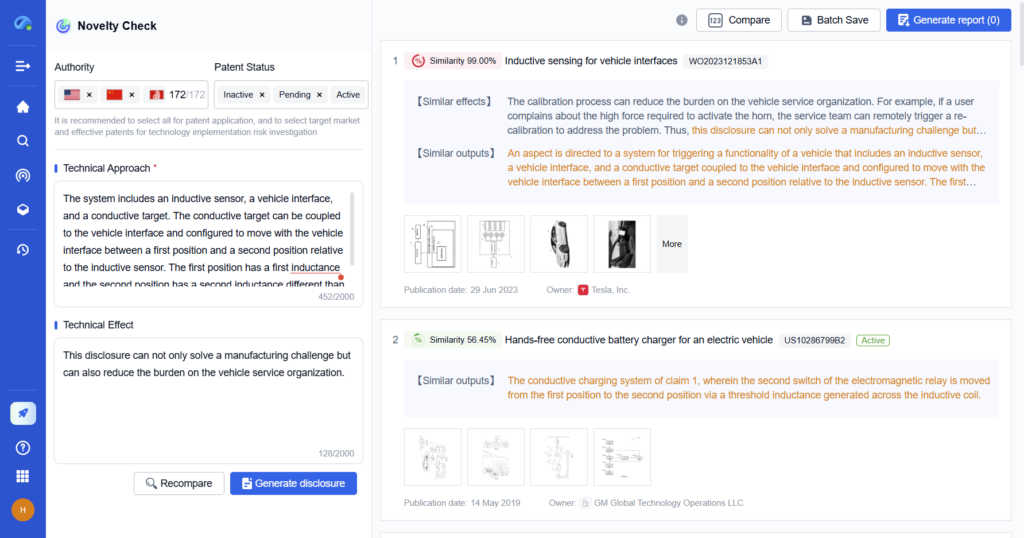
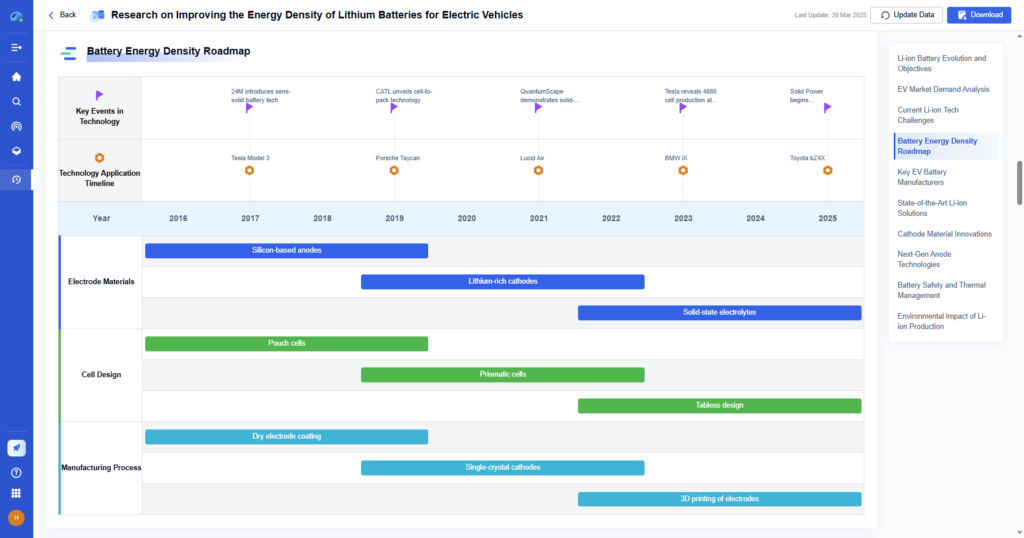
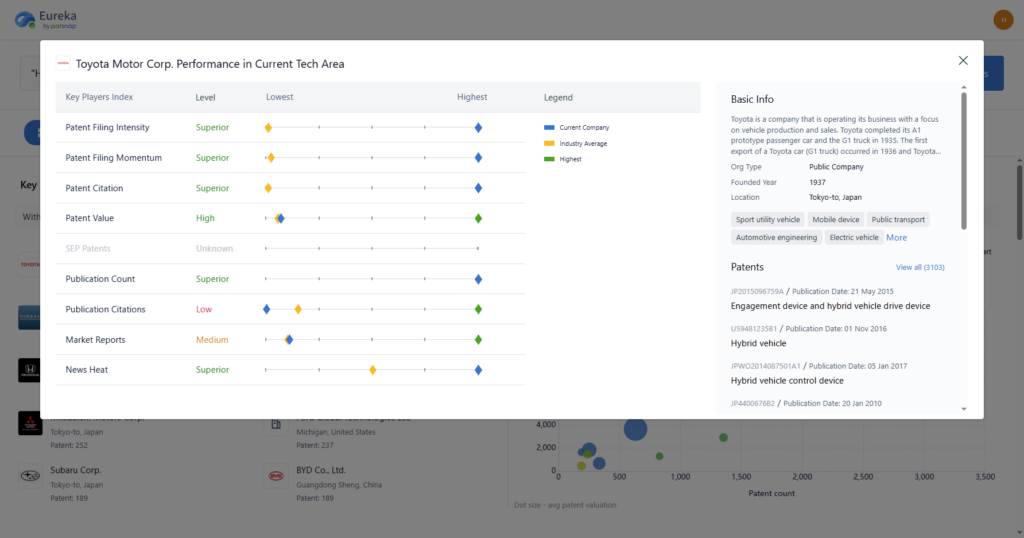
Example Use Case
Imagine a global firm researching electric vehicle (EV) battery innovation across industries. Using stratified sampling, the firm segments the market into automotive, renewable energy, and electronics manufacturers. PatSnap Eureka helps identify leading patents, publications, and R&D activities in each stratum. With visualized comparison dashboards, analysts can pinpoint where innovation is thriving and where opportunity gaps remain—informing their product development and investment strategies.
Conclusion
Stratified sampling is a powerful tool for achieving accurate, segmented insights from complex populations. Whether you’re studying global innovation patterns, analyzing customer behavior, or benchmarking competitors, stratified sampling ensures that no important subgroup is left out.
By combining this statistical approach with the advanced capabilities of PatSnap Eureka, researchers gain access to precision, speed, and clarity—making their analysis not only smarter but also more actionable. In a world of data complexity, this synergy leads to stronger strategies and more confident decision-making.
To get detailed scientific explanations of stratified sampling, try Patsnap Eureka.