Detection method and detector for underground water source based on earth electromagnetic induction principle
A technology of electromagnetic induction and detection method, applied in geophysical measurement, electric/magnetic exploration, water resource assessment, etc. problem, to achieve the effect of high water finding accuracy, light weight and simple structure
- Summary
- Abstract
- Description
- Claims
- Application Information
AI Technical Summary
Problems solved by technology
Method used
Image

Examples
example 1
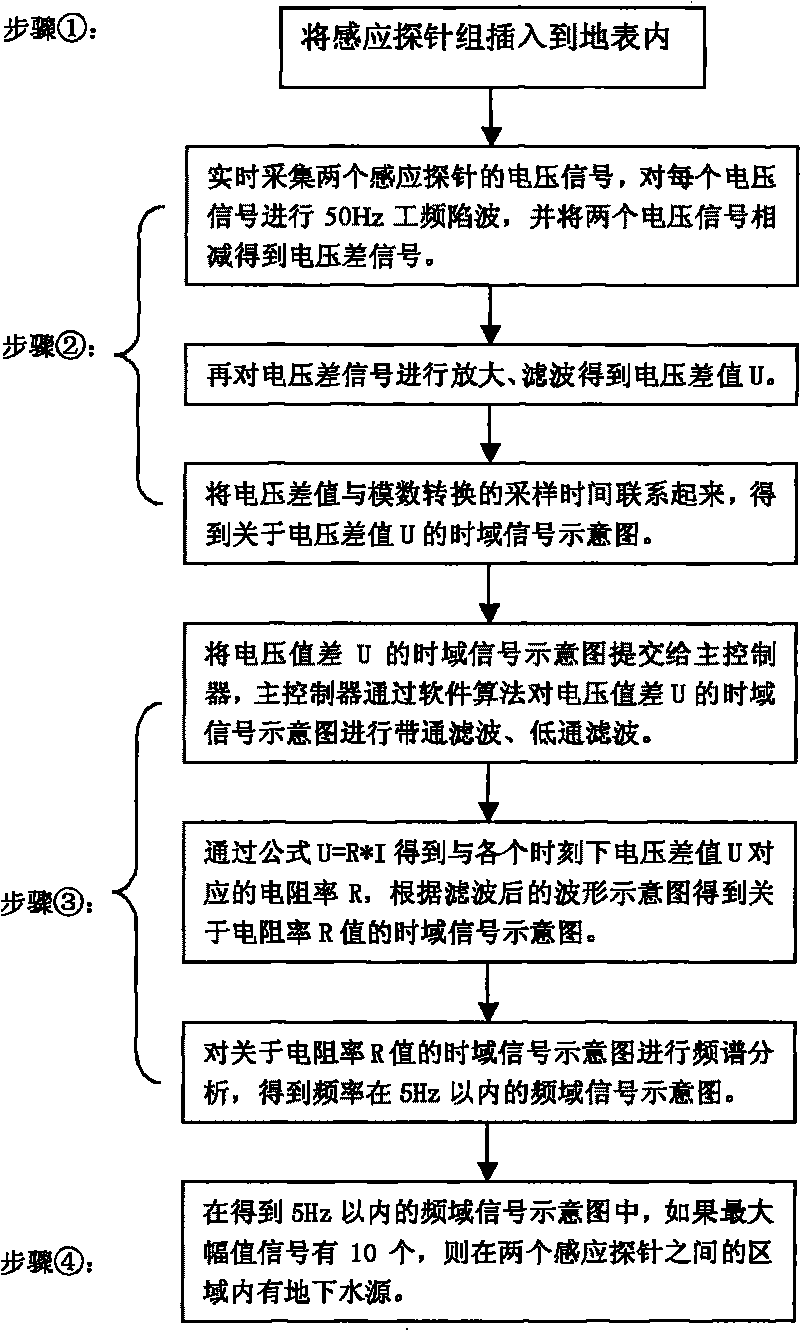
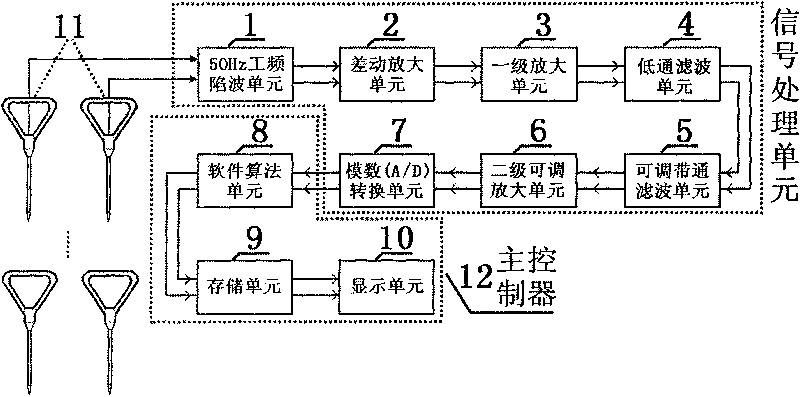
[0060] Such as Figure 7 What is shown is a schematic diagram of the time-domain signal of the voltage difference U at a certain depth at a certain measuring point in the actual measurement. The 20-second discrete digitized "voltage difference U" signal realizes the FIR low-pass filtering of the software through the DSP chip of the software algorithm unit 8, then uses the adaptive filtering algorithm to lock and set the signal of the passband (i.e. depth), and then passes the formula U= R*I, the time-domain signal schematic diagram of the discrete digitized resistivity R value obtained in 20 seconds, such as Figure 8 . Use the FFT spectrum analysis algorithm to analyze the time-domain signal of the resistivity R value to obtain the frequency-domain signal. DSP finds out the ten kinds of frequency spectrum with the highest amplitude through the algorithm, and removes the spectrum with frequency components above 5 Hz to obtain the frequency-domain signal diagram, as shown in ...
example 2
[0062] Such as Figure 10What is shown is a schematic diagram of the time-domain signal of the voltage difference U at a certain depth at a certain measuring point in the actual measurement. The 20-second discrete digitized "voltage difference U" signal realizes the FIR low-pass filtering of the software through the DSP chip of the software algorithm unit 8, then uses the adaptive filtering algorithm to lock and set the signal of the passband (i.e. depth), and then passes the formula U= R*I, the time-domain signal schematic diagram of the discrete digitized resistivity R value obtained in 20 seconds, such as Figure 11 . Use the FFT spectrum analysis algorithm to analyze the time-domain signal of the resistivity R value to obtain the frequency-domain signal. DSP finds out the ten kinds of frequency spectrum with the highest amplitude through the algorithm, and removes the spectrum with frequency components above 5 Hz to obtain the frequency-domain signal diagram, as shown in ...
example 3
[0064] Such as Figure 13 As shown, what this figure represents is a certain example in the field measurement, measure a section, the length of the measurement section is 80 meters, the distance L length of each measurement induction probe set 11 is 10 meters, and the insertion depth is 15 centimeters . First measure at the first point (that is, 0 to 10 meters on the abscissa in the figure), and the depth required for measurement is 7 types: 40 meters to 75 meters, 75 meters to 110 meters, 110 meters to 145 meters, and 145 meters to 180 meters, 180 meters to 225 meters, 225 meters to 260 meters, 260 meters to 300 meters. Three frames of data are repeatedly measured for each depth, and the A / D conversion chip corresponding to each frame of data has a collection time of 20 seconds. First, measure the depth from 40 meters to 75 meters, and then measure from shallow to deep, until 260 meters to 300 meters. The meter section is measured. Then move the induction probe group to 10...
PUM
 Abstract
Description
Claims
Application Information
 - R&D
- Intellectual Property
- Life Sciences
- Materials
- Tech Scout
- Unparalleled Data Quality
- Higher Quality Content
- 60% Fewer Hallucinations
Browse by: Latest US Patents, China's latest patents, Technical Efficacy Thesaurus, Application Domain, Technology Topic, Popular Technical Reports.
© 2025 PatSnap. All rights reserved.Legal|Privacy policy|Modern Slavery Act Transparency Statement|Sitemap|About US| Contact US: help@patsnap.com