A micro-droplet data analysis method and system
A data analysis and micro-droplet technology, applied in the fields of instruments, character and pattern recognition, computer parts, etc., can solve problems such as the inability to meet the needs of micro-droplet data analysis business
- Summary
- Abstract
- Description
- Claims
- Application Information
AI Technical Summary
Problems solved by technology
Method used
Image

Examples
Embodiment 1
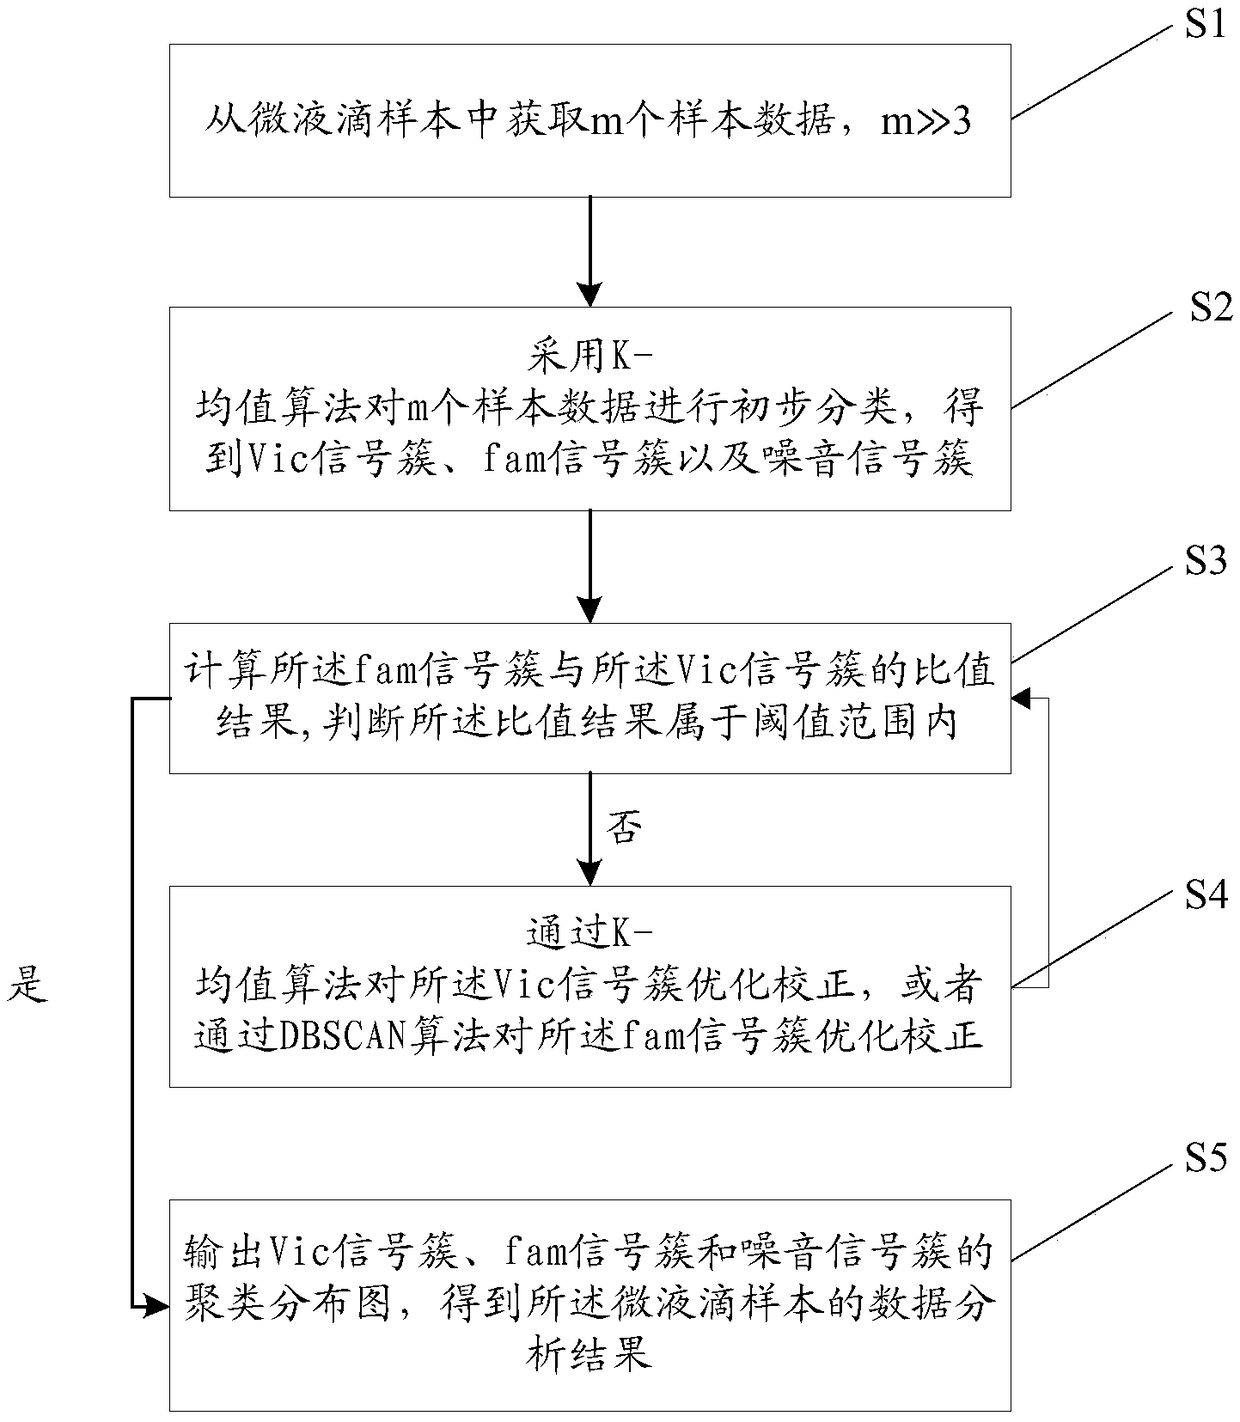
[0075] figure 1 It is a schematic flowchart of the micro-droplet data analysis method in Embodiment 1 of the present invention. see figure 1 , the present embodiment provides a micro-droplet data analysis method, including:
[0076] Step S1: Obtain m sample data from the micro-droplet sample, m>>3; Step S2: Use the K-means algorithm to preliminarily classify the m sample data to obtain Vic signal clusters, fam signal clusters and noise signal clusters; Step S3: Calculate the ratio result of the fam signal cluster and the Vic signal cluster, and when the ratio result belongs to the threshold range, perform step S5, otherwise, perform step S4; Step S4: optimize and correct the Vic signal cluster through the K-means algorithm, or Optimize and correct the fam signal clusters through the DBSCAN algorithm, and return to step S3; step S5: output the cluster distribution diagram of the Vic signal clusters, fam signal clusters and noise signal clusters, and obtain the data analysis r...
Embodiment 2
[0097] see figure 1 and Figure 4 , the present embodiment provides a micro-droplet data analysis system, including:
[0098] An acquisition unit 1, configured to acquire m sample data from the micro-droplet sample, where m>>3;
[0099] The classification unit 2 is used to initially classify the m sample data using the K-means algorithm to obtain Vic signal clusters, fam signal clusters and noise signal clusters;
[0100] Comparing unit 3, is used for calculating the ratio result of fam signal cluster and Vic signal cluster;
[0101] The optimization correction unit 4 is used to optimize and correct the Vic signal cluster through the K-means algorithm when the ratio result does not belong to the threshold range, or optimize the correction to the fam signal cluster through the DBSCAN algorithm;
[0102] The result output unit 5 is configured to output the cluster distribution diagram of Vic signal clusters, fam signal clusters and noise signal clusters to obtain data analysi...
PUM
 Abstract
Description
Claims
Application Information
 - R&D
- Intellectual Property
- Life Sciences
- Materials
- Tech Scout
- Unparalleled Data Quality
- Higher Quality Content
- 60% Fewer Hallucinations
Browse by: Latest US Patents, China's latest patents, Technical Efficacy Thesaurus, Application Domain, Technology Topic, Popular Technical Reports.
© 2025 PatSnap. All rights reserved.Legal|Privacy policy|Modern Slavery Act Transparency Statement|Sitemap|About US| Contact US: help@patsnap.com