Check patentability & draft patents in minutes with Patsnap Eureka AI!

A Visualization Method of Deep Model Classification Results for ECG Data

A deep model and classification result technology, applied in character and pattern recognition, medical science, diagnosis, etc., can solve problems such as unfavorable doctor classification results, limited application scenarios, and inability to explain the basis for classification results

Active Publication Date: 2020-07-28
XI AN JIAOTONG UNIV
View PDF7 Cites 0 Cited by
  • Summary
  • Abstract
  • Description
  • Claims
  • Application Information

AI Technical Summary

Problems solved by technology

However, these existing models can only give the final classification results, and cannot explain the basis for the classification results; in practice, it is difficult to accept and apply the prediction of classification results without a clear explanation, which greatly affects the application scenarios. It is also not conducive to doctors to use the classification results output by the model

Method used


Image

  • A Visualization Method of Deep Model Classification Results for ECG Data
  • A Visualization Method of Deep Model Classification Results for ECG Data
  • A Visualization Method of Deep Model Classification Results for ECG Data

Examples


Embodiment

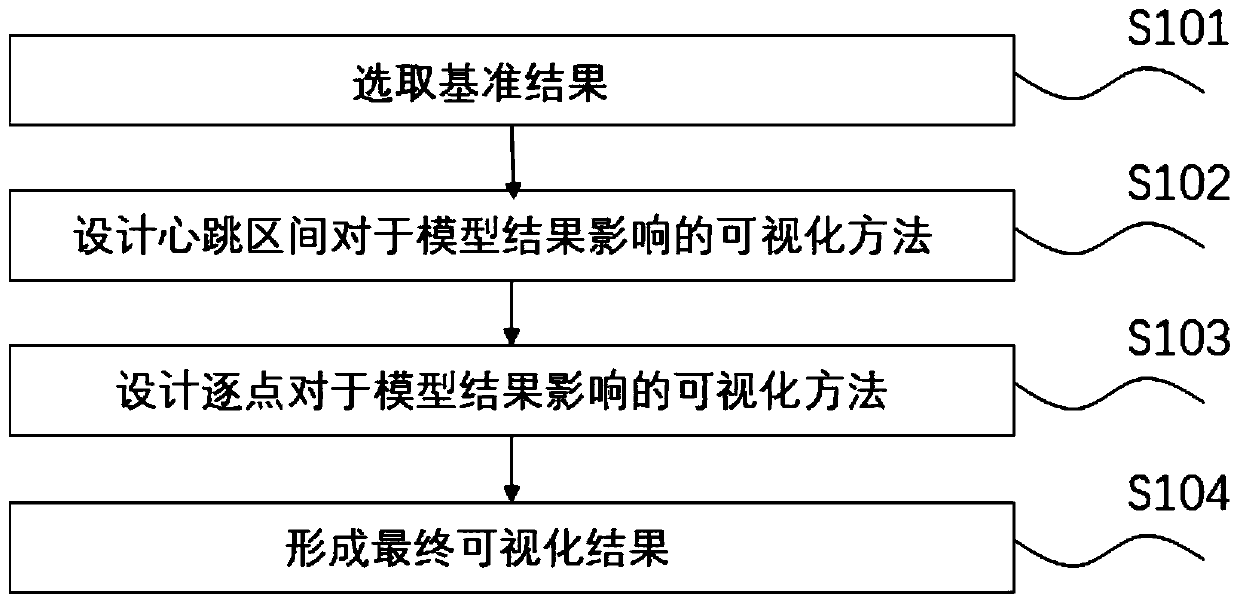
[0152] see figure 1 , in order to achieve the final visualization effect, the visualization method of the present invention comprises the following steps:

[0153] S101, determining a benchmark result.

[0154] In this embodiment, the representation form after processing the original ECG data into an ECG sequence is:

[0155] S=[s 1 , s 2 ,…,s i ,…,s n ]

[0156] In the formula, S is an n-dimensional vector, i=1,2,...,n, s i Indicates the data of the i-th point in the sequence, input the data sequence into the preset trained deep model, and the resulting data format is:

[0157] Y=[y 1 , y 2 ,…,y j ,…,y N ]

[0158] In the formula, Y is an N-dimensional vector, and N represents the number of labels for the model classification; j=1,2,...,N,y j represents the classification value of the model on the label j, 0≤y j ≤1, where y j The label corresponding to the maximum value is the predicted classification result of the deep model, and the y corresponding to the lab...


PUM


Abstract

The invention discloses a visualization method for depth model classification results facing ECG data. The method comprises the following steps: inputting an ECG sequence into a trained depth model toobtain a reference result; removing the information of a selected heartbeat interval by a shield interval, comparing the output result of the depth model when the heartbeat interval information is not selected with the reference result output by the depth model, and calculating the impact factor delta O of each heartbeat for the depth model; and performing visualized expression of the impact factor delta O of each heartbeat by a gradual change color band to visualize the classification results of the depth model. By analyzing the influence of the ECG data on the output of the depth model under macro and micro granularity, the method can show the key evidence of the model classification result, and can enhance the interpretability of the classification result of the model output.

Description

technical field [0001] The invention belongs to the technical field of deep model classification result visualization, and particularly relates to a deep model classification result visualization method oriented to electrocardiogram data. Background technique [0002] According to the definition of Wikipedia, ECG data refers to a time-based recording of the electrophysiological activity of the heart through the chest cavity, which is captured and recorded by electrodes on the skin. In practice, in order to improve efficiency and reduce the burden and work intensity of doctors, some deep learning-based models are applied to feature extraction and classification on ECG data. However, these existing models can only give the final classification result, and cannot explain the basis of the classification result; and the classification result prediction without a clear explanation in practice is difficult to be accepted and applied, which makes the application scenario greatly aff...

Claims


Application Information

Patent Timeline
Patent Type & Authority Patents(China)
IPC IPC(8): A61B5/0402G06K9/62
Inventor 钱步月刘涛李晓宇李安郑莹倩陈鹏岗魏积尚郑庆华
Owner XI AN JIAOTONG UNIV
Features
  • R&D
  • Intellectual Property
  • Life Sciences
  • Materials
  • Tech Scout
  • Unparalleled Data Quality
  • Higher Quality Content
  • 60% Fewer Hallucinations
Learn More