

Genetic Copy Number Determination Using High Throughput Multiplex Sequencing Of Smashed Nucleotides
a technology of multiplex sequencing and gene, applied in the field of gene copy number determination using high throughput multiplex sequencing of smashed nucleotides, can solve the problem that the length of sequence reads does not improve the resolution of copy number analysis, and achieve the effect of increasing the read length
- Summary
- Abstract
- Description
- Claims
- Application Information
AI Technical Summary
Benefits of technology
Problems solved by technology
Method used
Image


Examples
example 1
of SMASH
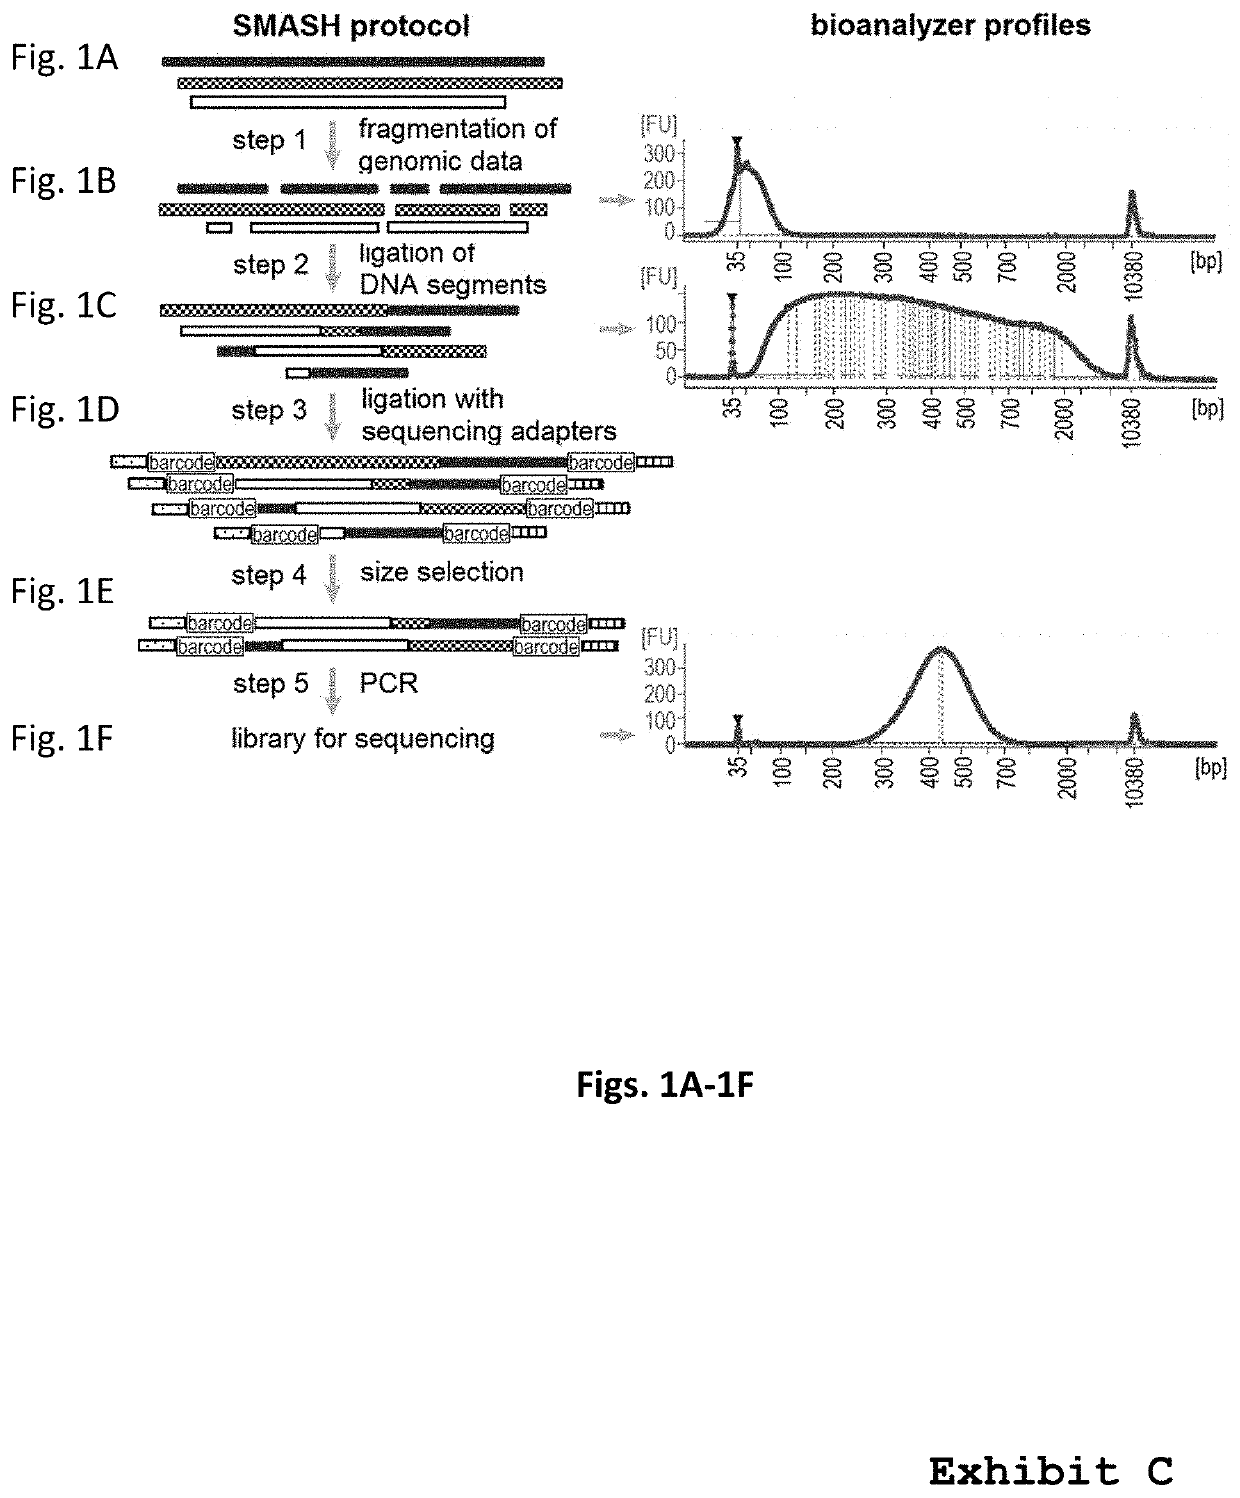
[0138]The protocol for SMASH (see also “Methods—Smash protocol,” above) is illustrated in FIG. 1. To obtain SMASH tags, first genomic DNA was mechanically sheared by sonication, then cut with two restriction endonucleases. The ideal size fraction is obtained using bead purification (see also “Methods—Smash protocol,” above) to enrich for the target size range of 40 bp (FIG. 1). To generate the long chimeric DNAs, the SMASH tags were end-repaired and then ligated. A second fragmentation step may optionally be performed to eliminate long (>1 kb) chimeric molecules, and DNA fragments in the proper size range (300-700 bp) are purified. Barcoded sequencing adaptors are then attached to the molecules, creating libraries that can be multiplexed on a single sequencing lane. Alternatively, long chimeric DNAs can be formed by ligation of end-repaired SMASH segments, followed by attachment of barcoded sequencing adaptors to the fragments and finally selection of DNA fragments in the op...
example 2
g Pipeline Parameters
[0143]To measure performance precisely and choose parameters for pipeline processing, the signal in bins was compared on the X chromosome to those on autosomes in male subjects. Also calculated are 1) the median average deviation (MAD) of bins to measure the magnitude of the noise, and 2) the autocorrelation as a measure of trendiness in the data, an important risk factor for segmentation error. Signal to noise (“S / N”) was calculated as the difference in the medians of the autosome and X-chromosome, divided by the square root of the sum of the squares of the MADs. These statistics were used to evaluate reference normalization and mapping algorithms, and then to compare WGS to SMASH (Table 1).
[0144]First, the utility of applying reference normalization (“ref norm,” Table 1) was considered. Dividing the GC-adjusted bin ratios by a standard sample bin ratio greatly improved performance for both WGS and SMASH (rows 1 through 4). Namely, reference normalization decre...
example 3
WGS to SMASH Profiles Under Optimized Pipeline Parameters
[0147]The performance of WGS and SMASH was compared using autosomes and X-chromosomes as described above. Different total numbers of bins (from 50,000 to 500,000), different mean numbers of maps per bin (20, 50 and 100), collecting statistics for signal-to-noise and autocorrelation were considered, among other factors. The two methods have very similar performance characteristics (Table 2). WGS, map for map, slightly outperforms SMASH. When bin boundaries were chosen such that the reference sample has the same number of maps in each bin, the signal-to-noise ratio improves for both SMASH and WGS, and the difference between them narrows substantially (Supplementary Table
TABLE 2maps autosome X- X- signal # of per auto- autosome chrom autosome chrom to type bins bin correlation median median MAD MAD noisesmash 50000 20 −0.002 2.032 1.111 0.297 0.218 2.497 wgs 50000 20 0.000 2.031 1.072 0.295 0.208 2.659 smash 50000 50 0.006 2.009 ...
PUM
| Property | Measurement | Unit |
|---|---|---|
| final volume | aaaaa | aaaaa |
| final volume | aaaaa | aaaaa |
| volume | aaaaa | aaaaa |
Abstract
Description
Claims
Application Information