Fastest
Eureka on the web
When you want the answer in the next five minutes.
The agent works the prompt against patents and technical literature, citing every source.
Run your analysis now →23 patent families and 32 records on graph query execution plan optimization, with two filers tied at the top on 4 families each.
32 published records collapse into 23 simple (DOCDB) families; the difference is the same invention filed in more than one country. In force = 17 of 32 records still granted and maintained at the data cut-off; the rest are pending, withdrawn, refused or lapsed.
This page covers patent filings matched by the search string TAC:(("graph database*" OR "graph query") AND ("execution plan") AND (optimiz*)), which looks for graph database or graph query terms combined with execution plan and an optimization term in the title, abstract or claims. The result set totals 32 published records, de-duplicating to 23 simple patent families. No date limit is applied in the search string, so the records returned span whatever filing dates the matching text happens to cover.
23 families is a small pool. The figures on this page describe exactly what this search returned, who filed, which classifications appear, where applications were filed, and should be read as a starting point for a more targeted search rather than a complete map of this topic.
Ordered by volume only, not by importance or claim strength. Counted in simple (DOCDB) patent families, so one invention filed in several countries counts once. Names come from Patsnap's standardised assignee field as recorded on each document; subsidiaries and group companies are not merged. The icon before each name is read from the name itself (words such as University, Institute or Ltd); the data carries no organisation-type field, so treat it as a reading aid rather than a classification. Filings held by named individuals rather than organisations are removed where they can be identified; that identification is not exhaustive, so an individually held filing can still appear below. Either way those filings stay inside the totals above. This table shows the top 15 of the 15 filers returned for this search; the data endpoint returns at most 100 entities, so even that 15 is not the complete set of filers. A single family can name more than one filer, so these counts overlap and do not add up to the total.
Pick a task. Every answer cites the patents behind it.
The figures below are drawn directly from the search results: a filing trend counted in published records, and a technology breakdown counted in simple patent families.
Published records by earliest filing year, from 2012 (2 records) to a peak of 9 records in 2025. Records filed from 2022 onward are still publishing and are shaded as incomplete; this series counts documents, not de-duplicated inventions, so it should not be read as a growth or decline signal.
Counted in published records by earliest filing year, not de-duplicated into families. A filing is counted in the year it was filed, but it only becomes visible after it publishes: roughly 18 months for most routes, and up to 30 months where a PCT application enters national phase. 2022 onwards are therefore still filling in and are shaded; no growth figure on this page uses them. Because this series counts documents rather than inventions, a rise can mean more inventions or the same inventions filed in more countries; this dataset cannot separate the two.
G06F (Electric digital data processing) appears on all 23 simple patent families in scope (100.0%); G06N (Computing based on AI models) appears on 3 families (13.0%). Because a family can carry more than one class, these shares add up to more than 100% and share the same family-based denominator as the chart.
Shares are the percentage of the 23 patent families in scope. One patent family can carry several IPC classes, so the shares add up to more than 100%.
This page is one run against one query. Ask Eureka your own question about graph computing distributed graph query execution plan optimization patent landscape and every answer comes back with the patent numbers behind it.
Try EurekaA method and system for managing an execution plan in a graph database includes: acquiring a graph query language, analyzing the graph query language by using a scanner to generate a predefined Token, and parsing the predefined Token into a data structure by using a parser to obtain an abstract syntax tree; next, processing the abstract syntax tree by using a planner to generate an execution plan, registering a mapping table to store variables in the execution plan and corresponding variable values, and optimizing the execution plan by using an optimizer, where the execution plan includes customized execution operators and customized topologies; and finally, traversing and scheduling the exeThis is the first record returned under the database's default order, not the most cited, newest or broadest filing. It is shown to illustrate what one filing in this result set actually describes.
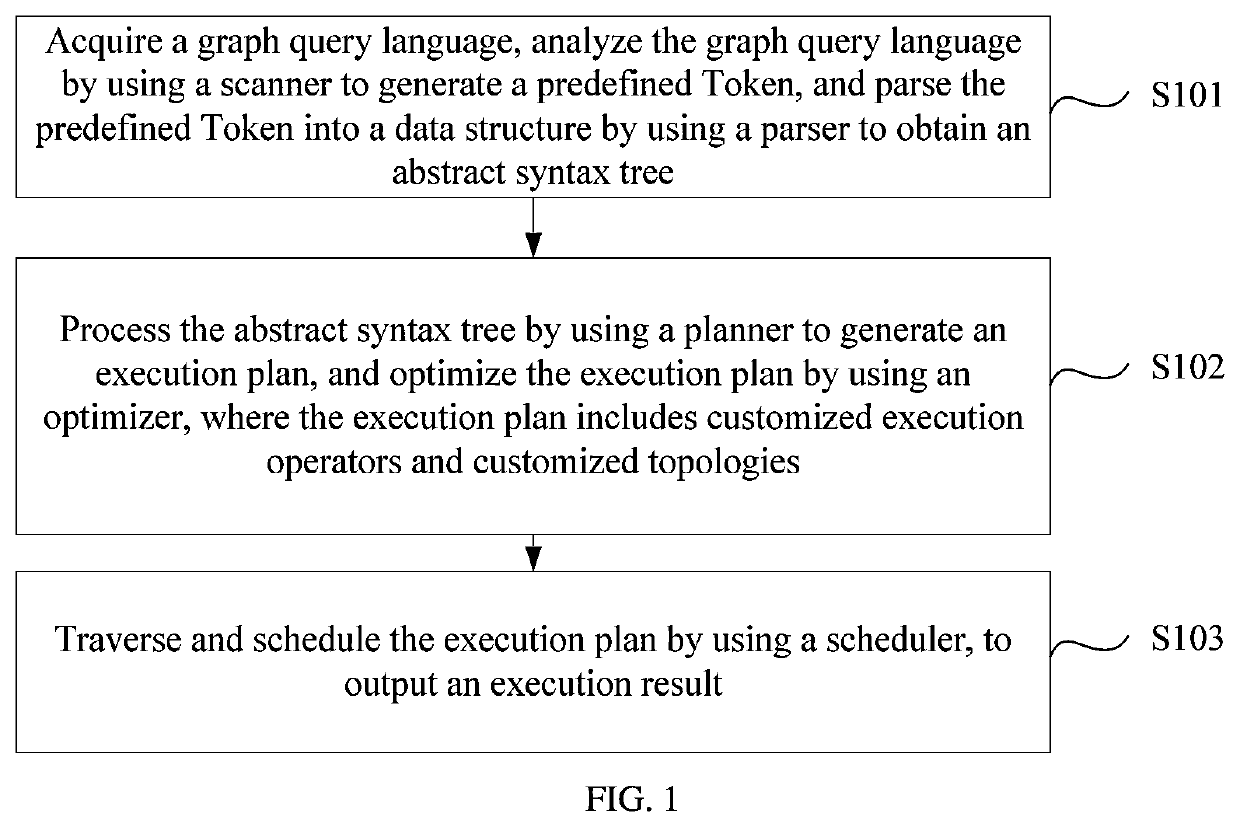
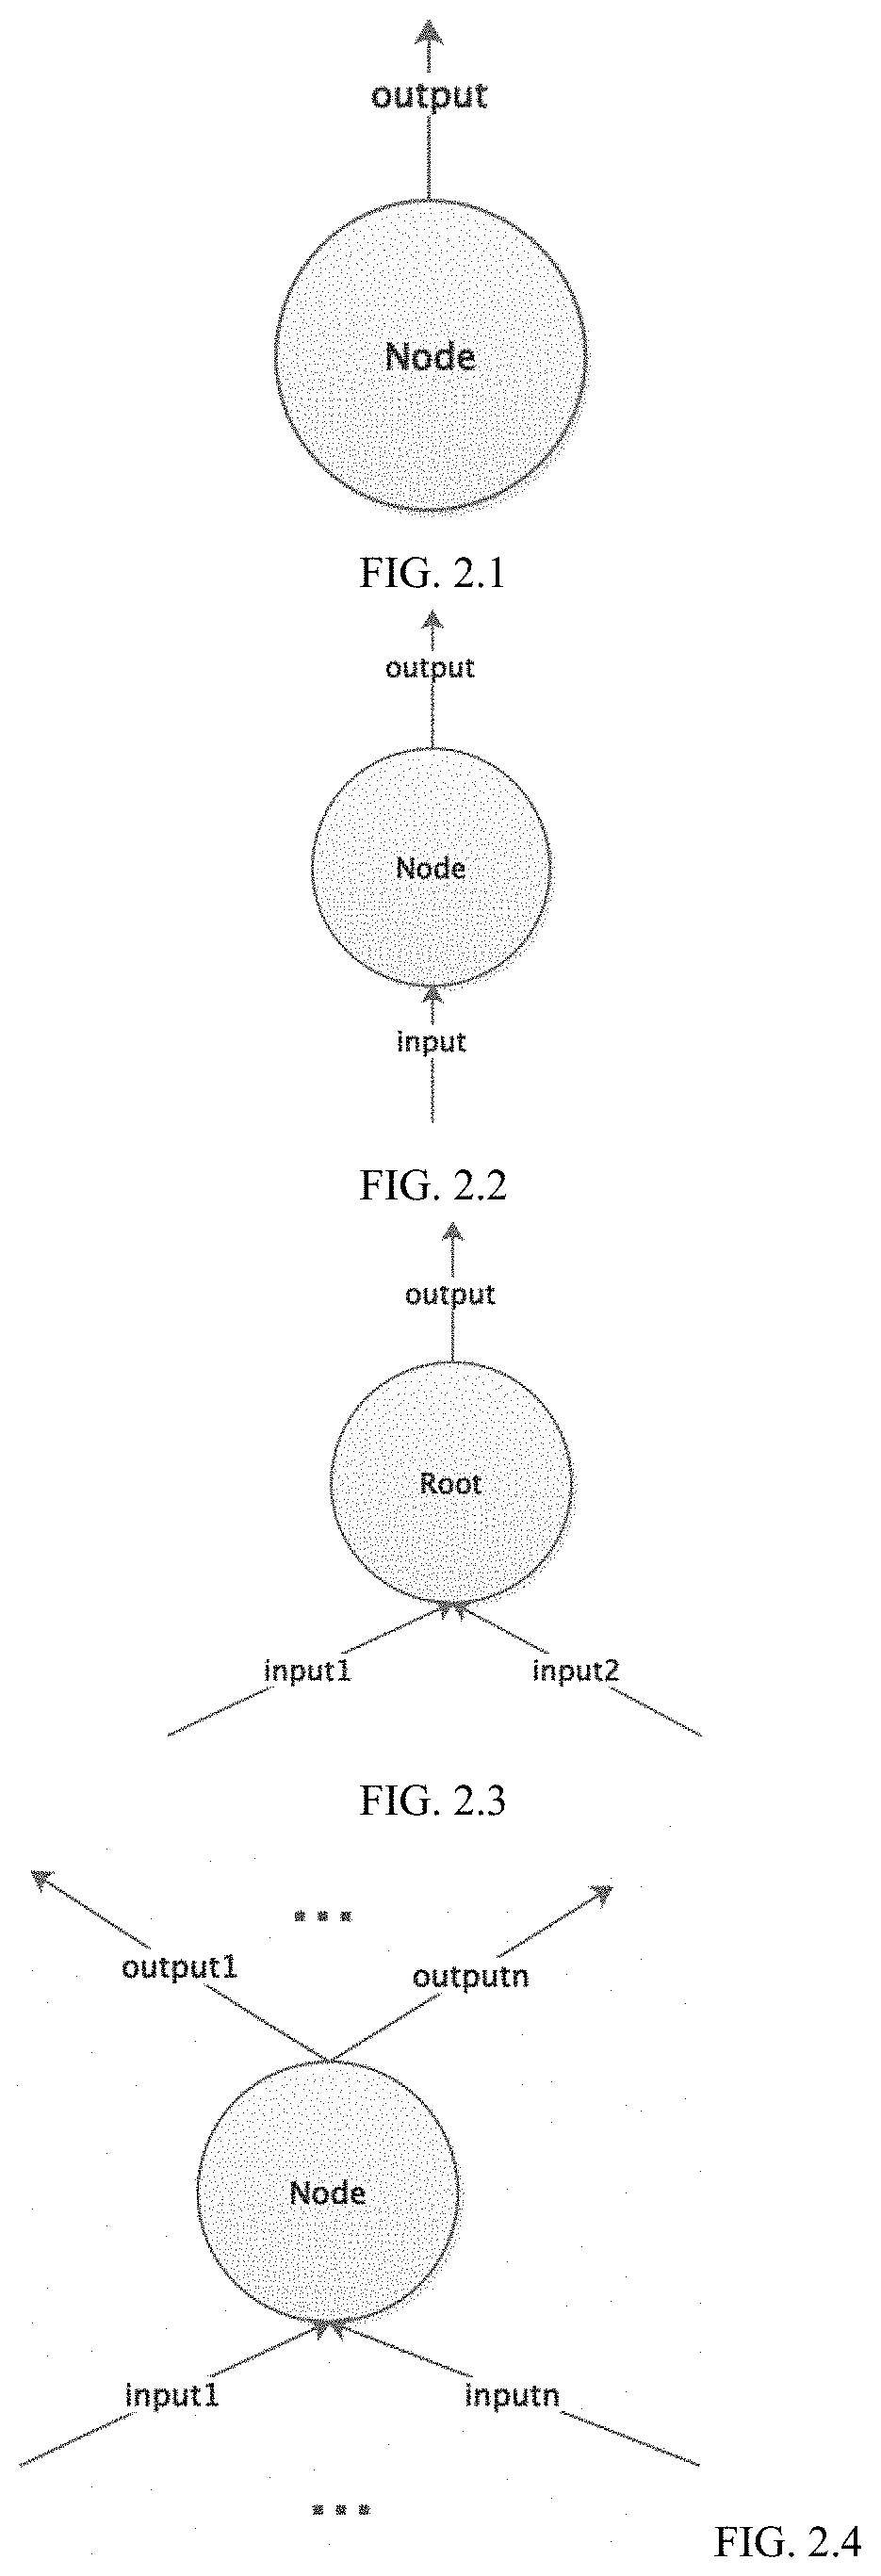
Selected as the first record the search returns under the database default order, then shown in full. It is not ranked by citations, claim breadth or commercial importance, and it is not a judgement about which filing in this space matters most.
When you want the answer in the next five minutes.
The agent works the prompt against patents and technical literature, citing every source.
Run your analysis now →When it has to run inside your own pipeline.
Patent search, landscape analysis and assignee resolution as MCP tools. Drop them into any agent framework, or call REST directly.
Browse MCP servers →Three figures from this dataset are worth sitting with before reading the tables below: who holds the largest single row, how classification coverage splits, and what legal status looks like at retrieval.
Alipay (Hangzhou) Information Tech Co Ltd and Microsoft Technology Licensing LLC each appear on 4 of the 23 simple patent families (17.4%), the largest single-row figure in the listed filers. Thirteen of the 15 listed filers hold 2 or fewer families each. Filer rows overlap because one family can name more than one filer, so these counts cannot be added together into a combined share.
G06F, Electric digital data processing, appears on all 23 simple patent families in scope. G06N, Computing based on AI models, appears on 3 families (13.0%). Because one family can carry more than one classification, these two figures add up to more than 100% of the family total.
At the 2026-10-16 retrieval date, 17 of the 32 published records (53%) were granted and still in force. The remaining records are not broken out further in this dataset; this status reflects a point in time and changes as records move through prosecution or expire.
Counted by published record, China received 13 filings, the United States 12, the European Patent Office 3, Canada 2, and WIPO (PCT) 2. These counts show where applications were filed, not where any filer is based, since no nationality data is attached to filers in this dataset.
Eureka can read the same corpus for gaps instead of for coverage: under-claimed branches adjacent to graph computing distributed graph query execution plan optimization patent landscape, with the prior art for and against each one.
The figures above cover the headline counts. Eureka lets you pull the full filer list, the granted claim sets, and the complete record-level detail behind every number on this page.
An abstract describes what a filing discusses, not what its claims legally cover. Pull the granted claim set for any record in this dataset before drawing conclusions about scope.
Open claims in EurekaOnly the listed filers are shown here, ordered by family count. Review the underlying list and individual filings to see how the 23 families break down.
View filer list in EurekaRecords filed since 2022 are still publishing and are understated in the current trend. Set up monitoring to catch new records as they appear.
Set up tracking in EurekaThis search returns 32 published records, which de-duplicate to 23 simple patent families, using the string TAC:(("graph database*" OR "graph query") AND ("execution plan") AND (optimiz*)). The query carries no date limit, so the result set is whatever filing dates the matching text happens to cover, not a defined historical span. Because the pool is this small, the dataset is better used as a starting point for a targeted search than as a complete map of every filing that touches this topic.
Two filers are tied at the top: Alipay (Hangzhou) Information Tech Co Ltd and Microsoft Technology Licensing LLC each appear on 4 of the 23 simple patent families (17.4%). Thirteen of the 15 listed filers hold 2 or fewer families each, which is the honest way to describe how spread the filings are across this list. The filer rows cannot be summed into a combined share because one family can name more than one filer, so the rows overlap in an amount this dataset does not resolve.
The published abstract for US20230062233A1, filed by Vesoft Inc, describes a method for managing an execution plan in a graph database: it parses a graph query language into an abstract syntax tree, builds an execution plan with a planner, registers a mapping table for variables, and optimizes the plan with an optimizer using customized operators and topologies. An abstract is a summary, not the claim set, so it cannot establish what the granted claims require or how broadly they reach. Anyone assessing freedom to operate against this filing needs to read the granted claims directly rather than infer scope from the abstract or from the family count.
Counted by receiving office across the published records, China received 13 filings, the United States 12, the European Patent Office 3, Canada 2, and WIPO (PCT) 2. These figures count where applications were filed, not where any filer is based, since this dataset carries no nationality information for filers. A single invention can appear at more than one office, so these counts are not a measure of distinct inventions.
G06F, Electric digital data processing, appears on all 23 simple patent families in scope, a 100.0% share. G06N, Computing based on AI models, appears on 3 families, 13.0% of the total. Because a family can carry more than one classification, these shares add up to more than 100% and should not be read as parts of a whole; they describe how often each subclass appears, not how the filings divide between them.
Go past this page: query the whole graph computing distributed graph query execution plan optimization patent landscape corpus yourself, in your own scope.
Every answer comes back with patent numbers you can open.
Search. Every figure on this page comes from one Patsnap search, run once and not edited afterwards. This is the exact search string:
TAC:(("graph database*" OR "graph query") AND ("execution plan") AND (optimiz*))Reading the field codes: TAC searches the title, abstract and claims of each record, not the full description. The search string sets no date limit, so the scope is every matching record in the database regardless of when it was filed. It is not restricted to recent years. How this string was built matters for how far the counts can be pushed. It was generated in batch from a topic list rather than hand-crafted for this page, and the result set is not manually screened. A keyword search over title, abstract and claims both over-captures (unrelated filings that happen to use the same words) and under-captures (the same invention written in different words). This page cannot measure either effect, so read every figure here as what this particular string returned, not as what exists in the field. One subclass (G06F) carries 100.0% of the patent families, so this search returned a classification-tight set.
What is being counted. Two different units appear on this page and they are not interchangeable. The filer list and the technology split are counted in simple (DOCDB) patent families: one invention counts once however many countries it was filed in. The total, the jurisdiction split and the filing-year chart are counted in published records: the same invention counts once per publication. For this search that is 32 records and 23 families. Record counts reward filing in many jurisdictions; family counts do not. Shares are only ever taken against a denominator in the same unit, and each one names it.
Who the filers are. Names come from Patsnap's standardised assignee field, as recorded on the documents themselves. They are not rolled up to corporate group: a parent and its subsidiaries appear as separate entries, and a portfolio acquired from another company stays under the name on the document unless the assignment is reflected there. This list is meant to carry organisations, not people. Filings held by a named individual are identified by matching the assignee against the inventors on the same search, and, for names written in Chinese, Japanese or Korean characters, by the name carrying no organisational suffix; those are removed from the list. Neither test is exhaustive: the inventor list it matches against is itself capped, and a personal name written in Latin script with no organisational wording in it cannot be told apart from a short company name by rule. So an individually held filing can still appear in the list. Those filings stay inside every total and share on this page either way, so the listed entries can add up to less than the total. A record shown in full further down still names its assignee exactly as the patent office records it, including where that is a person: that name is how the record is identified and checked. What is left out of the ranking is people as ranked entries, not people as cited sources. The table shows the top 15 of the 15 filers returned, ordered by count alone; the data endpoint returns at most 100 entities, so even that 15 is not every filer. One patent family can name several filers and each is counted separately, so these rows are not slices of a divided whole: adding them together over-counts, and this page deliberately publishes no combined "top five" share for that reason. See every filer, individuals included
Dates. The year chart counts by earliest filing year, not publication year. A filing only becomes visible once it publishes: roughly 18 months for most routes, and up to 30 months where a PCT application enters national phase. Measured across these pages, the year four back from today still holds only about 89% of its eventual count. 2022 onwards are therefore shaded on the chart as still filling in. The data behind this page was retrieved on 2026-10-16.
Legal status. "In force" counts documents whose legal status at retrieval was granted and maintained (17 of 32). Everything else is pending, withdrawn, refused, lapsed or not determinable, and those states are not broken out here because the underlying codes do not separate them cleanly. Legal status changes continuously and is reported per document, not per family. Get the status breakdown in Eureka
Classification. The technology split uses IPC subclasses (four characters, for example H01M). A single record usually carries several, so the shares add up to more than 100% and a record can appear in more than one bar. Subclass is a coarse grouping; it describes the field a record was classified into, not what the claims cover. Break the classes down to subgroup level
Who wrote the words. The tables, charts, counts, shares and patent numbers on this page are produced directly from the search result by a program; none of them are written or estimated by a language model. The surrounding prose, headings, FAQ answers and the answers in the question panel are drafted by a language model that is given those same figures and is not permitted to introduce others. Prose can still mis-describe a correct figure, so where the two disagree, the tables and charts are the record.
Disclaimer. This page is generated from Patsnap Eureka data drawn from a limited snapshot of global patent and scientific-literature records, and is provided for general information and reference only.
Patent data carries limitations that apply to every figure above. Recent filings are under-counted, because an application is not public until roughly 18 months after filing and database loading adds further delay. The search string defines and constrains everything shown: records that use different terminology, or that sit outside the fields searched, are absent and cannot be counted. Applicant names, classification codes, legal-status codes and citation records are taken as recorded and may contain errors, duplicates, omissions or stale entries. Ordering by volume is not a measure of quality, scope, enforceability or commercial value, and a larger portfolio is not a stronger one. As a result, the analysis may be incomplete or inaccurate and may not reflect the full technology landscape.
Nothing on this page constitutes an exhaustive prior-art, novelty, freedom-to-operate, validity or infringement search, nor does it constitute legal, financial, investment, or professional advice, and it should not be relied upon as such. No attorney-client relationship is created by it. Any patent, commercial, or strategic decision should be verified independently against the primary records and reviewed with qualified patent, legal, and domain professionals. Patsnap makes no warranties, express or implied, as to the accuracy, completeness, or fitness for any particular purpose of the information presented.
The question panel. The answers behind the suggested questions on this page were written when the page was generated, not in response to your click. The progress steps that play before an answer appears are an animation of how that analysis was done; nothing is being searched or computed at that moment. Typing your own question instead opens Patsnap Eureka, which does run it live.
Machine translation. Assignee and organisation names originally recorded in Chinese, Japanese or Korean have been rendered into English by an AI translation step so that the tables stay readable. These renderings are best-effort and may not match a company's registered English name; the original name is what the underlying patent record carries, and it is what any Eureka query launched from this page uses.
Help us improve
Something wrong, out of date, or missing on this page? Tell us and it goes straight to the team that maintains it.
This page