Explaining Statistical Process Control (SPC) for Quality Measurements
JUL 17, 2025 |
In the world of quality measurements, ensuring the consistency and reliability of processes is vital. This is where Statistical Process Control (SPC) comes into play. SPC is a method of quality control that employs statistical methods to monitor and control a process. By consistently measuring and analyzing variations in process outputs, organizations can maintain quality and improve processes over time.
The Role of Variation in Processes
Variation is a natural part of any process. However, understanding and controlling this variation is critical to maintaining quality. SPC focuses on distinguishing between two types of variation: common cause and special cause. Common cause variation is inherent in the process and is predictable within certain limits. Special cause variation, on the other hand, arises from external factors and indicates a process that is out of control. Identifying these variations allows organizations to apply corrective measures effectively.
Tools and Techniques in SPC
Control Charts
One of the primary tools used in SPC is the control chart. Control charts are graphical representations that show how a process varies over time. By plotting data points of a particular measurement against time, control charts help identify variations that fall outside the expected range. They typically include a central line (mean), an upper control limit, and a lower control limit, which together define the boundaries of normal variation.
Histograms
Histograms are another essential tool in SPC. They provide a visual representation of the distribution of data points within a process. By categorizing data into different intervals or bins, histograms reveal the frequency of variation and help in understanding the overall distribution pattern. This information is crucial for identifying trends or shifts in the process.
Cause and Effect Diagrams
Also known as fishbone diagrams, cause and effect diagrams are useful for identifying potential causes of variation. These diagrams break down potential factors into categories such as materials, methods, equipment, and personnel. By systematically analyzing these categories, teams can pinpoint the root cause of variations and take corrective actions to eliminate them.
Benefits of Implementing SPC
The implementation of SPC offers numerous benefits to organizations seeking to improve their operations. Firstly, it enhances product quality by monitoring and controlling variations, thus reducing defects and ensuring consistency. Secondly, SPC increases efficiency by identifying areas for improvement and optimizing processes. This leads to reduced waste, lower costs, and improved productivity. Furthermore, SPC provides a framework for continuous improvement, allowing organizations to adapt to changing conditions and requirements.
Challenges in Adopting SPC
Despite its advantages, implementing SPC can pose several challenges. One common hurdle is the cultural shift required within an organization. Embracing statistical methods and data-driven decision-making may necessitate change management efforts and training. Additionally, collecting and analyzing data can be resource-intensive, requiring investments in technology and personnel. Organizations must be ready to commit time and resources to successfully integrate SPC into their operations.
Conclusion
Statistical Process Control is a valuable tool for organizations committed to quality improvement. By understanding and controlling variations in processes, businesses can enhance product quality, increase efficiency, and foster a culture of continuous improvement. While the implementation of SPC may present challenges, the long-term benefits far outweigh the initial investment. As organizations continue to strive for excellence, SPC will remain a cornerstone of effective quality management.
Whether you’re developing multifunctional DAQ platforms, programmable calibration benches, or integrated sensor measurement suites, the ability to track emerging patents, understand competitor strategies, and uncover untapped technology spaces is critical.
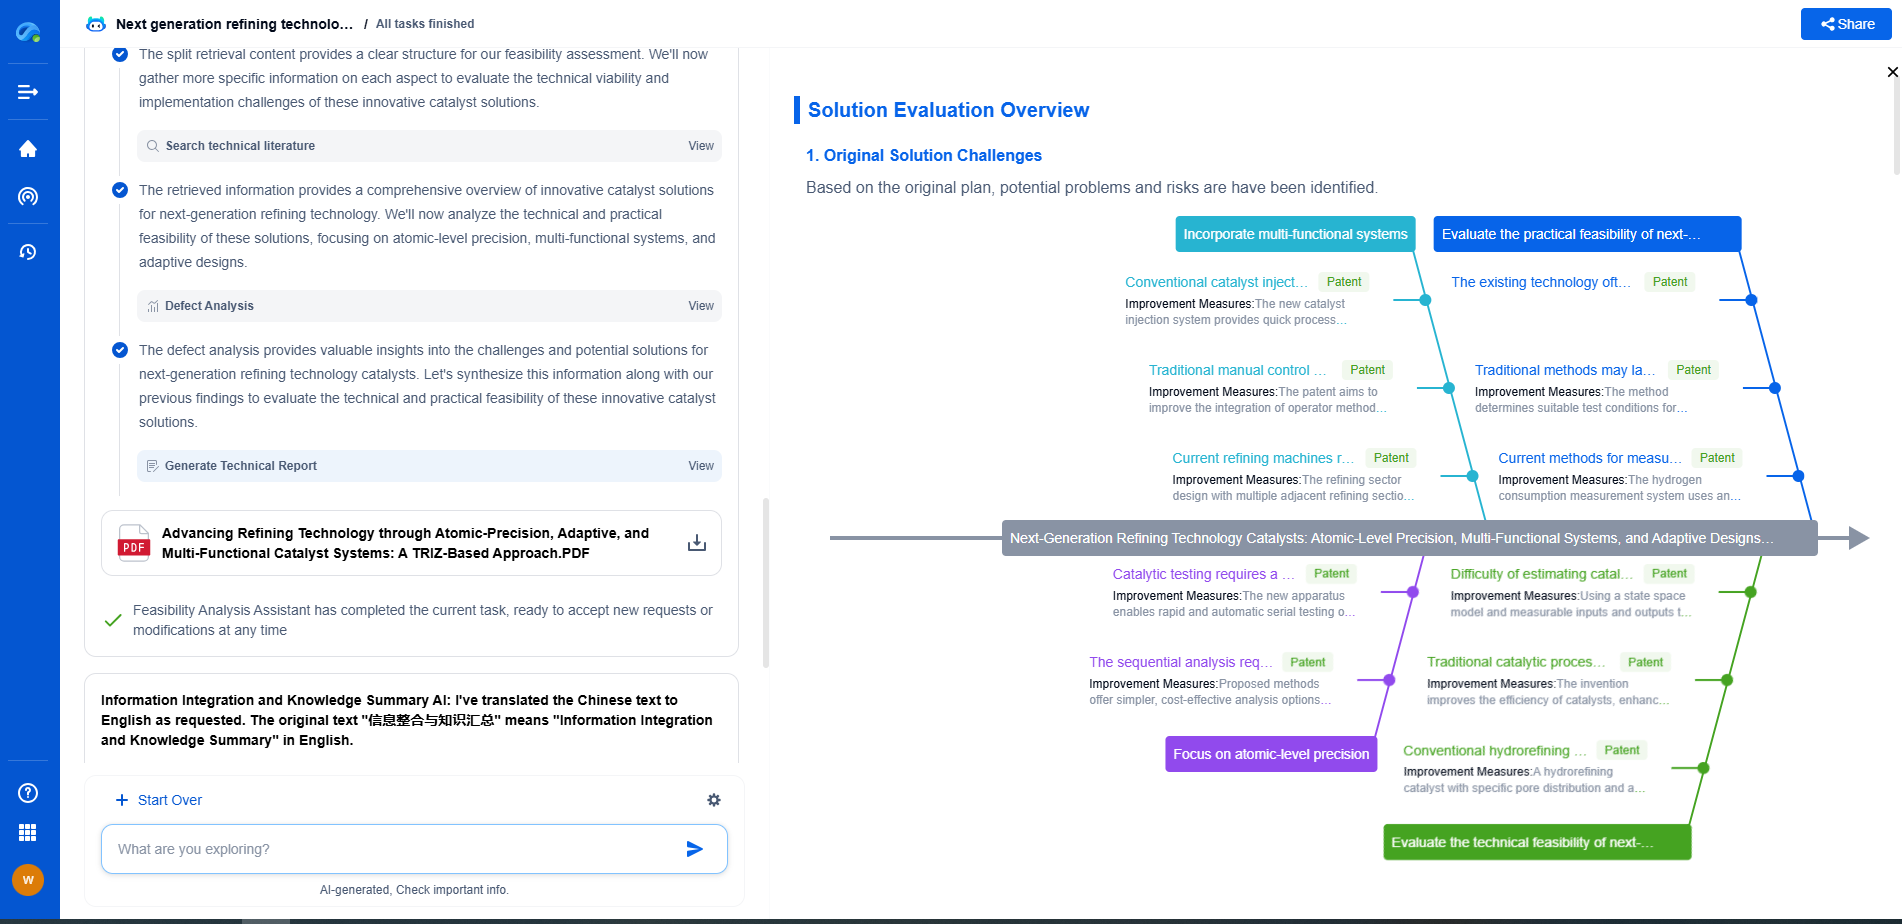
Patsnap Eureka, our intelligent AI assistant built for R&D professionals in high-tech sectors, empowers you with real-time expert-level analysis, technology roadmap exploration, and strategic mapping of core patents—all within a seamless, user-friendly interface.
🧪 Let Eureka be your digital research assistant—streamlining your technical search across disciplines and giving you the clarity to lead confidently. Experience it today.
- R&D
- Intellectual Property
- Life Sciences
- Materials
- Tech Scout
- Unparalleled Data Quality
- Higher Quality Content
- 60% Fewer Hallucinations
Browse by: Latest US Patents, China's latest patents, Technical Efficacy Thesaurus, Application Domain, Technology Topic, Popular Technical Reports.
© 2025 PatSnap. All rights reserved.Legal|Privacy policy|Modern Slavery Act Transparency Statement|Sitemap|About US| Contact US: help@patsnap.com

