How to Identify Performance Bottlenecks in Your System
JUL 4, 2025 |
When it comes to optimizing system performance, identifying bottlenecks is a crucial step. Performance bottlenecks occur when a specific part of a system becomes overloaded, slowing down the entire process. These can arise in various components such as CPU, memory, disk, or network. Understanding these bottlenecks is essential to enhancing the efficiency and speed of your system.
Identifying CPU Bottlenecks
The CPU is often the first area to check for performance bottlenecks. A CPU bottleneck occurs when the processor cannot keep up with the demands placed on it by applications. This can cause slower processing speeds and can be identified by monitoring CPU usage. If the CPU consistently runs at high utilization levels, it’s a clear indicator of a bottleneck. Tools like Task Manager for Windows or Activity Monitor for macOS can provide insights into CPU load, helping you to pinpoint processes that are consuming excessive resources.
Recognizing Memory Bottlenecks
Memory bottlenecks occur when a system runs out of RAM and starts using disk space to compensate, which significantly slows down performance. Signs of memory bottlenecks include excessive swapping or paging, slow application load times, and high memory utilization. Monitoring tools such as Windows Resource Monitor or macOS’s Activity Monitor can help you track memory usage. If the system frequently utilizes virtual memory, it may be time to upgrade your RAM or optimize memory usage by closing unnecessary applications.
Detecting Disk Bottlenecks
Disk bottlenecks are often characterized by slow read/write speeds and long load times for applications and files. This can happen when the disk is overburdened with data requests that exceed its capacity. To identify disk bottlenecks, observe disk usage statistics using tools like Windows Performance Monitor or macOS’s Disk Utility. If you find that the disk is consistently at high utilization, consider upgrading to a faster disk, such as a Solid State Drive (SSD), or implementing disk defragmentation to improve performance.
Spotting Network Bottlenecks
Network bottlenecks are common in environments where data is constantly being transmitted across systems. Symptoms include slow data transfer rates and lag in network applications. Network bottlenecks can be diagnosed by analyzing network traffic using tools such as Wireshark or NetFlow analyzers. High latency and packet loss are key indicators of network congestion. Solutions may involve upgrading network bandwidth, managing network traffic more efficiently, or optimizing network configurations.
Analyzing Application Bottlenecks
Sometimes, the bottleneck may not be in the hardware, but within the software itself. Application bottlenecks occur when an application is inefficiently consuming resources, leading to reduced performance. These can be identified by profiling the application to understand its resource usage patterns. Use application performance management (APM) tools to gain insights into code-level issues, database queries, and API response times. Optimizing code, upgrading application versions, or implementing caching mechanisms can often resolve these bottlenecks.
Best Practices for Monitoring and Resolution
To effectively tackle performance bottlenecks, continuous monitoring is key. Implement monitoring solutions that provide real-time insights and alerts for resource utilization. This proactive approach enables you to recognize and address bottlenecks before they become critical issues.
Once identified, resolving bottlenecks may involve a combination of hardware upgrades, software optimizations, or reconfigurations. Prioritize solutions based on the severity and impact of the bottleneck. Regularly updating and maintaining your system, along with adopting best practices for resource management, will contribute to sustained performance improvements.
Conclusion
Identifying and resolving performance bottlenecks is a vital aspect of system maintenance and optimization. By understanding the various components that can cause bottlenecks and employing effective monitoring and diagnostic tools, you can enhance the overall performance of your system. Remember, the goal is not just to fix current bottlenecks but to implement strategies that prevent them from occurring in the future.
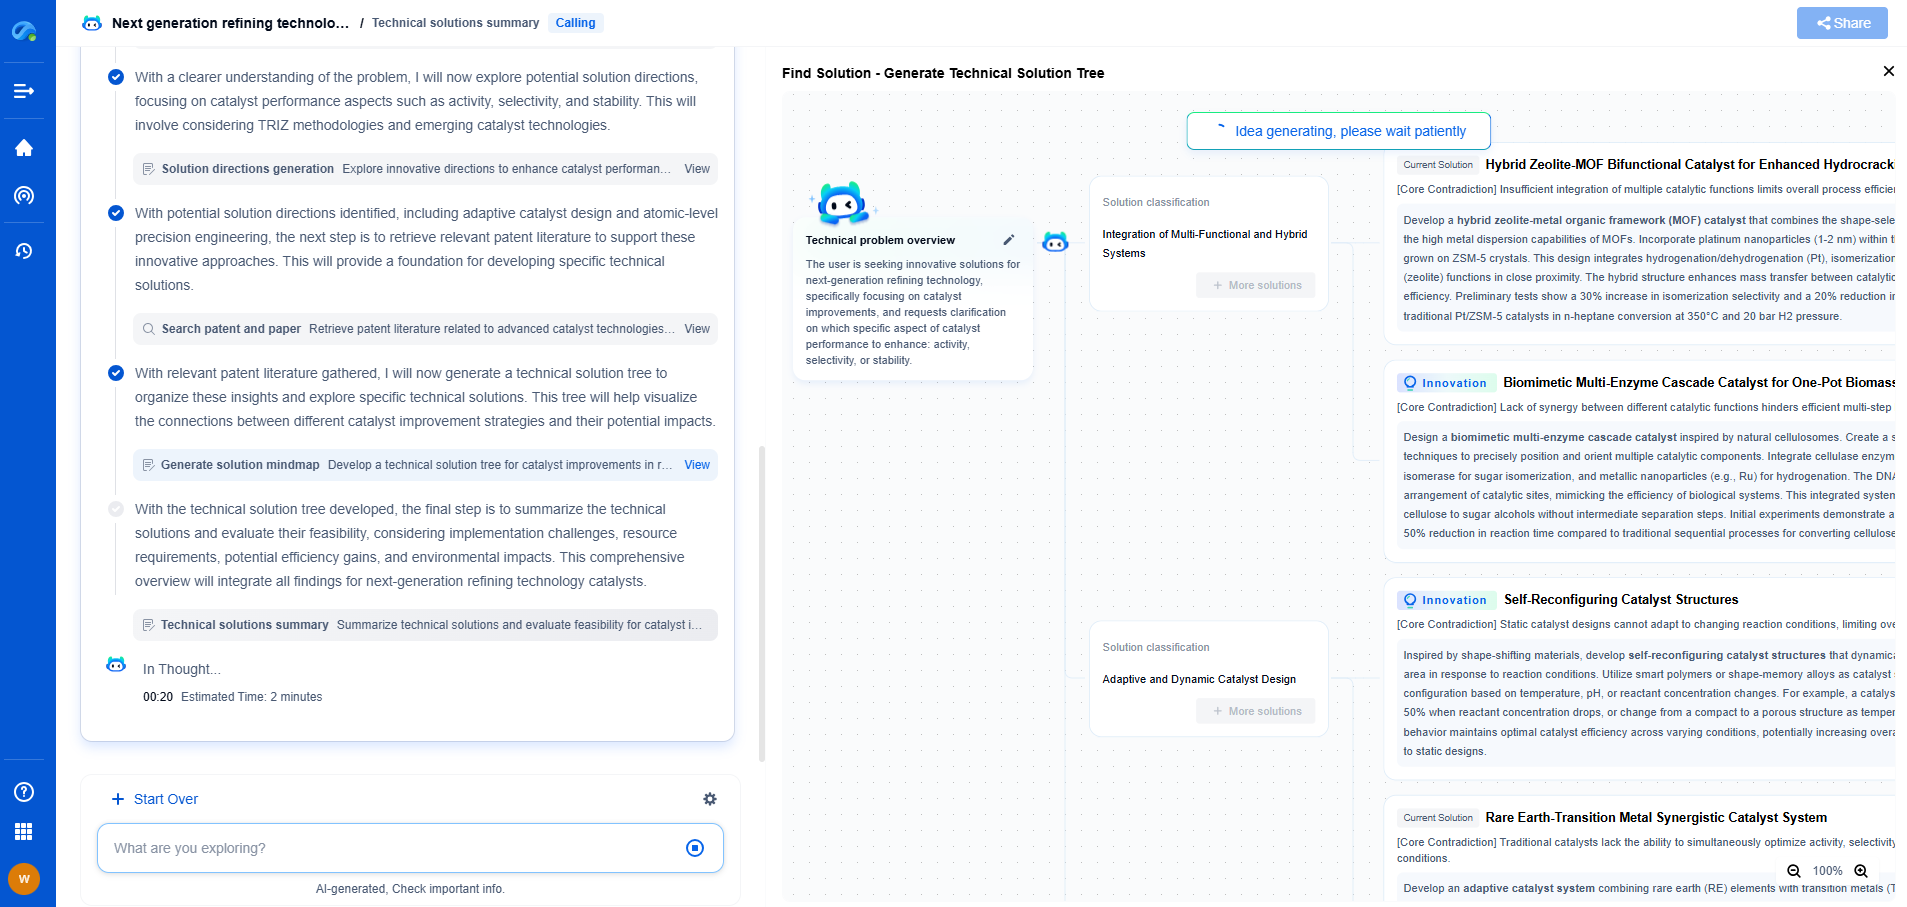
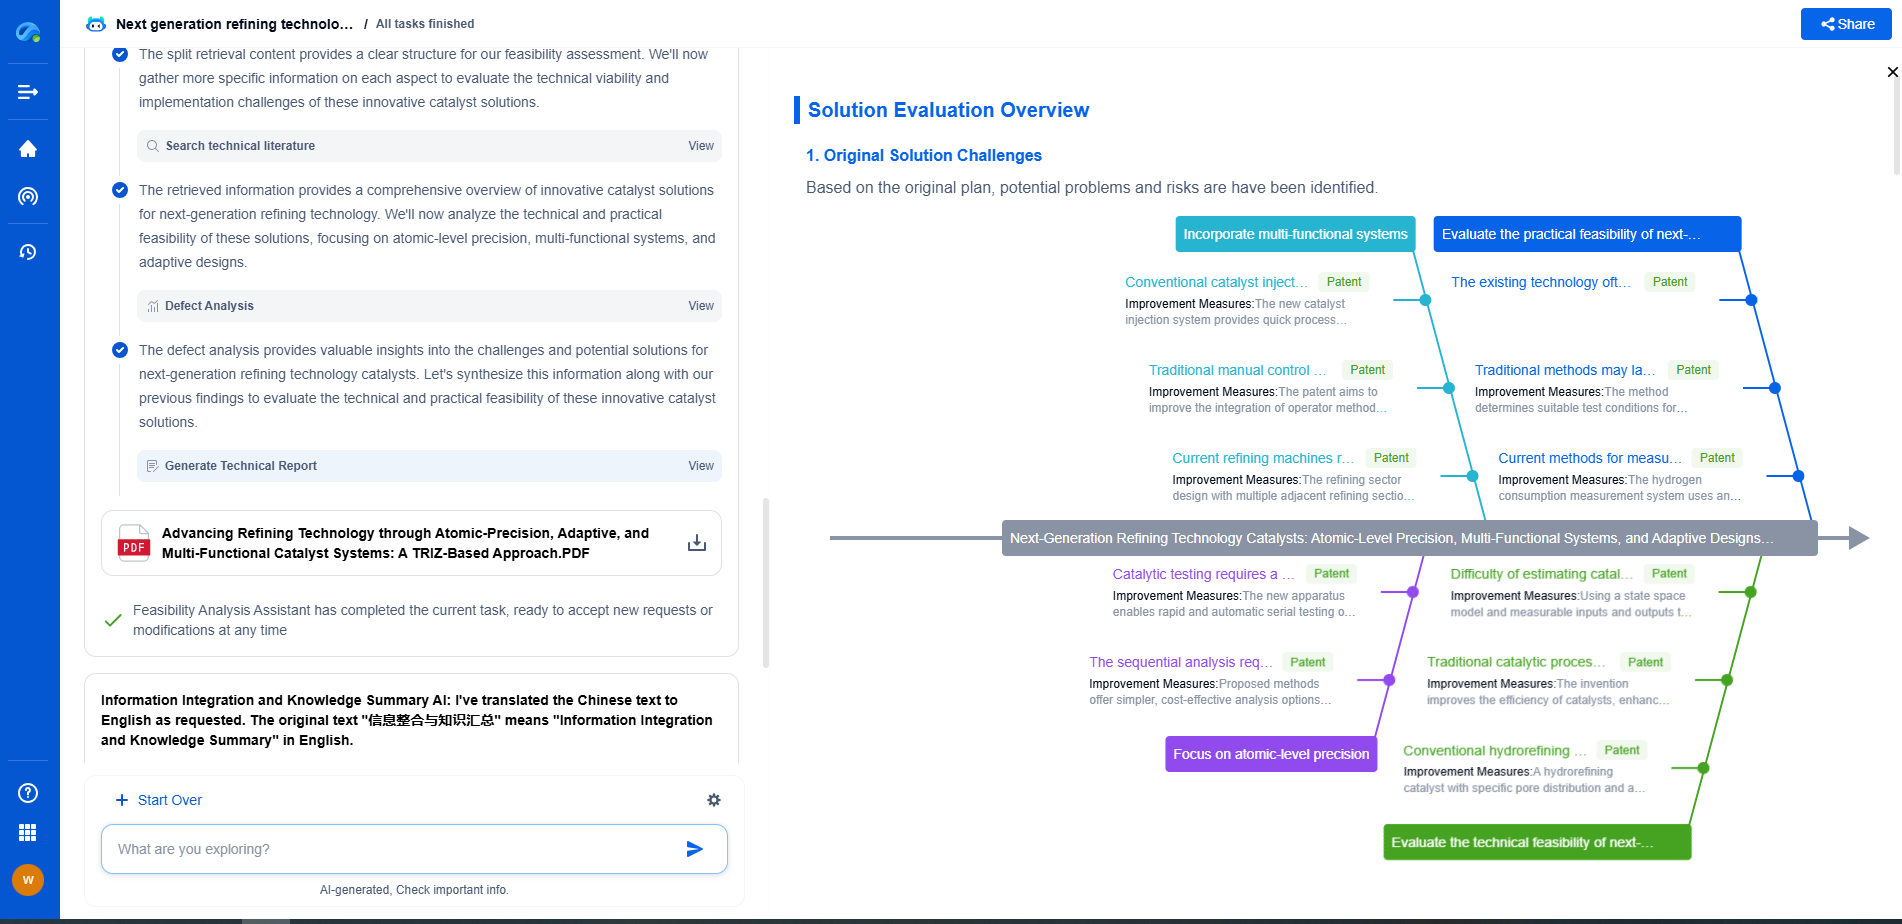
Accelerate Breakthroughs in Computing Systems with Patsnap Eureka
From evolving chip architectures to next-gen memory hierarchies, today’s computing innovation demands faster decisions, deeper insights, and agile R&D workflows. Whether you’re designing low-power edge devices, optimizing I/O throughput, or evaluating new compute models like quantum or neuromorphic systems, staying ahead of the curve requires more than technical know-how—it requires intelligent tools.
Patsnap Eureka, our intelligent AI assistant built for R&D professionals in high-tech sectors, empowers you with real-time expert-level analysis, technology roadmap exploration, and strategic mapping of core patents—all within a seamless, user-friendly interface.
Whether you’re innovating around secure boot flows, edge AI deployment, or heterogeneous compute frameworks, Eureka helps your team ideate faster, validate smarter, and protect innovation sooner.
🚀 Explore how Eureka can boost your computing systems R&D. Request a personalized demo today and see how AI is redefining how innovation happens in advanced computing.
- R&D
- Intellectual Property
- Life Sciences
- Materials
- Tech Scout
- Unparalleled Data Quality
- Higher Quality Content
- 60% Fewer Hallucinations
Browse by: Latest US Patents, China's latest patents, Technical Efficacy Thesaurus, Application Domain, Technology Topic, Popular Technical Reports.
© 2025 PatSnap. All rights reserved.Legal|Privacy policy|Modern Slavery Act Transparency Statement|Sitemap|About US| Contact US: help@patsnap.com

