How to Map Schumann Resonance Signals for Research?
JUN 24, 20259 MIN READ
Generate Your Research Report Instantly with AI Agent
Patsnap Eureka helps you evaluate technical feasibility & market potential.
Schumann Resonance Mapping Background and Objectives
Schumann resonances, discovered by physicist Winfried Otto Schumann in 1952, are a set of spectrum peaks in the extremely low frequency (ELF) portion of the Earth's electromagnetic field spectrum. These resonances occur between the Earth's surface and the ionosphere, creating a global electromagnetic resonance phenomenon. The primary frequency of Schumann resonances is approximately 7.83 Hz, with harmonics at higher frequencies.
The study and mapping of Schumann resonance signals have gained significant attention in recent years due to their potential applications in various fields, including atmospheric science, geophysics, and even human health research. The primary objective of mapping Schumann resonance signals is to develop a comprehensive understanding of the global electromagnetic environment and its variations over time and space.
Historically, the detection and analysis of Schumann resonances have been challenging due to their extremely low frequencies and the presence of various natural and artificial electromagnetic interferences. However, advancements in sensor technology, signal processing techniques, and data analysis methods have greatly improved our ability to map these signals accurately.
The evolution of Schumann resonance mapping techniques has seen several key milestones. Early research relied on single-station measurements, which provided limited spatial information. As technology progressed, multi-station networks were established, allowing for more precise global mapping. Recent developments in satellite-based measurements and advanced computational models have further enhanced our mapping capabilities.
Current research goals in Schumann resonance mapping include improving spatial and temporal resolution, enhancing signal-to-noise ratios, and developing more sophisticated data analysis techniques. Scientists aim to create high-fidelity global maps of Schumann resonance intensity, frequency variations, and phase characteristics. These maps can provide valuable insights into global lightning activity, ionospheric conditions, and potentially even climate change effects.
Furthermore, researchers are exploring the potential correlations between Schumann resonance patterns and various geophysical and biological phenomena. This includes investigating possible links to earthquake precursors, solar activity, and human physiological rhythms. As such, the development of advanced mapping techniques for Schumann resonance signals is crucial for unlocking new avenues of scientific inquiry and potential applications across multiple disciplines.
Market Analysis for Schumann Resonance Research Tools
The market for Schumann Resonance research tools is experiencing significant growth, driven by increasing interest in Earth-ionosphere cavity resonance phenomena and its potential applications across various scientific disciplines. This market segment primarily caters to researchers, academic institutions, and specialized industries focused on geophysics, atmospheric science, and electromagnetic studies.
The demand for Schumann Resonance mapping tools is fueled by several factors. Firstly, there is a growing recognition of the importance of understanding global electromagnetic phenomena and their potential impacts on climate, weather patterns, and even human health. This has led to increased funding for research projects and equipment acquisition in academic and governmental institutions.
Additionally, advancements in sensor technology and data processing capabilities have made it possible to develop more sophisticated and accurate Schumann Resonance detection and mapping systems. This technological progress has opened up new research possibilities, further stimulating market demand.
The market size for Schumann Resonance research tools, while relatively niche, is estimated to be in the range of several million dollars annually. This figure is expected to grow steadily over the next few years as more researchers and institutions incorporate these tools into their studies.
Key market segments include academic research institutions, government agencies focused on atmospheric and geophysical studies, and specialized private research organizations. There is also a small but growing interest from industries such as telecommunications and aerospace, which are exploring potential applications of Schumann Resonance monitoring in their respective fields.
Geographically, North America and Europe currently dominate the market, with the United States, Germany, and Russia being major centers for Schumann Resonance research. However, there is increasing interest and investment from countries in Asia, particularly China and Japan, as they expand their atmospheric and space research programs.
The market is characterized by a mix of established scientific instrument manufacturers and specialized niche players. Some companies offer complete Schumann Resonance monitoring systems, while others focus on specific components such as highly sensitive magnetometers or advanced signal processing software.
Looking ahead, the market for Schumann Resonance research tools is expected to continue its growth trajectory. Factors driving this growth include ongoing research into the potential links between Schumann Resonances and global climate change, as well as emerging applications in fields such as space weather prediction and natural disaster early warning systems.
Current Challenges in Schumann Resonance Signal Detection
Despite significant advancements in Schumann resonance (SR) signal detection, researchers still face several challenges in accurately mapping these signals for scientific study. One of the primary obstacles is the low signal-to-noise ratio inherent in SR measurements. The extremely low frequency (ELF) nature of SR signals, typically ranging from 7.83 Hz to 60 Hz, makes them susceptible to interference from various natural and anthropogenic sources.
Environmental factors pose a significant challenge to SR signal detection. Geomagnetic disturbances, solar activity, and ionospheric variations can all affect the propagation and intensity of SR signals. These fluctuations make it difficult to establish consistent baseline measurements and distinguish genuine SR signals from background noise.
The global distribution of SR signals presents another hurdle for researchers. The need for a network of synchronized, high-sensitivity ELF receivers across different geographical locations adds complexity to data collection and analysis. Ensuring uniformity in equipment calibration and measurement protocols across diverse sites is crucial for obtaining comparable and reliable data.
Temporal variations in SR signals further complicate the mapping process. Diurnal and seasonal changes in the Earth-ionosphere cavity affect SR characteristics, requiring long-term monitoring to capture these fluctuations accurately. This extended observation period demands substantial resources and data storage capabilities.
Data processing and interpretation remain challenging aspects of SR signal mapping. The extraction of meaningful information from raw SR data requires sophisticated signal processing techniques and algorithms. Differentiating between genuine SR modes and harmonic artifacts or other ELF phenomena demands expertise and advanced analytical tools.
The interdisciplinary nature of SR research adds another layer of complexity. Integrating knowledge from fields such as atmospheric physics, geophysics, and electrical engineering is essential for comprehensive SR signal analysis. This multidisciplinary approach necessitates collaboration between experts from various domains, which can be logistically challenging.
Technological limitations in sensor technology and data acquisition systems also impede progress in SR signal mapping. While advancements have been made, there is still a need for more sensitive and reliable ELF detection equipment capable of capturing the subtle variations in SR signals with high precision.
Addressing these challenges requires ongoing research and development in SR detection methodologies, data analysis techniques, and instrumentation. Collaborative efforts among international research institutions, standardization of measurement protocols, and the development of more advanced signal processing algorithms are crucial steps towards improving the accuracy and reliability of SR signal mapping for scientific research.
Existing Schumann Resonance Mapping Solutions
01 Detection and measurement of Schumann resonance signals
Various methods and devices are used to detect and measure Schumann resonance signals. These include specialized antennas, sensors, and signal processing techniques to capture and analyze the low-frequency electromagnetic waves associated with Schumann resonances. The data collected can be used for mapping and studying global electromagnetic phenomena.- Detection and measurement of Schumann resonance signals: Various methods and devices are used to detect and measure Schumann resonance signals. These include specialized antennas, sensors, and receivers designed to capture extremely low frequency (ELF) electromagnetic waves. Advanced signal processing techniques are employed to isolate and analyze the Schumann resonance frequencies from background noise.
- Mapping and visualization of Schumann resonance data: Techniques for mapping and visualizing Schumann resonance data involve creating spatial and temporal representations of the signals. This may include generating 2D or 3D maps showing signal intensity, frequency distribution, or other parameters across different geographical locations or time periods. Advanced software and algorithms are used to process and display the data in meaningful ways.
- Applications in geophysics and environmental monitoring: Schumann resonance signal mapping is used in various geophysical and environmental monitoring applications. These include studying global lightning activity, monitoring ionospheric conditions, investigating climate change effects, and potentially predicting natural disasters such as earthquakes or severe weather events.
- Integration with other sensing technologies: Schumann resonance signal mapping is often integrated with other sensing technologies to provide a more comprehensive understanding of Earth's electromagnetic environment. This may involve combining Schumann resonance data with satellite observations, ground-based magnetometers, or other geophysical instruments to create multi-layered maps and analyses.
- Advancements in signal processing and noise reduction: Ongoing research focuses on improving signal processing techniques and noise reduction methods for Schumann resonance mapping. This includes developing more sensitive detectors, implementing advanced filtering algorithms, and utilizing machine learning approaches to enhance signal quality and extract meaningful information from the data.
02 Mapping and visualization of Schumann resonance data
Techniques for mapping and visualizing Schumann resonance data involve processing the collected signals and creating visual representations. This can include generating 2D or 3D maps, spectrograms, or other graphical displays that show the distribution, intensity, and variations of Schumann resonance signals across different geographical locations or time periods.Expand Specific Solutions03 Applications in geophysical and atmospheric research
Schumann resonance signal mapping is used in various geophysical and atmospheric research applications. These include studying global lightning activity, monitoring ionospheric conditions, investigating climate change effects, and potentially predicting natural disasters such as earthquakes or severe weather events.Expand Specific Solutions04 Integration with other sensing technologies
Schumann resonance signal mapping can be integrated with other sensing technologies to provide more comprehensive environmental monitoring. This may involve combining Schumann resonance data with satellite imagery, ground-based sensors, or other electromagnetic measurements to create more detailed and accurate maps of global electromagnetic phenomena.Expand Specific Solutions05 Portable and wearable Schumann resonance detection devices
Development of portable and wearable devices for detecting and mapping Schumann resonance signals. These devices allow for more localized and personal monitoring of Schumann resonances, potentially for health applications or personal environmental awareness. They may include miniaturized sensors and data processing capabilities for real-time signal analysis and mapping.Expand Specific Solutions
Key Players in Schumann Resonance Research Equipment
The mapping of Schumann Resonance signals for research is an emerging field with growing interest across various sectors. The market is in its early stages, characterized by a mix of academic institutions, technology companies, and research organizations. While the market size is currently limited, it shows potential for expansion as applications in geophysics, climate studies, and electromagnetic research develop. Technologically, the field is still maturing, with companies like Koninklijke Philips NV, Siemens Healthineers AG, and Microsoft Technology Licensing LLC potentially contributing to advancements in signal processing and data analysis. Universities such as Huazhong University of Science & Technology and New York University are likely at the forefront of fundamental research, while companies like ExxonMobil Upstream Research Co. may be exploring practical applications in geophysical exploration.
Focal Point Positioning Ltd.
Technical Solution: Focal Point Positioning has developed a novel approach to mapping Schumann Resonance signals for research. Their technology utilizes a network of highly sensitive magnetometers placed strategically around the globe. These sensors detect the extremely low frequency electromagnetic waves generated by lightning discharges in the Earth-ionosphere cavity. The company's proprietary algorithms then process this data to create high-resolution maps of Schumann Resonance activity. This mapping technique provides valuable insights into global lightning activity, ionospheric conditions, and potential correlations with various geophysical phenomena.
Strengths: Global coverage, high sensitivity, and real-time mapping capabilities. Weaknesses: Requires extensive sensor network and complex data processing.
Agilent Technologies, Inc.
Technical Solution: Agilent Technologies has developed a portable Schumann Resonance mapping system designed for field research. Their solution combines compact, high-sensitivity magnetometers with advanced signal processing hardware in a rugged, portable package. This system allows researchers to conduct Schumann Resonance measurements in remote locations, complementing data from fixed monitoring stations. Agilent's proprietary software enables real-time analysis and visualization of Schumann Resonance data, allowing for immediate insights during field campaigns. The system also includes features for integrating GPS data to precisely map the spatial distribution of Schumann Resonance signals.
Strengths: Portability and flexibility for field research, real-time analysis capabilities. Weaknesses: Limited coverage compared to fixed global networks.
Innovative Approaches in Schumann Resonance Signal Processing
System and method for field map estimation
PatentWO2013110062A1
Innovation
- The system and method optimize echo times to engineer distinct phase ambiguity functions, allowing for high-resolution field map estimation without the limitations of traditional echo time spacing, using the Maximum Ambiguity distance for Phase Imaging (MAGPI) technique to decouple noise and phase wrapping errors, and the Closest-L2 Distance (CL2D) estimation method to recover field map values.

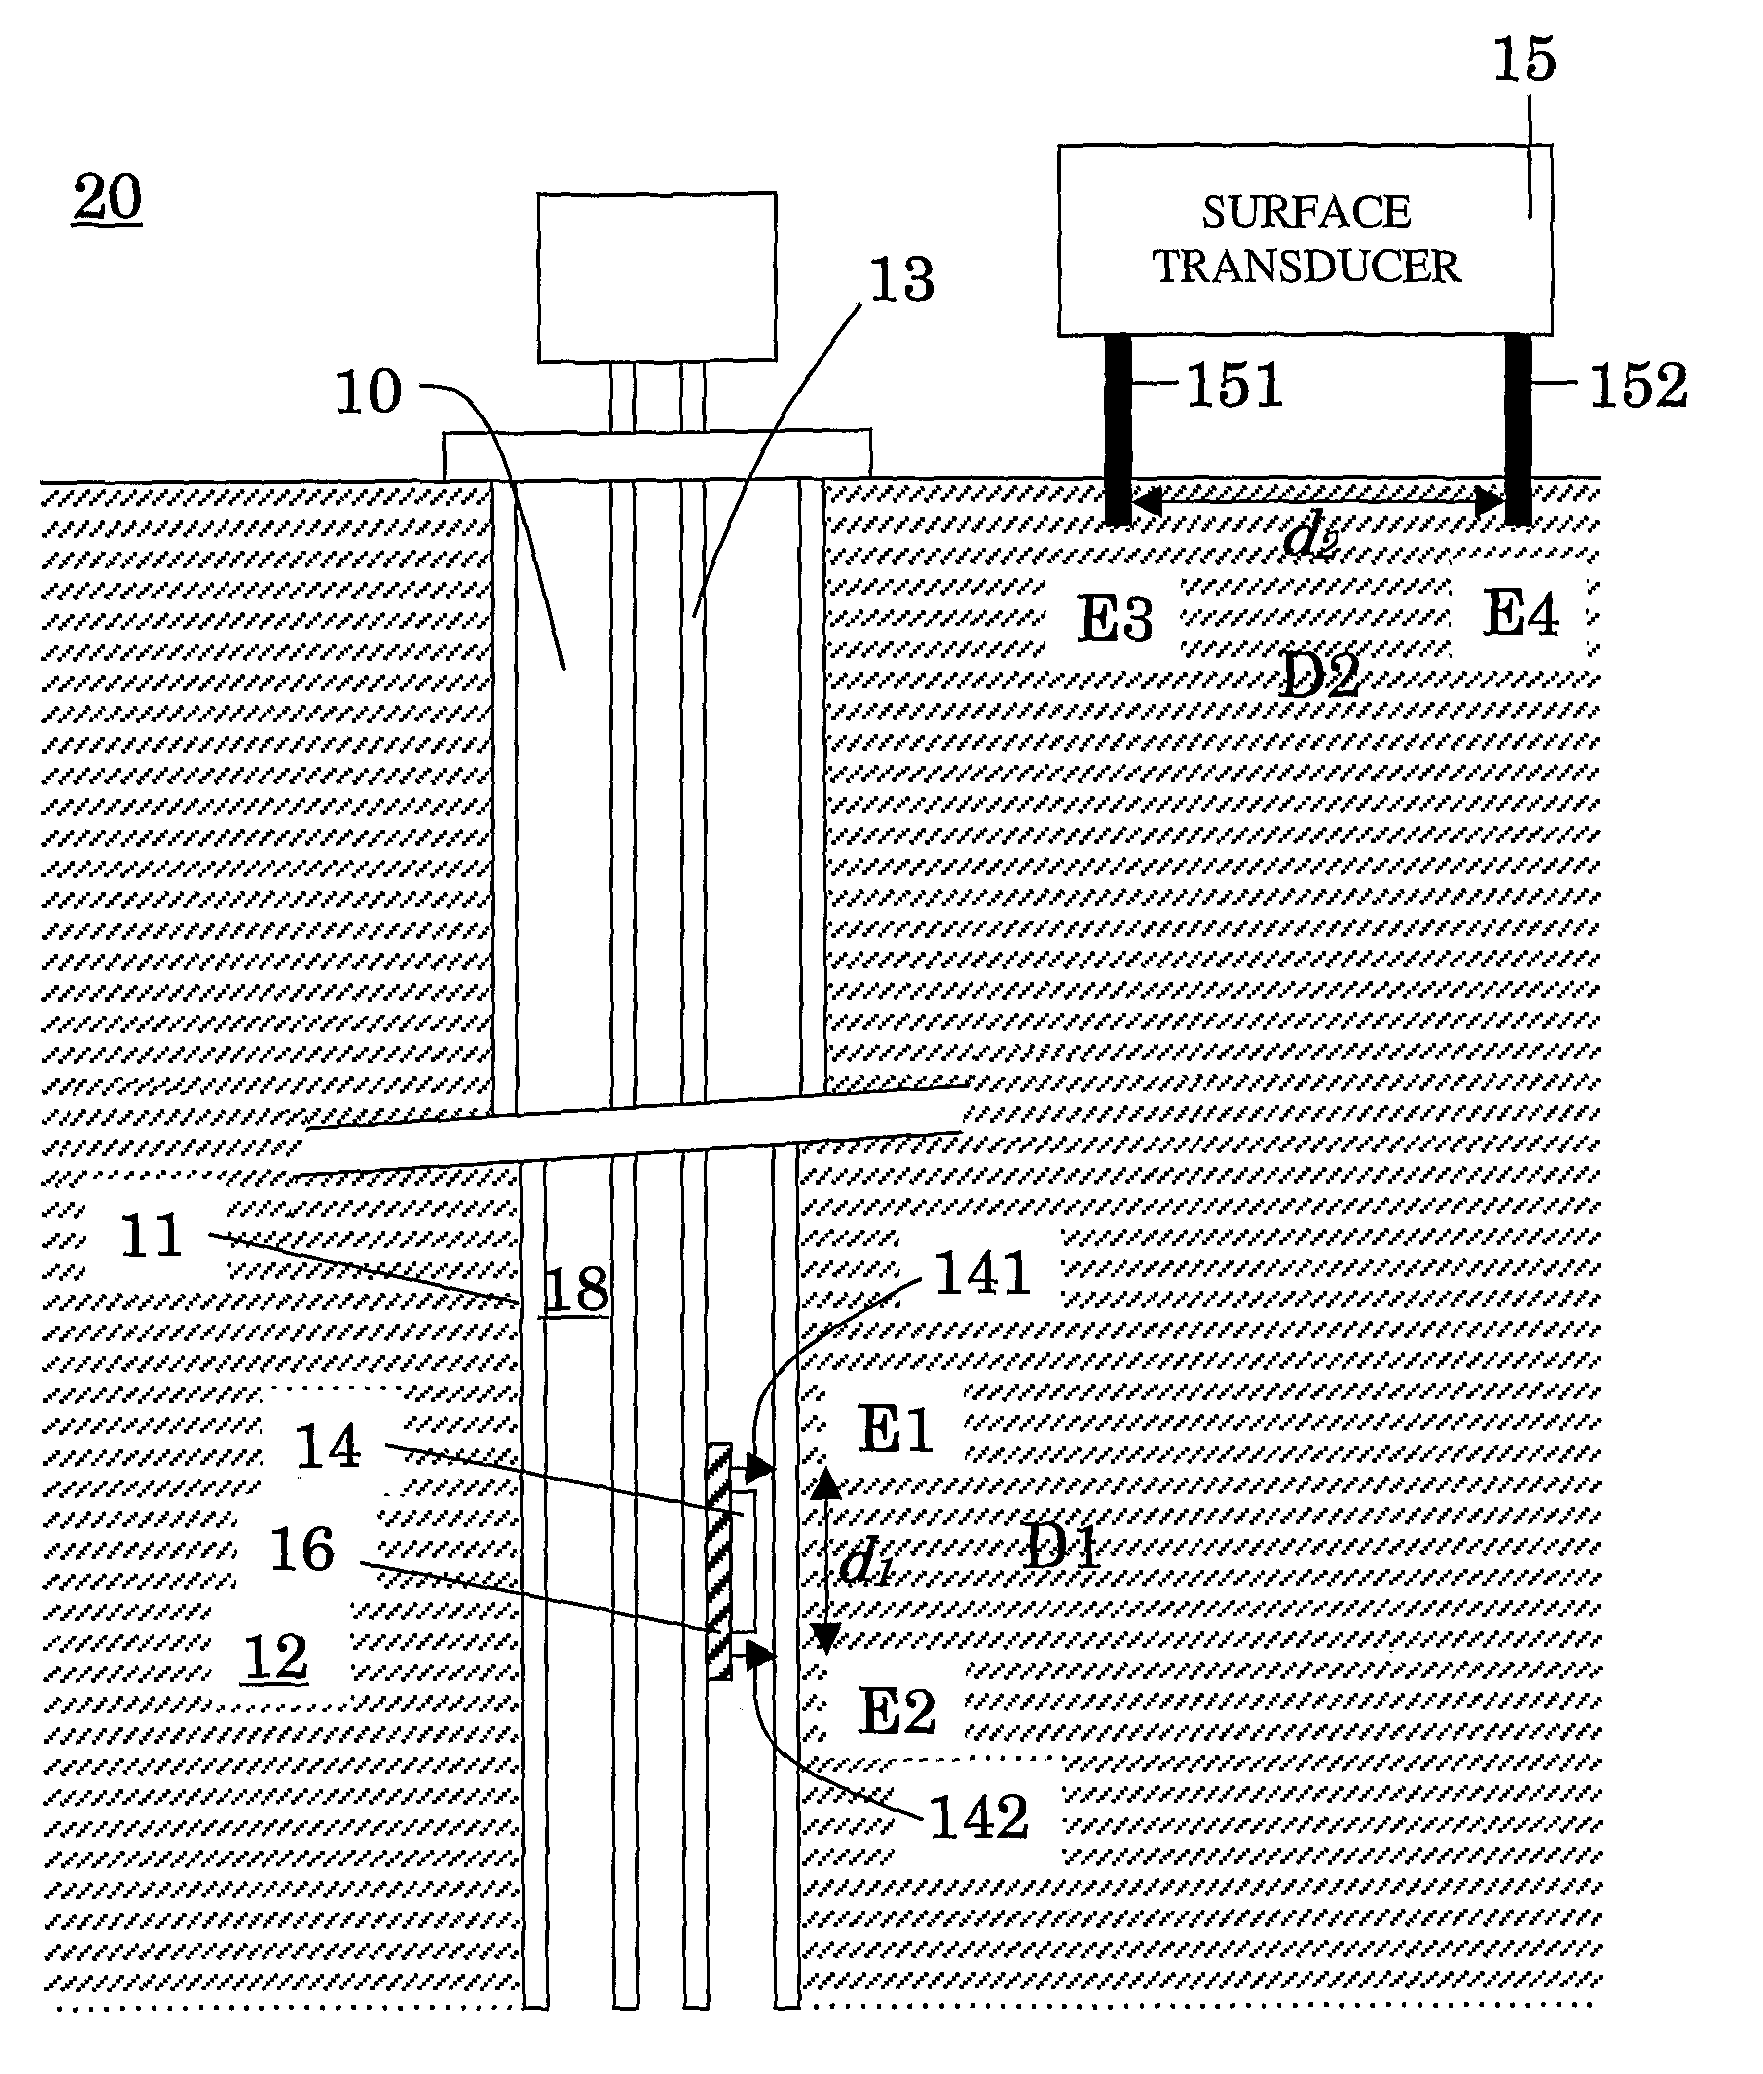
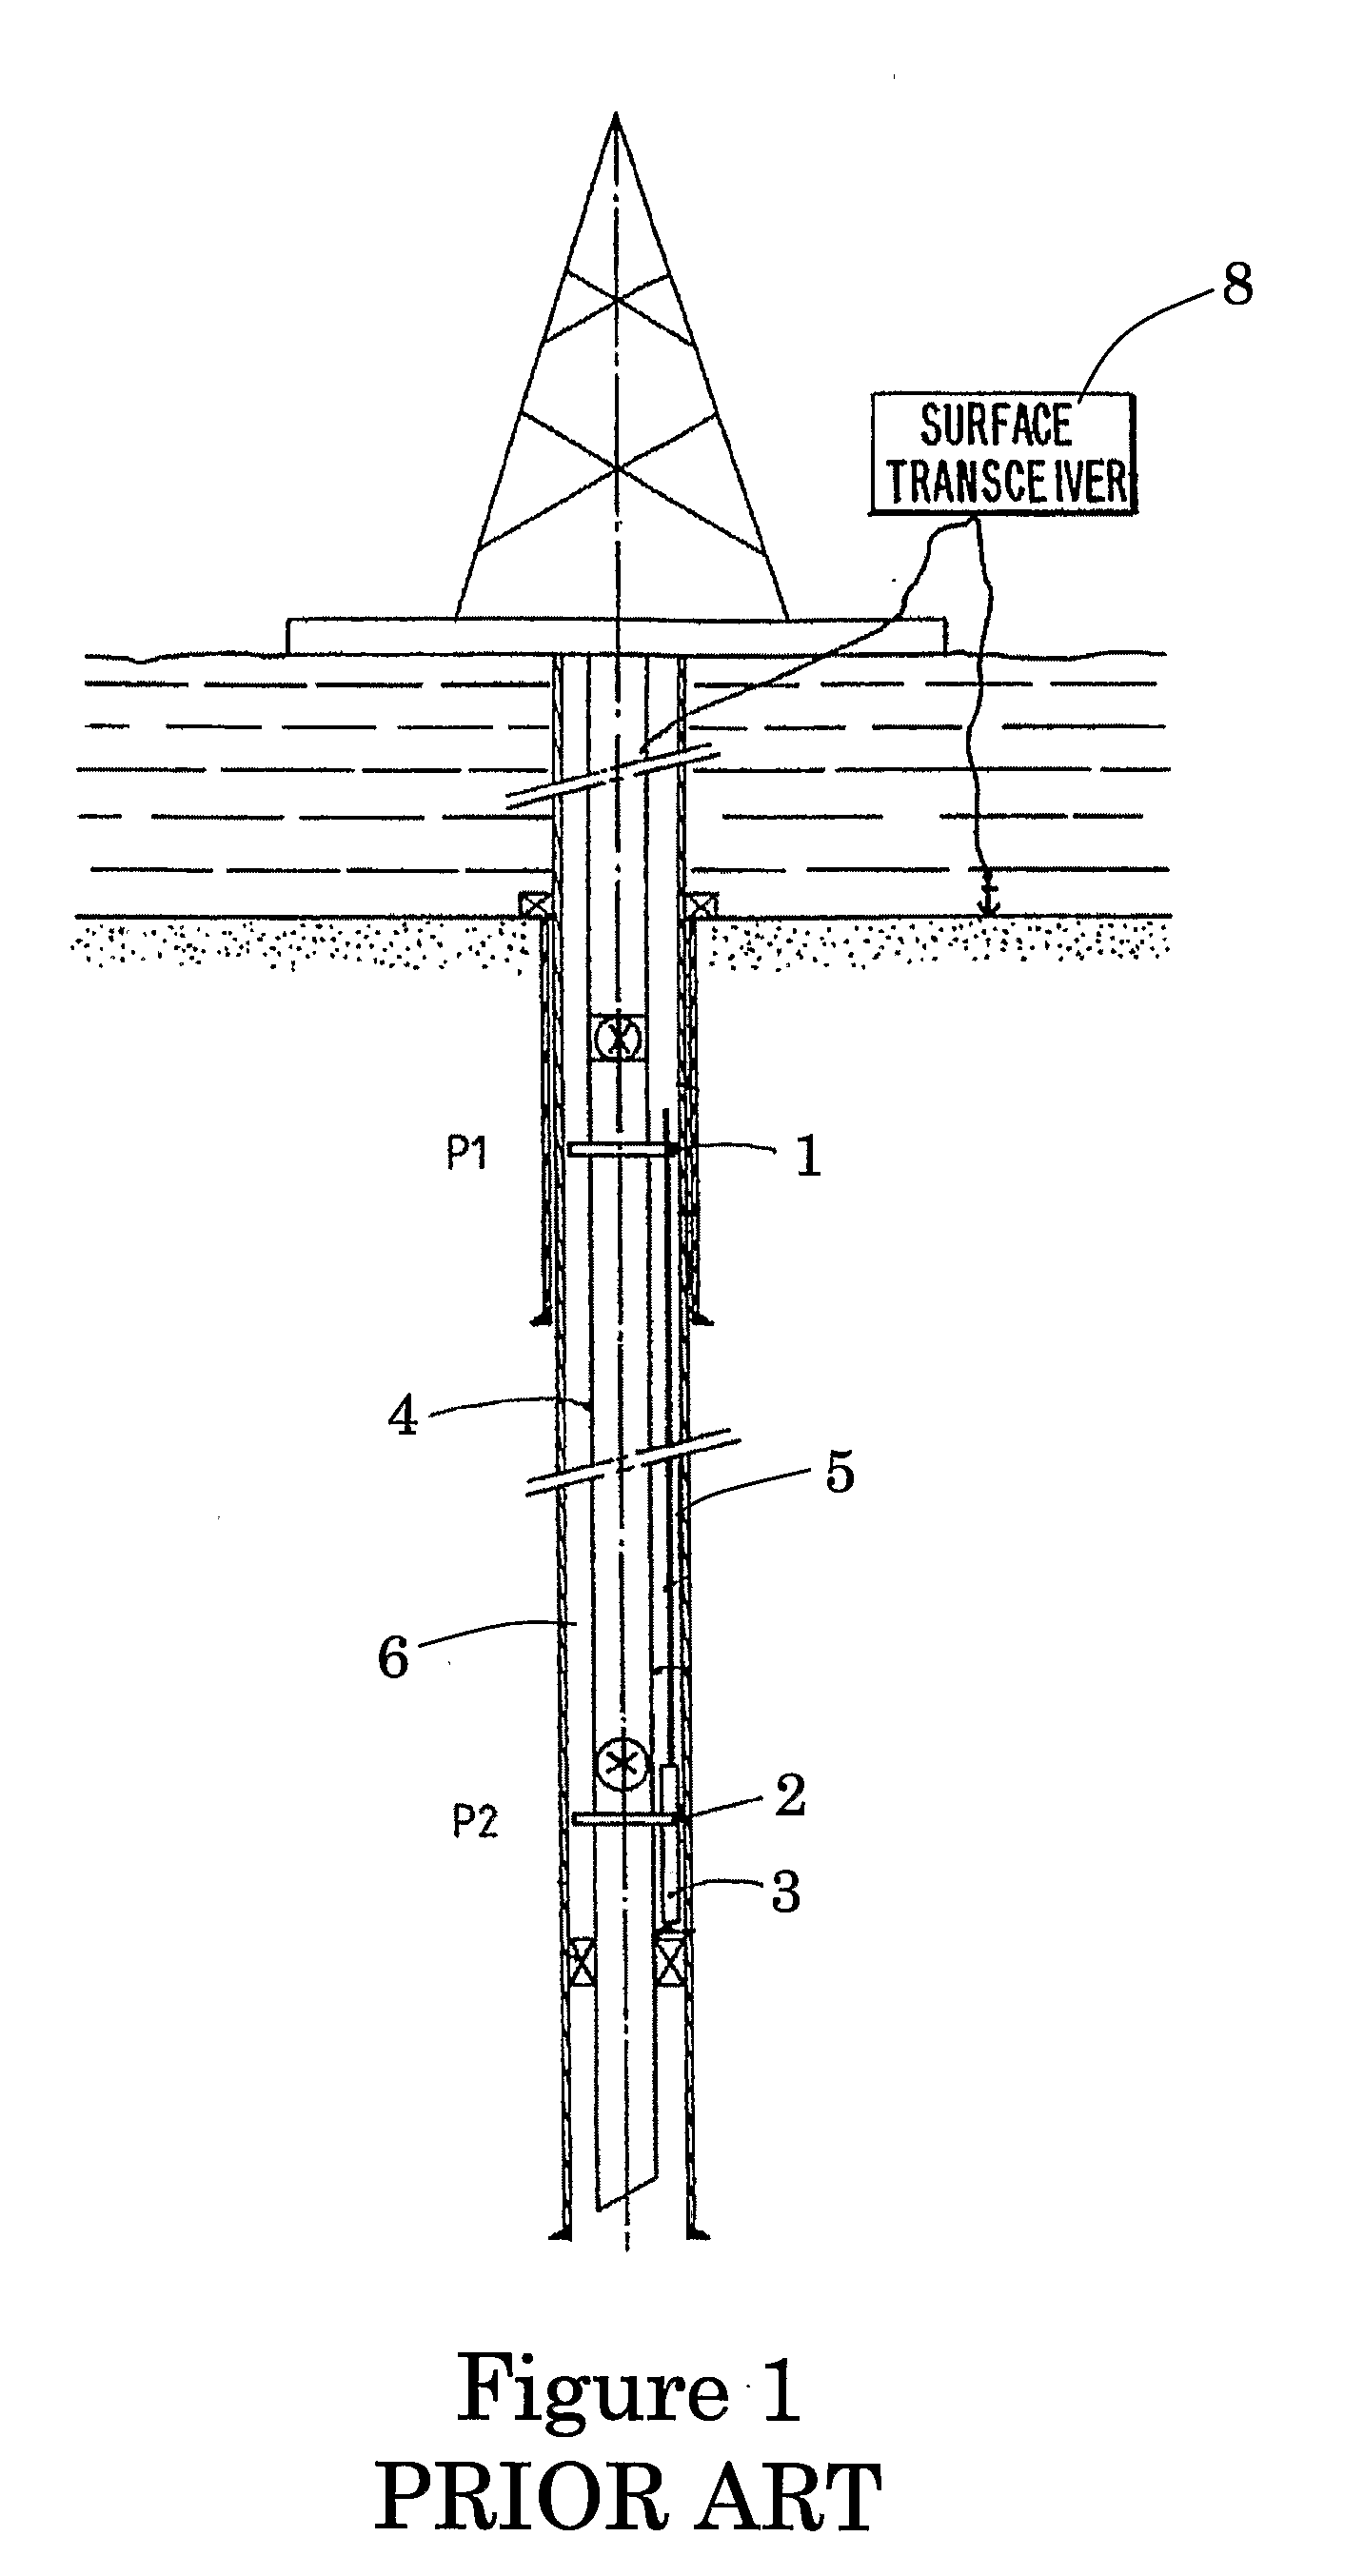
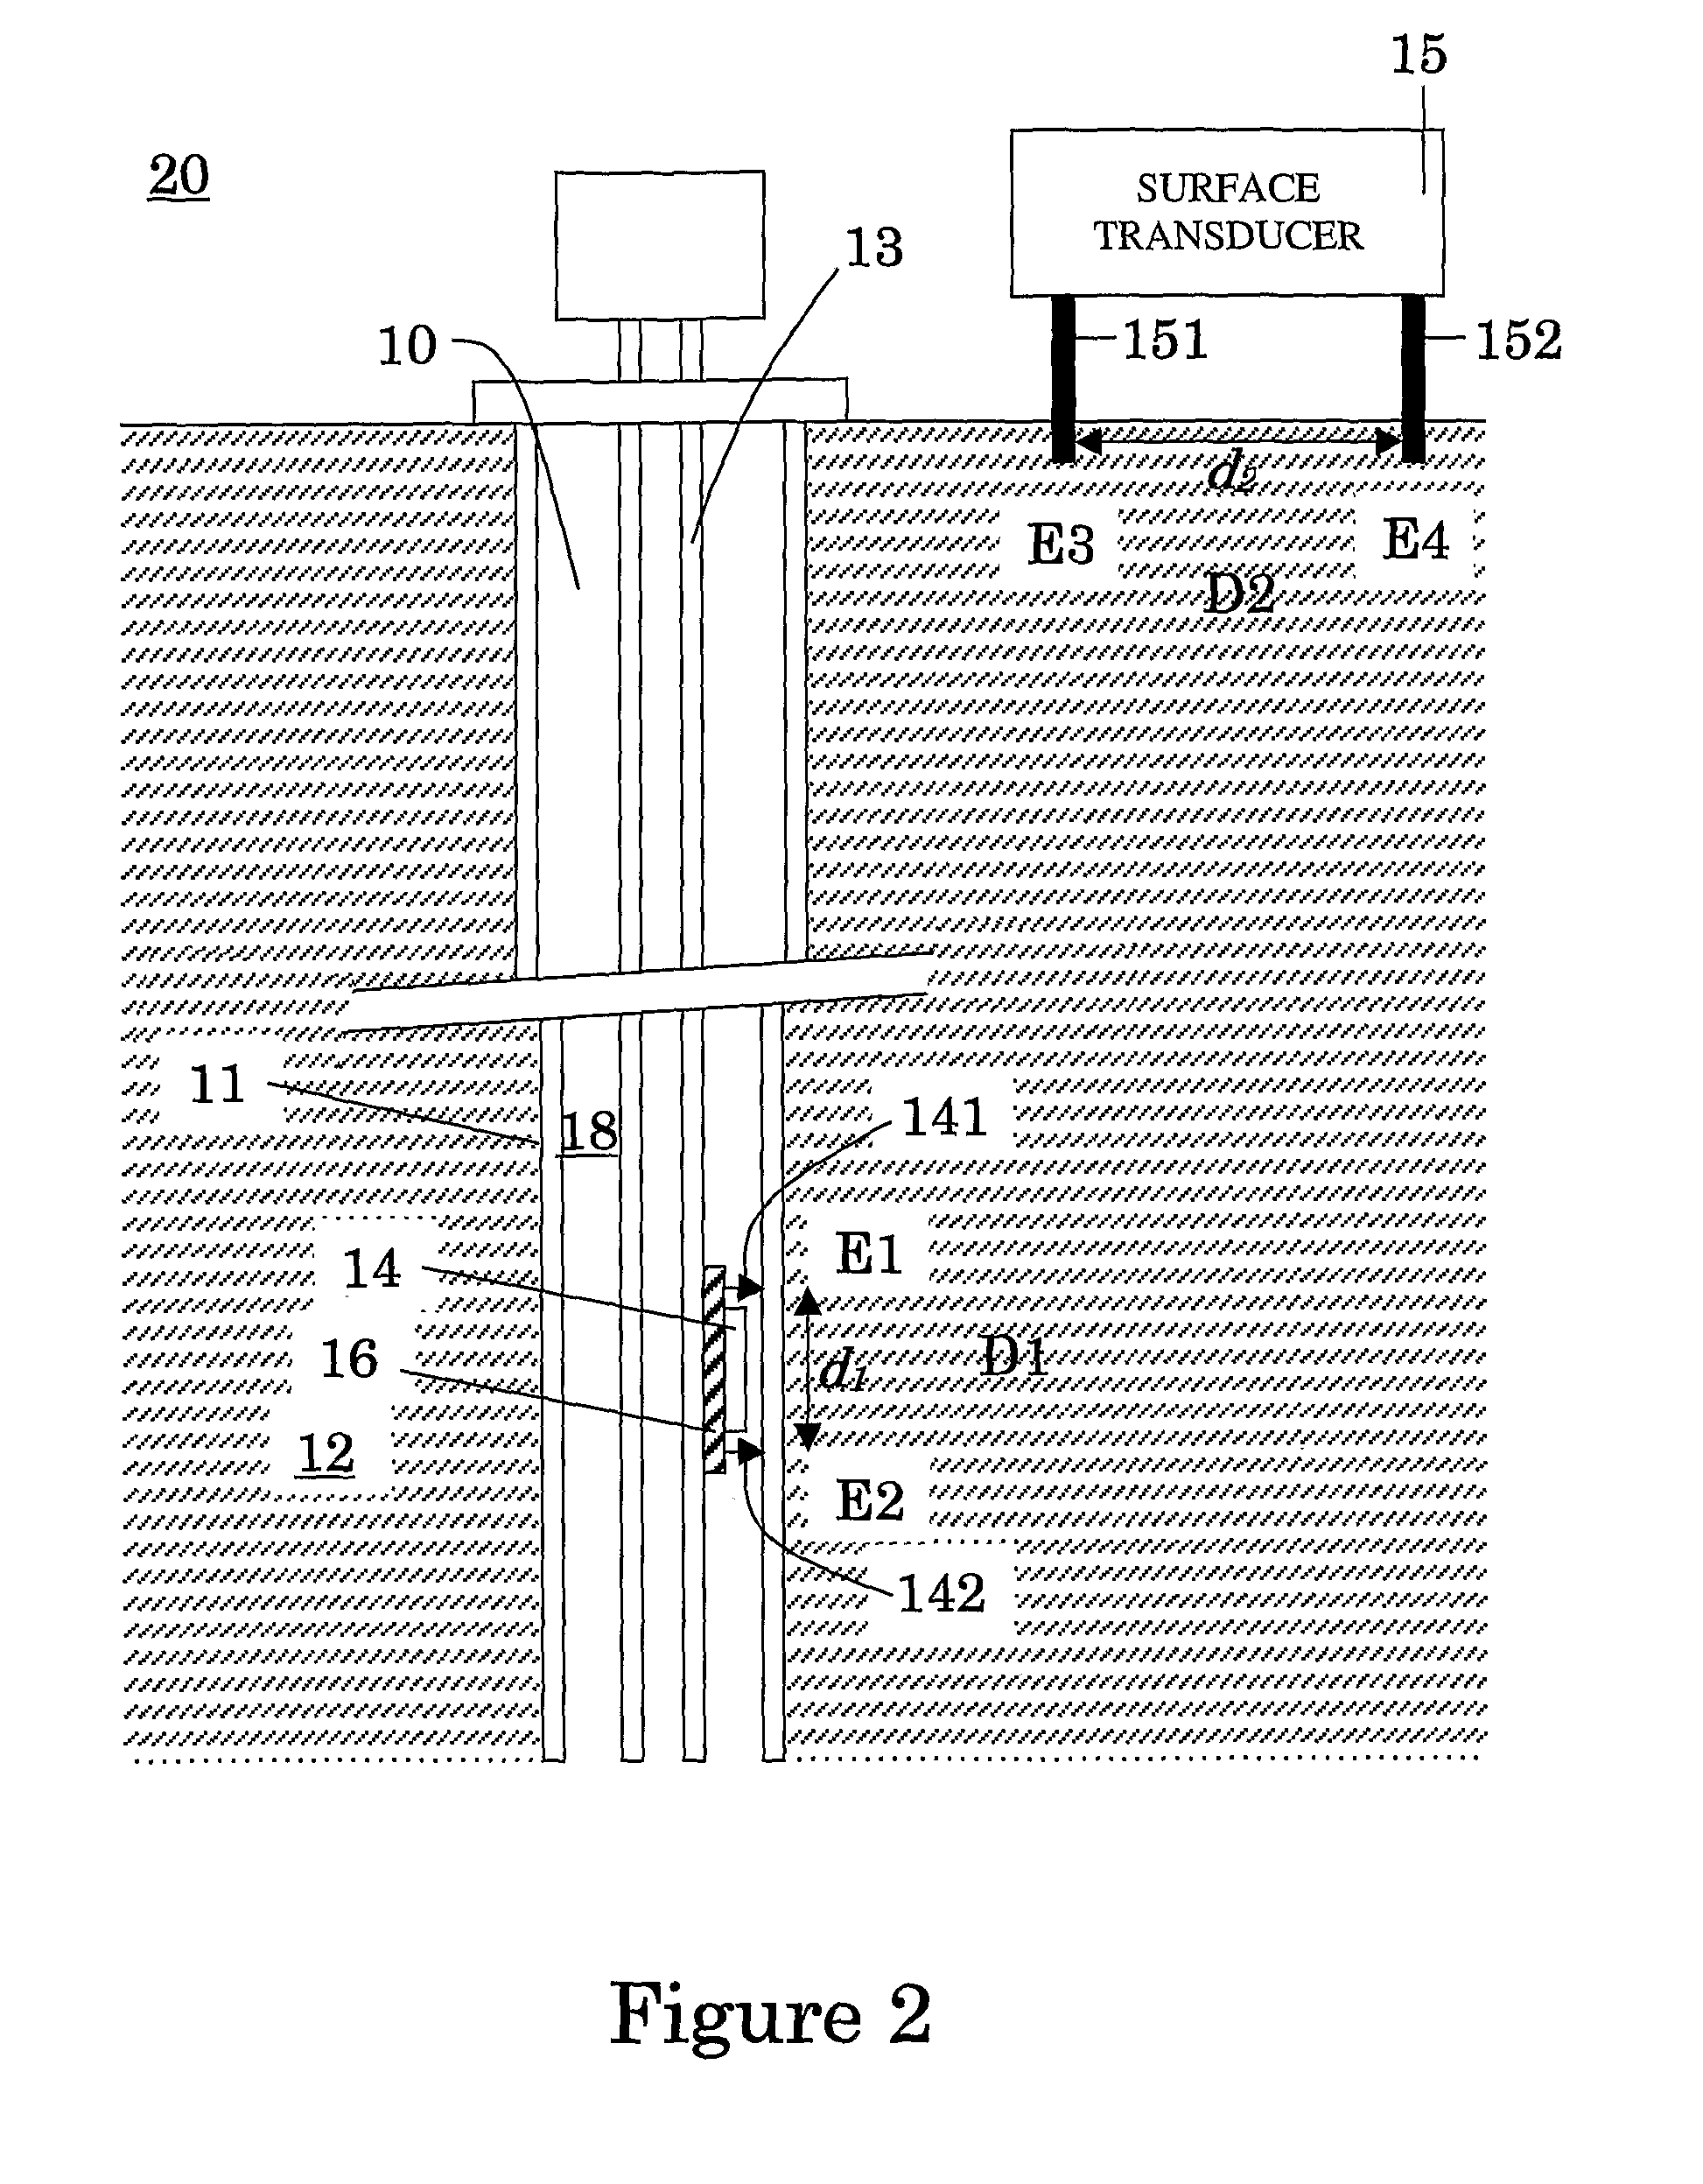
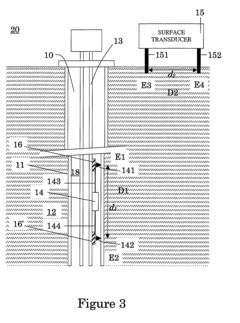
Method and apparatus for transmitting or receiving information between a down-hole eqipment and surface
PatentInactiveUS20110168446A1
Innovation
- The method involves using transducers with electrodes in electrical contact with the well casing to transmit and receive electric signals, maintaining low resistance to ensure reliable communication, and optionally employing relay transducers and insulation to enhance signal quality and range, while also determining conductivity profiles using Schumann resonances.
Environmental Factors Affecting Schumann Resonance Measurements
Schumann resonance measurements are highly sensitive to various environmental factors, which can significantly impact the accuracy and reliability of research data. One of the primary environmental influences is atmospheric conditions, particularly changes in temperature, humidity, and pressure. These factors can alter the propagation characteristics of electromagnetic waves in the Earth-ionosphere cavity, leading to fluctuations in the observed resonance frequencies and amplitudes.
Solar activity plays a crucial role in affecting Schumann resonance measurements. During periods of high solar activity, such as solar flares or coronal mass ejections, the ionosphere becomes more ionized, altering its conductivity and height. This, in turn, can modify the resonance patterns and introduce additional noise into the measurements. Seasonal variations also contribute to changes in Schumann resonance signals, with differences observed between summer and winter months due to variations in global thunderstorm activity and ionospheric conditions.
Geographical location is another critical factor influencing Schumann resonance measurements. Proximity to major thunderstorm centers, such as those in the tropics, can lead to stronger signal amplitudes and more pronounced resonance peaks. Conversely, measurements taken in polar regions may exhibit weaker signals due to reduced lightning activity. Local topography and geological features can also affect signal propagation and reception, potentially introducing distortions or anomalies in the recorded data.
Human-made electromagnetic interference poses a significant challenge to accurate Schumann resonance measurements. Industrial activities, power lines, and electronic devices can generate electromagnetic noise that overlaps with the frequency range of Schumann resonances, making it difficult to isolate the natural signals. Urban environments are particularly problematic, necessitating careful site selection for measurement stations to minimize anthropogenic interference.
The Earth's magnetic field variations, including geomagnetic storms and pulsations, can also impact Schumann resonance measurements. These phenomena can induce additional electromagnetic signals that may interfere with or modulate the resonance patterns. Researchers must account for these geomagnetic effects when analyzing and interpreting Schumann resonance data to ensure accurate results and meaningful conclusions.
To mitigate the impact of these environmental factors, researchers employ various techniques such as long-term averaging, advanced signal processing algorithms, and the use of multiple measurement stations. By understanding and accounting for these environmental influences, scientists can improve the quality and reliability of Schumann resonance measurements, enhancing their value for various research applications in atmospheric science, geophysics, and climate studies.
Data Visualization Techniques for Schumann Resonance Mapping
Data visualization techniques play a crucial role in mapping Schumann Resonance signals for research purposes. These techniques enable researchers to effectively analyze and interpret complex electromagnetic data, revealing patterns and insights that might otherwise remain hidden.
One of the primary visualization methods for Schumann Resonance mapping is spectrograms. These time-frequency representations provide a comprehensive view of signal intensity across different frequencies over time. By using color-coded heat maps, spectrograms allow researchers to identify resonance peaks, track temporal variations, and detect anomalies in the electromagnetic field.
Another valuable technique is 3D surface plots, which can represent the spatial distribution of Schumann Resonance signals across the globe. These plots typically use latitude and longitude as the x and y axes, with signal intensity represented by the z-axis or color gradients. This approach helps researchers visualize global patterns and identify regions of heightened electromagnetic activity.
Time series plots are essential for tracking the evolution of specific resonance frequencies over extended periods. These plots can reveal diurnal, seasonal, or long-term trends in Schumann Resonance signals, providing insights into the Earth's electromagnetic environment and potential correlations with other geophysical phenomena.
Polar plots offer a unique perspective on Schumann Resonance data, particularly for analyzing the directional characteristics of signals. By representing azimuth and elevation angles, polar plots can help researchers identify the source directions of electromagnetic disturbances and study propagation patterns.
Advanced visualization techniques, such as wavelet transforms, provide multi-resolution analysis of Schumann Resonance signals. These methods allow researchers to examine signal components at various time scales simultaneously, revealing both broad trends and fine-scale features in the data.
Interactive visualization tools have become increasingly important in Schumann Resonance research. These platforms enable researchers to dynamically explore data, adjust parameters in real-time, and overlay multiple data sets for comparative analysis. Such interactivity enhances the ability to discover subtle relationships and anomalies within the electromagnetic data.
Machine learning algorithms are also being integrated into visualization techniques, offering new ways to process and represent Schumann Resonance data. These methods can help identify complex patterns, classify signal types, and even predict future resonance behavior based on historical data.
By leveraging these diverse visualization techniques, researchers can gain deeper insights into Schumann Resonance phenomena, facilitating advancements in fields such as atmospheric science, geophysics, and space weather research.
Unlock deeper insights with Patsnap Eureka Quick Research — get a full tech report to explore trends and direct your research. Try now!
Generate Your Research Report Instantly with AI Agent
Supercharge your innovation with Patsnap Eureka AI Agent Platform!