How Matrix Effects Are Mapped Across RT Windows Using Infusion Or MRM Scans?
SEP 22, 20259 MIN READ
Generate Your Research Report Instantly with AI Agent
Patsnap Eureka helps you evaluate technical feasibility & market potential.
Matrix Effects in LC-MS/MS Analysis: Background and Objectives
Matrix effects represent one of the most significant challenges in liquid chromatography-tandem mass spectrometry (LC-MS/MS) analysis, affecting both qualitative and quantitative results. These effects occur when co-eluting matrix components alter the ionization efficiency of target analytes, leading to ion suppression or enhancement. The phenomenon was first documented in the late 1990s and has since been recognized as a critical factor influencing analytical reliability in various fields including pharmaceutical analysis, environmental monitoring, food safety, and clinical diagnostics.
The evolution of LC-MS/MS technology has been marked by continuous efforts to understand and mitigate matrix effects. Early approaches focused primarily on sample preparation techniques to remove interfering compounds. As instrumentation advanced, more sophisticated methods emerged, including the development of stable isotope-labeled internal standards and alternative ionization techniques such as atmospheric pressure chemical ionization (APCI).
Recent technological developments have shifted toward mapping matrix effects across retention time (RT) windows using either continuous post-column infusion or multiple reaction monitoring (MRM) scans. These approaches provide a comprehensive visualization of how matrix components influence analyte detection throughout the chromatographic run, enabling more targeted mitigation strategies.
The primary objective of mapping matrix effects across RT windows is to identify specific regions of ion suppression or enhancement, correlating these effects with co-eluting matrix components. This knowledge allows analysts to optimize chromatographic separation, modify sample preparation procedures, or adjust MS parameters to minimize interference at critical retention times.
Current research aims to establish standardized protocols for matrix effect evaluation using infusion and MRM approaches, as methodological variations significantly impact the assessment outcomes. Additionally, there is growing interest in developing predictive models that can anticipate matrix effects based on compound properties and chromatographic conditions, potentially eliminating the need for extensive experimental evaluation.
The ultimate goal is to develop robust analytical methods that maintain consistent performance across diverse sample matrices. This requires not only understanding the mechanisms behind matrix effects but also implementing effective strategies to compensate for their impact. As LC-MS/MS applications continue to expand into increasingly complex biological and environmental samples, addressing matrix effects becomes paramount for ensuring accurate, reliable, and reproducible analytical results.
Market Demand for Improved Matrix Effect Compensation
The analytical chemistry market has witnessed a significant surge in demand for improved matrix effect compensation technologies, particularly in liquid chromatography-mass spectrometry (LC-MS) applications. This demand is primarily driven by the increasing complexity of sample matrices in pharmaceutical, environmental, and clinical analyses, where accurate quantification is critical for regulatory compliance and decision-making processes.
Recent market research indicates that laboratories across various sectors are facing challenges with matrix effects that compromise data quality and analytical reliability. The pharmaceutical industry, representing approximately 40% of the LC-MS market, has expressed particular concern about matrix interferences affecting bioanalytical method validation and drug development timelines.
Contract Research Organizations (CROs) have reported that matrix effect compensation technologies could reduce method development time by up to 30%, translating to substantial cost savings in drug development pipelines. Similarly, clinical laboratories have highlighted the need for more robust matrix effect mapping tools to enhance the accuracy of diagnostic tests and therapeutic drug monitoring.
Environmental testing laboratories face unique challenges with highly variable sample matrices, creating a distinct market segment seeking specialized solutions for matrix effect compensation. The food safety sector has also emerged as a growth area, with regulatory requirements becoming increasingly stringent regarding trace analysis in complex food matrices.
Vendors of analytical instrumentation have recognized this market opportunity, with major players incorporating matrix effect compensation features in their latest LC-MS systems. The software segment of this market has shown particularly strong growth, with specialized algorithms for matrix effect prediction and compensation becoming valuable differentiators in the competitive landscape.
Geographically, North America and Europe lead in adoption of advanced matrix effect compensation technologies, while Asia-Pacific represents the fastest-growing market due to expanding pharmaceutical manufacturing and contract research activities in the region.
Market analysts project that improved matrix effect compensation technologies could potentially unlock new application areas in metabolomics, proteomics, and multi-residue analysis, where complex matrices have traditionally limited analytical capabilities. The ability to accurately map matrix effects across retention time windows using infusion or MRM scans represents a technological advancement with significant commercial potential, addressing a well-established pain point in analytical workflows across multiple industries.
Current Challenges in Matrix Effect Mapping
Matrix effect mapping across retention time (RT) windows faces significant challenges that impede accurate quantitative analysis in liquid chromatography-mass spectrometry (LC-MS). One primary obstacle is the dynamic nature of matrix effects, which vary considerably across different RT windows due to co-eluting compounds. This temporal variability makes it difficult to establish consistent correction factors throughout the chromatographic run.
The complexity of biological matrices presents another substantial challenge. Plasma, urine, and tissue homogenates contain thousands of endogenous compounds that can cause ion suppression or enhancement at different RT windows. These effects are often unpredictable and sample-dependent, requiring extensive characterization for each matrix type.
Technical limitations of current mapping approaches further complicate the situation. Post-column infusion techniques, while effective for visualizing matrix effects across the entire chromatogram, suffer from poor reproducibility and are labor-intensive. Multiple Reaction Monitoring (MRM) scans, though more targeted, may miss matrix effects occurring outside the monitored transitions, leading to incomplete mapping.
Standardization remains problematic across laboratories and instrument platforms. Different MS systems exhibit varying susceptibilities to matrix effects, and differences in chromatographic conditions can shift the RT windows where matrix effects occur. This lack of standardization makes it difficult to compare results between laboratories or transfer methods between instruments.
Data processing and interpretation present additional challenges. Current software solutions are inadequate for automated identification and quantification of matrix effects across RT windows. Analysts must often manually evaluate complex data sets, introducing subjectivity and increasing the risk of overlooking significant matrix effects.
The integration of matrix effect data into quantitative workflows remains underdeveloped. While qualitative mapping can identify problematic RT regions, translating this information into accurate correction factors for quantitative analysis is not straightforward. This gap between identification and correction limits the practical utility of matrix effect mapping.
Resource constraints also impact comprehensive matrix effect evaluation. The time and material costs associated with thorough matrix effect mapping across multiple RT windows are substantial, leading many laboratories to implement abbreviated approaches that may miss critical matrix interferences.
Established Techniques for Matrix Effect Mapping Across RT Windows
01 Chromatographic retention time window mapping
Matrix effects in chromatography can be addressed by mapping retention time (RT) windows to account for variations in analyte behavior. This approach involves establishing time windows during which specific compounds are expected to elute, allowing for more accurate identification despite matrix interferences. Advanced algorithms can dynamically adjust these windows based on internal standards or reference compounds, compensating for matrix-induced shifts in retention times.- Chromatographic retention time window mapping: Methods for mapping retention time (RT) windows in chromatographic analysis to account for matrix effects. These techniques involve establishing time windows during which specific analytes are expected to elute, allowing for more accurate identification despite matrix interferences. The approaches include adaptive algorithms that adjust RT windows based on calibration standards and sample matrices, improving the reliability of compound identification in complex samples.
- Matrix effect compensation in analytical methods: Technologies for compensating matrix effects in analytical chemistry, particularly in mass spectrometry and chromatography. These innovations include mathematical models and algorithms that correct for ion suppression or enhancement caused by sample matrix components. The systems can dynamically adjust detection parameters based on internal standards and calibration curves to maintain accurate quantification despite varying matrix compositions.
- Visual representation of retention time windows: Graphical user interface systems for visualizing retention time windows and matrix effects in analytical data. These interfaces provide color-coded maps, overlays, and interactive displays that allow analysts to observe how matrix components affect retention time shifts across samples. The visualization tools help in method development by identifying problematic matrix interferences and optimizing separation conditions.
- Automated adjustment of RT windows based on matrix effects: Automated systems that dynamically adjust retention time windows based on detected matrix effects. These systems employ machine learning algorithms and statistical models to predict RT shifts caused by different sample matrices. The technology can automatically recalibrate expected elution times for target compounds based on observed matrix components, improving identification accuracy in routine analysis.
- Matrix-matched calibration for RT window determination: Methods for creating matrix-matched calibration standards to establish accurate retention time windows. These approaches involve preparing calibration samples in matrices similar to the test samples to account for matrix-induced RT shifts. The techniques include procedures for characterizing matrix effects on RT, creating matrix-specific RT databases, and implementing correction factors for different sample types.
02 Visual representation of matrix effects in analytical data
Visualization techniques are employed to map matrix effects across retention time windows, creating graphical interfaces that display how sample matrices influence analytical results. These visual mapping tools use color coding, heat maps, or 3D representations to highlight regions of chromatograms where matrix effects are most pronounced, enabling analysts to quickly identify problematic areas and optimize method parameters accordingly.Expand Specific Solutions03 Algorithmic compensation for matrix-induced RT shifts
Computational algorithms are developed to automatically compensate for matrix-induced retention time shifts in analytical methods. These algorithms analyze patterns in chromatographic data to create adaptive RT windows that adjust based on observed matrix effects. Machine learning approaches can be trained to recognize and predict how different sample matrices will affect retention times, allowing for more robust analytical methods across varying sample types.Expand Specific Solutions04 Multi-dimensional mapping of matrix effects
Multi-dimensional approaches map matrix effects across both retention time windows and other analytical parameters such as mass spectral response or detection sensitivity. This comprehensive mapping creates a multi-dimensional space where matrix effects can be characterized across different analytical dimensions simultaneously. By understanding how matrix effects manifest across multiple parameters, more effective compensation strategies can be implemented to improve analytical accuracy.Expand Specific Solutions05 Reference standard-based RT window calibration
Reference standards are utilized to calibrate retention time windows in the presence of matrix effects. By incorporating known compounds that exhibit predictable behavior, analytical methods can establish reliable RT windows despite matrix interferences. These reference compounds serve as anchors for RT mapping, allowing the system to adjust windows based on how the references are affected by the sample matrix, thereby improving identification accuracy for target analytes.Expand Specific Solutions
Leading Vendors and Research Groups in LC-MS/MS Technology
The matrix effects mapping across RT windows using infusion or MRM scans represents a developing field within analytical chemistry, currently transitioning from early to growth stage. The market size is expanding steadily, driven by increasing demand for precise analytical methodologies in pharmaceutical, clinical, and environmental applications. Technologically, the field shows moderate maturity with significant advancements being made by key players. Siemens Healthineers and Roche Diagnostics lead with comprehensive analytical platforms, while ASML and Canon contribute advanced imaging technologies. Microsoft and Adobe provide supporting data processing solutions. Emerging companies like Specto Medical and Crescendo Biologics are introducing innovative approaches to matrix effect visualization and quantification, indicating a competitive landscape with both established corporations and specialized innovators.
Siemens Healthineers AG
Technical Solution: Siemens Healthineers has developed a sophisticated approach to matrix effect mapping in clinical mass spectrometry applications. Their technology integrates both infusion and MRM scanning techniques to comprehensively characterize matrix effects across retention time windows. The Siemens approach employs continuous post-column infusion methodology where a constant concentration of analyte is introduced after chromatographic separation but before MS detection, allowing real-time monitoring of ion suppression or enhancement throughout the chromatographic run. This is complemented by targeted MRM scanning of specific retention time windows where matrix effects are most pronounced. Their proprietary software generates detailed matrix effect maps showing the intensity of suppression/enhancement across different RT windows, enabling scientists to optimize method parameters accordingly. The system includes automated data processing tools that integrate matrix effect information with MRM transition data to provide a holistic view of analytical performance, particularly important in clinical diagnostics where sample matrices are complex and variable.
Strengths: Excellent integration with clinical laboratory workflows; comprehensive validation documentation for regulatory compliance; robust performance in high-throughput clinical environments. Weaknesses: Less flexibility for research applications outside clinical parameters; higher cost structure; requires specialized training for optimal utilization.
BIONEER Corp.
Technical Solution: BIONEER has developed a specialized approach to matrix effect mapping in bioanalytical applications using both infusion and MRM scanning techniques. Their technology employs a dual-mapping strategy where post-column infusion experiments are first conducted to identify regions of ion suppression or enhancement across chromatographic runs. This is followed by targeted MRM scanning of specific retention time windows where matrix effects are most pronounced. BIONEER's system includes proprietary algorithms that quantify the degree of matrix interference at different time points and automatically suggest optimal MRM transitions that minimize these effects. Their platform incorporates machine learning components that analyze patterns in matrix effect data across different sample types, building predictive models that can anticipate matrix challenges in new samples. The system also features automated quality control procedures that continuously monitor matrix effects during routine analysis, alerting users when unexpected interferences occur.
Strengths: Highly specialized for bioanalytical applications with particular focus on nucleic acid and protein analysis; excellent integration with sample preparation workflows; advanced predictive capabilities for matrix effect anticipation. Weaknesses: More limited application outside bioanalytical field; requires specialized training; higher initial implementation costs compared to generic approaches.
Key Innovations in Post-Column Infusion and MRM Scanning
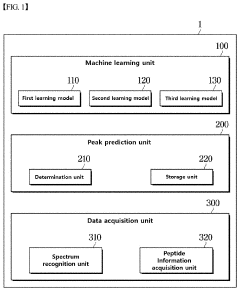
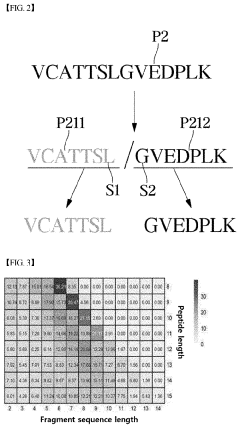
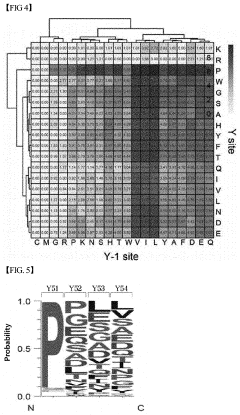
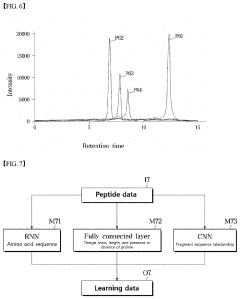
System based on learning peptide properties for predicting spectral profile of peptide-producing ions in liquid chromatograph-mass spectrometry
PatentPendingUS20230113788A1
Innovation
- A system employing machine learning models, including RNNs and CNNs, to predict spectral profiles of peptides by analyzing amino acid sequences, charges, mass, and fragmentation information, generating learning data for accurate peak prediction and noise reduction.
Detecting mass spectrometry based similarity via curve subtraction
PatentWO2016125060A1
Innovation
- A system that performs MS/MS scans using sequential mass window widths to span an entire mass range, calculates extracted ion chromatograms (XICs) for product ions, and applies curve subtraction methods to normalize and compare intensities across retention times, identifying regions where subtraction curves approach zero to group peaks accurately.


Regulatory Considerations for Bioanalytical Method Validation
Regulatory frameworks governing bioanalytical method validation play a crucial role in ensuring the reliability and accuracy of matrix effect mapping across retention time (RT) windows using infusion or MRM scans. These considerations are essential for laboratories conducting bioanalytical studies, particularly in pharmaceutical development and clinical trials.
The FDA Bioanalytical Method Validation Guidance (2018) specifically addresses matrix effects as a critical component of method validation. When mapping matrix effects across RT windows, laboratories must demonstrate compliance with regulatory expectations for selectivity and specificity. The guidance requires thorough documentation of matrix effect evaluation procedures, including post-column infusion experiments and quantitative assessments across different RT windows.
European Medicines Agency (EMA) guidelines provide additional specifications for matrix effect investigations, mandating that bioanalytical methods include comprehensive evaluation of ion suppression/enhancement across chromatographic profiles. For methods utilizing infusion or MRM scans to map matrix effects, the EMA requires demonstration that these approaches can reliably detect variations in matrix effects at different retention times.
ICH M10 guidelines, implemented globally in 2022, harmonize requirements for matrix effect assessment across different regulatory jurisdictions. These guidelines specifically address the need for matrix effect mapping across RT windows, requiring that bioanalytical methods demonstrate consistent performance regardless of matrix-induced variations at different retention times.
Regulatory bodies increasingly expect risk-based approaches to matrix effect evaluation. When using infusion or MRM scans for mapping matrix effects, validation protocols must include justification for the selected approach and demonstrate its ability to detect potential interferences throughout the chromatographic run.
Compliance with these regulatory considerations requires detailed documentation of matrix effect mapping procedures. Method validation reports must include comprehensive data on matrix effect profiles across RT windows, statistical evaluation of the results, and justification for acceptance criteria. Regulatory authorities typically expect visualization of matrix effect profiles across RT windows, with clear identification of regions where significant suppression or enhancement occurs.
For global submissions, laboratories must navigate potentially different regulatory expectations regarding matrix effect evaluation. While core principles remain consistent, specific documentation requirements and acceptance criteria may vary between regulatory agencies, necessitating a comprehensive approach to method validation that satisfies the most stringent requirements across all relevant jurisdictions.
Data Processing Algorithms for Matrix Effect Quantification
The quantification of matrix effects in LC-MS/MS analysis requires sophisticated data processing algorithms to accurately interpret the complex signals generated during infusion or MRM scans across retention time windows. These algorithms typically employ several key computational approaches to transform raw data into meaningful matrix effect profiles.
Signal normalization techniques form the foundation of matrix effect quantification algorithms. By establishing a baseline response in pure solvent conditions, these algorithms can calculate the percentage of signal suppression or enhancement at each time point. Advanced algorithms implement moving average filters to smooth the data while preserving significant matrix effect trends, reducing noise that could otherwise lead to misinterpretation.
Statistical methods play a crucial role in distinguishing true matrix effects from analytical variability. Modern algorithms incorporate outlier detection mechanisms that identify and flag anomalous signal fluctuations which may represent either severe matrix effects or instrumental artifacts. Some sophisticated approaches employ machine learning classifiers to recognize patterns characteristic of specific matrix interferences based on training datasets from known matrix components.
Retention time alignment algorithms address the challenge of comparing matrix effect profiles across different analytical runs. These algorithms compensate for chromatographic drift by employing dynamic time warping or landmark-based alignment techniques, ensuring that matrix effect measurements remain comparable despite minor variations in chromatographic conditions.
Visualization algorithms transform complex numerical data into interpretable heat maps or contour plots that display matrix effect intensity across retention time windows. Color-coding schemes typically represent signal suppression in red and enhancement in blue, with intensity gradients indicating the severity of the effect. Three-dimensional visualization techniques can simultaneously display matrix effects across multiple MRM transitions.
Integration with instrument control software enables real-time matrix effect monitoring during method development. Modern algorithms can automatically adjust acquisition parameters based on detected matrix effects, optimizing dwell times in regions of significant interference or triggering additional qualifier ions for improved specificity in problematic retention time windows.
Multivariate statistical approaches such as principal component analysis (PCA) and partial least squares discriminant analysis (PLS-DA) are increasingly incorporated into advanced matrix effect quantification algorithms. These techniques identify correlations between matrix effects observed across multiple analytes, potentially revealing common interference mechanisms and guiding more effective method optimization strategies.
Unlock deeper insights with Patsnap Eureka Quick Research — get a full tech report to explore trends and direct your research. Try now!
Generate Your Research Report Instantly with AI Agent
Supercharge your innovation with Patsnap Eureka AI Agent Platform!