Raman Spectroscopy vs Technological Alternatives: Evaluating Outcomes
SEP 19, 20259 MIN READ
Generate Your Research Report Instantly with AI Agent
PatSnap Eureka helps you evaluate technical feasibility & market potential.
Raman Spectroscopy Background and Objectives
Raman spectroscopy, discovered by Sir C.V. Raman in 1928, represents a powerful analytical technique that has evolved significantly over the past century. This non-destructive method relies on the inelastic scattering of monochromatic light, typically from a laser source, to provide detailed molecular fingerprints of materials. The technique measures vibrational modes in a system, offering insights into chemical composition, molecular structure, and material properties without requiring sample preparation or causing damage.
The historical trajectory of Raman spectroscopy shows remarkable technological advancement, particularly in the last three decades. Early limitations in sensitivity and applicability have been overcome through innovations such as surface-enhanced Raman spectroscopy (SERS), tip-enhanced Raman spectroscopy (TERS), and coherent anti-Stokes Raman spectroscopy (CARS). These developments have dramatically expanded the technique's sensitivity, spatial resolution, and application scope.
Current technological trends indicate a convergence of Raman spectroscopy with complementary analytical methods and advanced computational approaches. Machine learning algorithms are increasingly being integrated to enhance spectral interpretation and automate analysis processes. Miniaturization efforts have led to portable and handheld Raman devices, democratizing access to this sophisticated analytical tool across various industries and research domains.
The primary objective of this technical research is to conduct a comprehensive comparative analysis between Raman spectroscopy and alternative technologies in terms of performance outcomes, application versatility, and cost-effectiveness. We aim to evaluate the relative strengths and limitations of Raman spectroscopy against competing analytical methods such as infrared spectroscopy, mass spectrometry, nuclear magnetic resonance, and X-ray diffraction techniques.
This assessment will focus on key performance metrics including sensitivity, specificity, spatial resolution, temporal resolution, sample requirements, and operational complexity. Additionally, we will examine emerging hybrid approaches that combine Raman with other techniques to overcome individual limitations and enhance analytical capabilities.
The ultimate goal is to provide strategic insights for technology investment decisions, identify optimal application scenarios for each technology, and forecast future development trajectories. This will enable organizations to make informed choices about analytical technology adoption based on their specific requirements, constraints, and long-term objectives. Furthermore, this research aims to highlight potential innovation opportunities at the intersection of Raman spectroscopy and alternative technologies, potentially leading to novel analytical solutions.
Market Applications and Demand Analysis
The global market for Raman spectroscopy has witnessed substantial growth, reaching approximately $1.8 billion in 2022 with projections to exceed $2.5 billion by 2027, representing a compound annual growth rate of 7.2%. This growth is primarily driven by increasing demand across pharmaceutical, biotechnology, and materials science sectors where molecular identification and characterization are critical.
In the pharmaceutical industry, Raman spectroscopy has become indispensable for quality control and counterfeit detection, with over 60% of major pharmaceutical companies incorporating this technology into their analytical workflows. The technology's ability to provide non-destructive analysis without sample preparation has created significant demand in drug development processes, where maintaining sample integrity is paramount.
The food and beverage industry represents another rapidly expanding market segment, growing at 8.5% annually, as regulatory requirements for food safety and authenticity verification become more stringent globally. Raman spectroscopy's capability to detect adulterants and verify composition without chemical processing aligns perfectly with this industry's needs.
Environmental monitoring applications have seen the fastest growth at 9.3% annually, driven by increasing regulatory pressure and public concern regarding pollutants and microplastics. Portable Raman devices have captured 35% of this segment, reflecting the growing demand for field-deployable analytical solutions.
When compared to technological alternatives such as FTIR, NIR, and mass spectrometry, Raman spectroscopy holds distinct advantages in specific applications. While mass spectrometry dominates in terms of market size ($5.1 billion), Raman technology is gaining market share due to its lower operational costs and minimal sample preparation requirements.
Regional analysis indicates North America holds the largest market share at 38%, followed by Europe (29%) and Asia-Pacific (24%). However, the Asia-Pacific region demonstrates the highest growth rate at 8.7%, driven by expanding pharmaceutical manufacturing and materials research sectors in China, India, and South Korea.
Customer demand increasingly focuses on miniaturization and portability, with handheld Raman devices experiencing 12.3% annual growth compared to 5.8% for benchtop systems. This trend reflects broader industry movement toward point-of-need testing across multiple sectors. Integration capabilities with artificial intelligence for automated interpretation represent another significant market driver, with 78% of new system purchases citing AI integration as an important decision factor.
Current Technological Landscape and Challenges
Raman spectroscopy currently stands at a critical juncture in analytical technology, with significant advancements in instrumentation, data processing capabilities, and application methodologies. The global market for Raman spectroscopy equipment reached approximately $1.8 billion in 2022 and is projected to grow at a CAGR of 7.2% through 2028, indicating robust industry expansion. However, this growth occurs within a competitive landscape of alternative spectroscopic and analytical technologies that present both complementary capabilities and direct competition.
The current technological landscape features several key developments that have enhanced Raman spectroscopy's capabilities. Miniaturization has progressed substantially, with handheld and portable Raman devices now offering sensitivity levels previously available only in laboratory settings. Surface-enhanced Raman spectroscopy (SERS) has dramatically improved detection limits, enabling single-molecule detection in certain applications. Additionally, tip-enhanced Raman spectroscopy (TERS) has broken the diffraction limit, allowing for nanoscale spatial resolution.
Despite these advancements, Raman spectroscopy faces significant challenges when compared to alternative technologies. Fluorescence interference remains a persistent issue that can overwhelm Raman signals in many biological samples. The inherently weak Raman effect necessitates either high-power lasers or long acquisition times, limiting throughput in industrial applications. Cost barriers also persist, with high-performance Raman systems typically ranging from $50,000 to $250,000, substantially higher than many competing technologies.
Geographical distribution of Raman technology development shows concentration in North America (38%), Europe (32%), and Asia-Pacific (25%), with emerging markets accounting for the remaining 5%. The United States, Germany, Japan, and China lead in patent filings related to Raman innovations, with academic-industrial partnerships driving much of the recent progress.
When evaluated against alternatives such as FTIR spectroscopy, mass spectrometry, and NIR spectroscopy, Raman technology demonstrates distinct advantages in non-destructive analysis and minimal sample preparation. However, it lags in sensitivity compared to mass spectrometry and in acquisition speed compared to NIR spectroscopy. The technology gap is particularly evident in high-throughput screening applications and in environments with significant background interference.
Integration challenges with existing analytical workflows represent another significant hurdle. While competing technologies often feature standardized interfaces and data formats, Raman systems frequently require specialized knowledge and custom integration solutions, increasing the total cost of ownership and implementation complexity for end users.
Comparative Analysis of Competing Technologies
01 Raman spectroscopy instrumentation and methods
Various innovations in Raman spectroscopy instrumentation and methodologies have been developed to enhance measurement accuracy and efficiency. These include specialized optical configurations, detection systems, and signal processing techniques that improve the sensitivity and resolution of Raman measurements. Advanced instrumentation allows for more precise identification and characterization of molecular structures through their unique vibrational signatures.- Raman spectroscopy instrumentation and system design: Various innovations in Raman spectroscopy instrumentation focus on improving system design for enhanced performance. These include specialized optical configurations, integration of multiple components, and novel detection systems that optimize signal collection and processing. Advanced designs incorporate features to minimize interference, improve resolution, and enable more accurate spectral measurements across different applications.
- Biomedical applications of Raman spectroscopy: Raman spectroscopy has been adapted for various biomedical applications, including disease diagnosis, tissue analysis, and medical monitoring. These applications leverage the non-invasive nature of Raman techniques to analyze biological samples and provide real-time diagnostic information. Innovations in this area focus on detecting specific biomarkers, analyzing cellular components, and developing methods for in vivo measurements that can aid in clinical decision-making.
- Enhanced data processing and analysis methods: Advanced data processing techniques have been developed to extract meaningful information from Raman spectral data. These methods include specialized algorithms for background subtraction, peak identification, multivariate analysis, and machine learning approaches that improve the interpretation of spectral features. Such techniques enable more accurate identification of chemical components, quantitative analysis, and automated classification of samples based on their spectral signatures.
- Portable and miniaturized Raman systems: Innovations in miniaturization have led to the development of portable and handheld Raman spectroscopy devices. These compact systems maintain analytical capabilities while offering advantages in field deployment, on-site testing, and point-of-care applications. Design improvements focus on reducing size and power requirements while maintaining sensitivity and spectral resolution, enabling Raman analysis outside traditional laboratory settings.
- Surface-enhanced Raman spectroscopy techniques: Surface-enhanced Raman spectroscopy (SERS) techniques significantly amplify Raman signals through interactions with specially prepared metallic surfaces or nanostructures. These methods overcome traditional sensitivity limitations of conventional Raman spectroscopy, enabling detection of trace amounts of analytes. Innovations in this area include development of novel SERS substrates, nanoparticle designs, and application-specific enhancement strategies that extend detection capabilities to previously undetectable concentration levels.
02 Biomedical applications of Raman spectroscopy
Raman spectroscopy has been adapted for various biomedical applications, including disease diagnosis, tissue characterization, and in vivo monitoring. These applications leverage the non-invasive nature of Raman techniques to analyze biological samples and provide molecular-level information about physiological and pathological conditions. The technology enables real-time analysis of biological tissues and fluids without requiring extensive sample preparation.Expand Specific Solutions03 Enhanced Raman techniques and signal processing
Enhanced Raman techniques such as Surface-Enhanced Raman Spectroscopy (SERS) and Resonance Raman Spectroscopy have been developed to overcome traditional sensitivity limitations. These approaches significantly amplify Raman signals, allowing for detection of trace amounts of substances. Advanced signal processing algorithms and computational methods further improve spectral analysis by reducing noise, removing background interference, and extracting meaningful data from complex spectra.Expand Specific Solutions04 Industrial and material analysis applications
Raman spectroscopy has been implemented in various industrial settings for quality control, process monitoring, and material characterization. The technique provides valuable information about chemical composition, crystallinity, and molecular structure of materials ranging from pharmaceuticals to polymers and semiconductors. Industrial applications benefit from the non-destructive nature of Raman analysis and its ability to identify specific chemical components within complex mixtures.Expand Specific Solutions05 Portable and miniaturized Raman systems
Advancements in miniaturization have led to the development of portable and handheld Raman spectrometers that maintain high analytical performance. These compact systems enable on-site analysis in field conditions, expanding the application range to include environmental monitoring, forensic investigations, and point-of-care diagnostics. Miniaturized Raman devices incorporate innovative optical designs and microelectronics to achieve performance comparable to laboratory instruments while offering significantly improved mobility and accessibility.Expand Specific Solutions
Leading Companies and Research Institutions
Raman spectroscopy technology is currently in a growth phase, with the global market expected to reach significant expansion due to increasing applications in pharmaceutical, biomedical, and material science sectors. The competitive landscape features established analytical instrumentation companies like Shimadzu Corp. and Thermo Scientific alongside specialized players such as ChemImage Corp. and Photothermal Spectroscopy Corp., which are driving innovation in hybrid spectroscopic techniques. Academic institutions including MIT, Vanderbilt University, and Xiamen University are advancing fundamental research, while government entities like Naval Research Laboratory contribute to defense applications. The technology demonstrates moderate maturity with ongoing refinements in portability, sensitivity, and integration with complementary techniques, as evidenced by recent developments from companies like Excelitas Technologies and Synaptive Medical focusing on miniaturization and real-time analysis capabilities.
ChemImage Corp.
Technical Solution: ChemImage has developed advanced Raman spectroscopy systems that combine molecular chemical imaging with machine learning algorithms for enhanced detection capabilities. Their proprietary technology integrates Raman with other spectroscopic methods to create multimodal imaging platforms that provide comprehensive chemical analysis. The company's Raman-based solutions employ sophisticated optical filtering techniques to reduce fluorescence interference, a common challenge in traditional Raman spectroscopy. ChemImage's systems utilize standoff detection capabilities allowing for non-contact analysis at distances of several meters, making them suitable for security and defense applications. Their technology also incorporates real-time processing algorithms that enable rapid identification of substances in complex matrices with minimal sample preparation.
Strengths: Superior chemical specificity through multimodal integration; advanced algorithms for interference reduction; standoff detection capabilities. Weaknesses: Higher cost compared to single-mode spectroscopic techniques; complex systems require specialized training; limited portability for some of their more advanced systems.
Photothermal Spectroscopy Corp.
Technical Solution: Photothermal Spectroscopy Corp. has pioneered O-PTIR (Optical Photothermal Infrared) technology as an alternative to traditional Raman spectroscopy. Their approach combines the strengths of both IR and Raman techniques while overcoming their individual limitations. The technology uses a visible probe laser to detect photothermal expansion caused by an IR pump laser, enabling submicron spatial resolution beyond the diffraction limit of conventional IR spectroscopy. This allows for non-contact, non-destructive analysis with IR spectral quality but at Raman-like spatial resolutions (down to 500 nm). Their mIRage IR+Raman system provides simultaneous measurements from the same sampling point, offering complementary chemical information without the fluorescence limitations that plague traditional Raman. The technology is particularly effective for analyzing heterogeneous samples where both chemical specificity and high spatial resolution are required.
Strengths: Overcomes fluorescence interference issues of Raman; provides submicron spatial resolution with IR spectral quality; enables simultaneous complementary measurements. Weaknesses: Requires sophisticated laser systems and precise alignment; higher initial investment than conventional spectroscopy; limited penetration depth compared to some alternatives.
Key Patents and Scientific Breakthroughs
Raman spectroscopy systems and raman spectroscopy methods
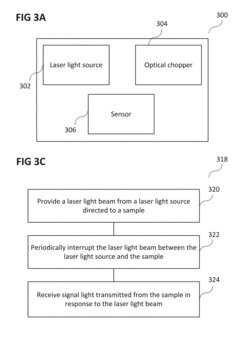
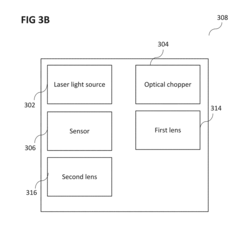
PatentInactiveUS10215630B2
Innovation
- A Raman spectroscopy system and method utilizing a high-speed optical spin-disk or optical chopper to create time-gated short pulses, allowing only the Raman signal to pass through while blocking most of the fluorescence, using a continuous wave laser and regular sensors to reduce setup complexity and cost.
Detection of chemicals with infrared light
PatentActiveEP2201360A1
Innovation
- The method employs an IR source tuned to specific absorption bands to selectively heat analytes, generating a vapor plume for detection without decomposing them, using eye-safe laser sources like QCLs for non-contact, stand-off detection, and analyzing the thermal or photo emissions to identify the presence of the analyte.
Cost-Benefit Analysis of Implementation
Implementing Raman spectroscopy requires careful consideration of both initial investment and long-term operational costs against potential benefits. The initial capital expenditure for a standard Raman spectrometer ranges from $25,000 to $150,000, with high-end research-grade systems potentially exceeding $300,000. This represents a significant upfront investment compared to some alternative technologies like FTIR spectroscopy ($15,000-$60,000) or UV-Vis spectroscopy ($5,000-$30,000).
Operational costs must also be factored into the equation. Raman systems typically require specialized maintenance contracts costing $3,000-$8,000 annually. Additionally, trained personnel are essential, with specialized operators commanding salaries 15-20% higher than those required for alternative spectroscopic methods. However, sample preparation costs are minimal compared to chromatographic techniques, potentially saving $5-15 per sample in consumables.
Energy consumption presents another consideration, with Raman systems consuming approximately 300-500W during operation—comparable to FTIR but higher than basic UV-Vis systems. The expected service life of 8-12 years for modern Raman instruments provides a reasonable depreciation timeline for capital recovery calculations.
The benefits side of the equation reveals Raman's distinct advantages. Studies across pharmaceutical, materials science, and food safety sectors demonstrate 30-40% reductions in analysis time compared to traditional methods. This translates to throughput improvements of 25-35% in quality control environments. The non-destructive nature of Raman analysis preserves valuable samples, potentially saving thousands in material costs annually for research facilities.
Regulatory compliance benefits are substantial, with FDA and EMA increasingly accepting Raman data for pharmaceutical verification. Organizations implementing Raman technology report 15-25% reductions in compliance-related costs through streamlined documentation and reduced secondary testing requirements.
Return on investment calculations indicate breakeven periods of 2.5-4 years for pharmaceutical applications, 3-5 years for materials science implementations, and 4-6 years for food safety applications. These timelines compare favorably against alternative spectroscopic methods when accounting for total cost of ownership and productivity gains.
Organizations should conduct sensitivity analyses considering variables such as sample volume, regulatory requirements, and staff expertise when evaluating implementation decisions. The most favorable cost-benefit ratios typically emerge in high-throughput environments with stringent quality control requirements and valuable sample materials.
Regulatory Compliance and Standards
Regulatory compliance and standards play a critical role in the adoption and implementation of Raman spectroscopy and its technological alternatives across various industries. The regulatory landscape for spectroscopic technologies is complex and varies significantly across different regions and application domains, particularly in highly regulated sectors such as pharmaceuticals, food safety, and healthcare.
In the pharmaceutical industry, Raman spectroscopy has gained significant regulatory acceptance through initiatives like the FDA's Process Analytical Technology (PAT) framework and Quality by Design (QbD) approach. These frameworks encourage the implementation of advanced analytical methods for real-time monitoring and quality control. The European Medicines Agency (EMA) has similarly endorsed spectroscopic methods in their guidelines for pharmaceutical manufacturing and quality assurance.
For food safety applications, regulatory bodies including the FDA in the US and the European Food Safety Authority (EFSA) have established protocols for validating spectroscopic methods for contaminant detection and food authentication. These protocols typically require demonstration of specificity, sensitivity, accuracy, and reproducibility compared to established reference methods.
International standards organizations have developed specific guidelines for spectroscopic technologies. The ASTM International has published several standards related to Raman spectroscopy, including ASTM E1840 for standard guide for Raman shift standards for spectrometer calibration. Similarly, ISO has developed standards such as ISO 22196 for antimicrobial testing that can incorporate spectroscopic methods.
Competing technologies face varying regulatory hurdles. Near-infrared (NIR) spectroscopy has established regulatory acceptance in many industries, with specific pharmacopeial methods in USP and EP. Mass spectrometry methods often require more extensive validation protocols due to their destructive nature and complex sample preparation requirements.
Emerging regulatory trends indicate increasing acceptance of spectroscopic methods as alternatives to traditional analytical techniques. However, this acceptance is contingent upon thorough method validation and demonstration of equivalence to reference methods. The concept of "regulatory science" is gaining prominence, emphasizing scientific evidence to support regulatory decision-making regarding new analytical technologies.
Compliance challenges specific to Raman spectroscopy include validation of portable and handheld devices, standardization of data processing algorithms, and ensuring consistent performance across different instrument platforms. These challenges necessitate robust quality management systems and regular performance verification protocols to maintain regulatory compliance.
Unlock deeper insights with PatSnap Eureka Quick Research — get a full tech report to explore trends and direct your research. Try now!
Generate Your Research Report Instantly with AI Agent
Supercharge your innovation with PatSnap Eureka AI Agent Platform!