
A gis state recognition method based on vibration signal principal component analysis
A principal component analysis, vibration signal technology, applied in character and pattern recognition, testing of mechanical parts, testing of machine/structural parts, etc., can solve the problem that the mechanical state and feature quantity are not in a one-to-one correspondence, and increase the workload of the computer , reduce the calculation speed and accuracy, etc., to achieve the effect of high accuracy, improved accuracy and speed, and fast convergence speed
Patent Information
- Authority / Receiving Office
- CN · China
- Patent Type
- Patents(China)
- Current Assignee / Owner
- Publication Date
- 2020-11-17
Smart Images
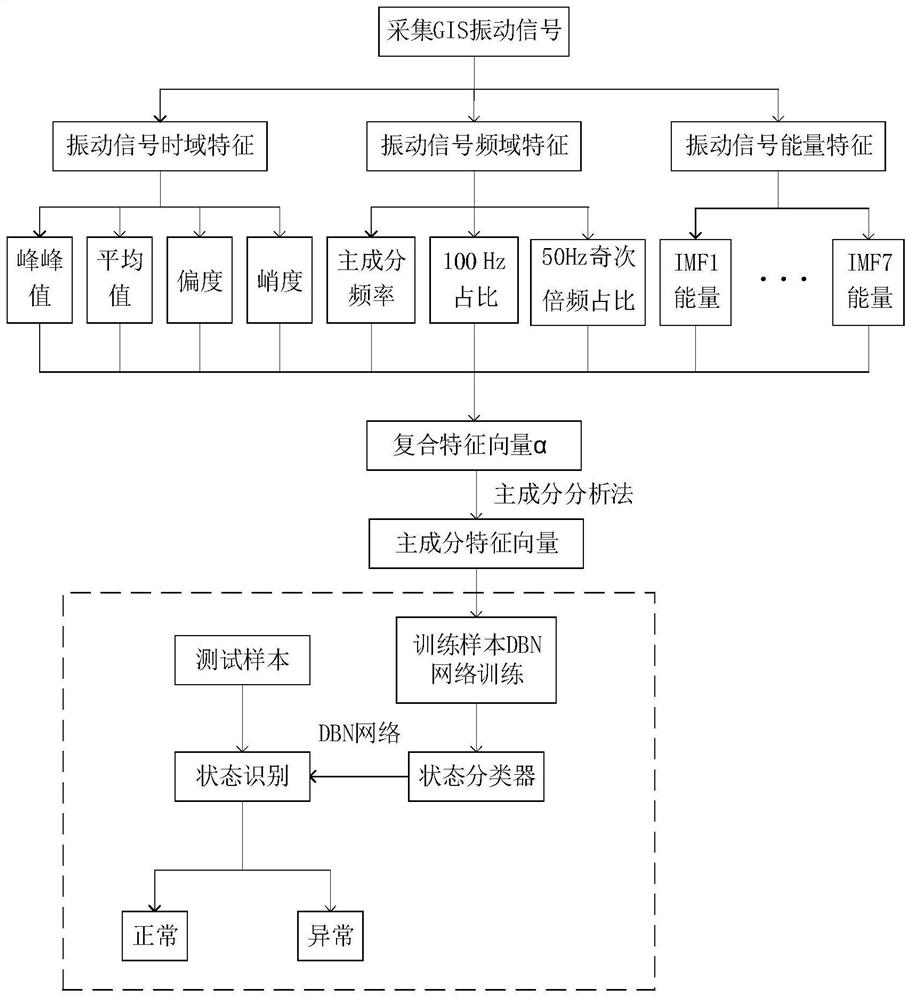
Figure 1 
Figure 2 
Figure 3
Abstract
Description
technical field
[0001] The invention relates to the technical field of gas-insulated metal-enclosed switchgear (GIS) state recognition technology, in particular to a GIS state recognition method based on a vibration signal principal component analysis method. Background technique
[0002] Gas Insulated Switchgear (GIS) came out in the 1960s and developed rapidly because of its small footprint, high reliability, strong safety, short installation period, and small maintenance workload. , has been widely used in substations of all levels around the world. However, due to its complex and fully enclosed structure, once GIS fails, it will have a wide range of effects and it is difficult to accurately locate and quickly repair it.
[0003] Therefore, in order to ensure the safe and stable operation of the power grid, the reliability of GIS is particularly important, so it has become a top priority to effectively identify the fault state of GIS. At present, the methods for monitor...
Examples
Embodiment
[0044] Such as figure 1 Shown, a kind of GIS state recognition method based on vibration signal principal component analysis method, described method comprises:
[0045] Step 1: Install a vibration acceleration sensor on the GIS to collect multiple groups of vibration signals under normal and fault conditions of the GIS;
[0046] Step 2: Process the GIS vibration signal collected in step 1, extract the time domain, frequency domain and energy features of the GIS vibration signal respectively, and construct the composite feature vector of the GIS vibration signal;
[0047] Step 2.1: Extract the time-domain features of the GIS vibration signal, including the peak-to-peak value, average value, skewness and kurtosis of the GIS vibration signal;
[0048] (1) peak-to-peak value
[0049] The peak-to-peak value can represent the GIS vibration intensity, and the calculation formula is:
[0050] x pp =x max -x min (1)
[0051] Where: x max Indicates the maximum value of the GIS...