
Visualization of nucleic acid sequences
a nucleic acid sequence and visualization technology, applied in the field of computer-aided analysis of bioinformatics data, can solve the problems of difficult sequence analysis, burdensome sequence analysis task, and difficult analysis of the resulting sequence, so as to improve the quality of sequencing data
Patent Information
- Authority / Receiving Office
- US · United States
- Patent Type
- Applications(United States)
- Current Assignee / Owner
- Publication Date
- 2015-11-19
- Estimated Expiration
- Not applicable · inactive patent
Smart Images
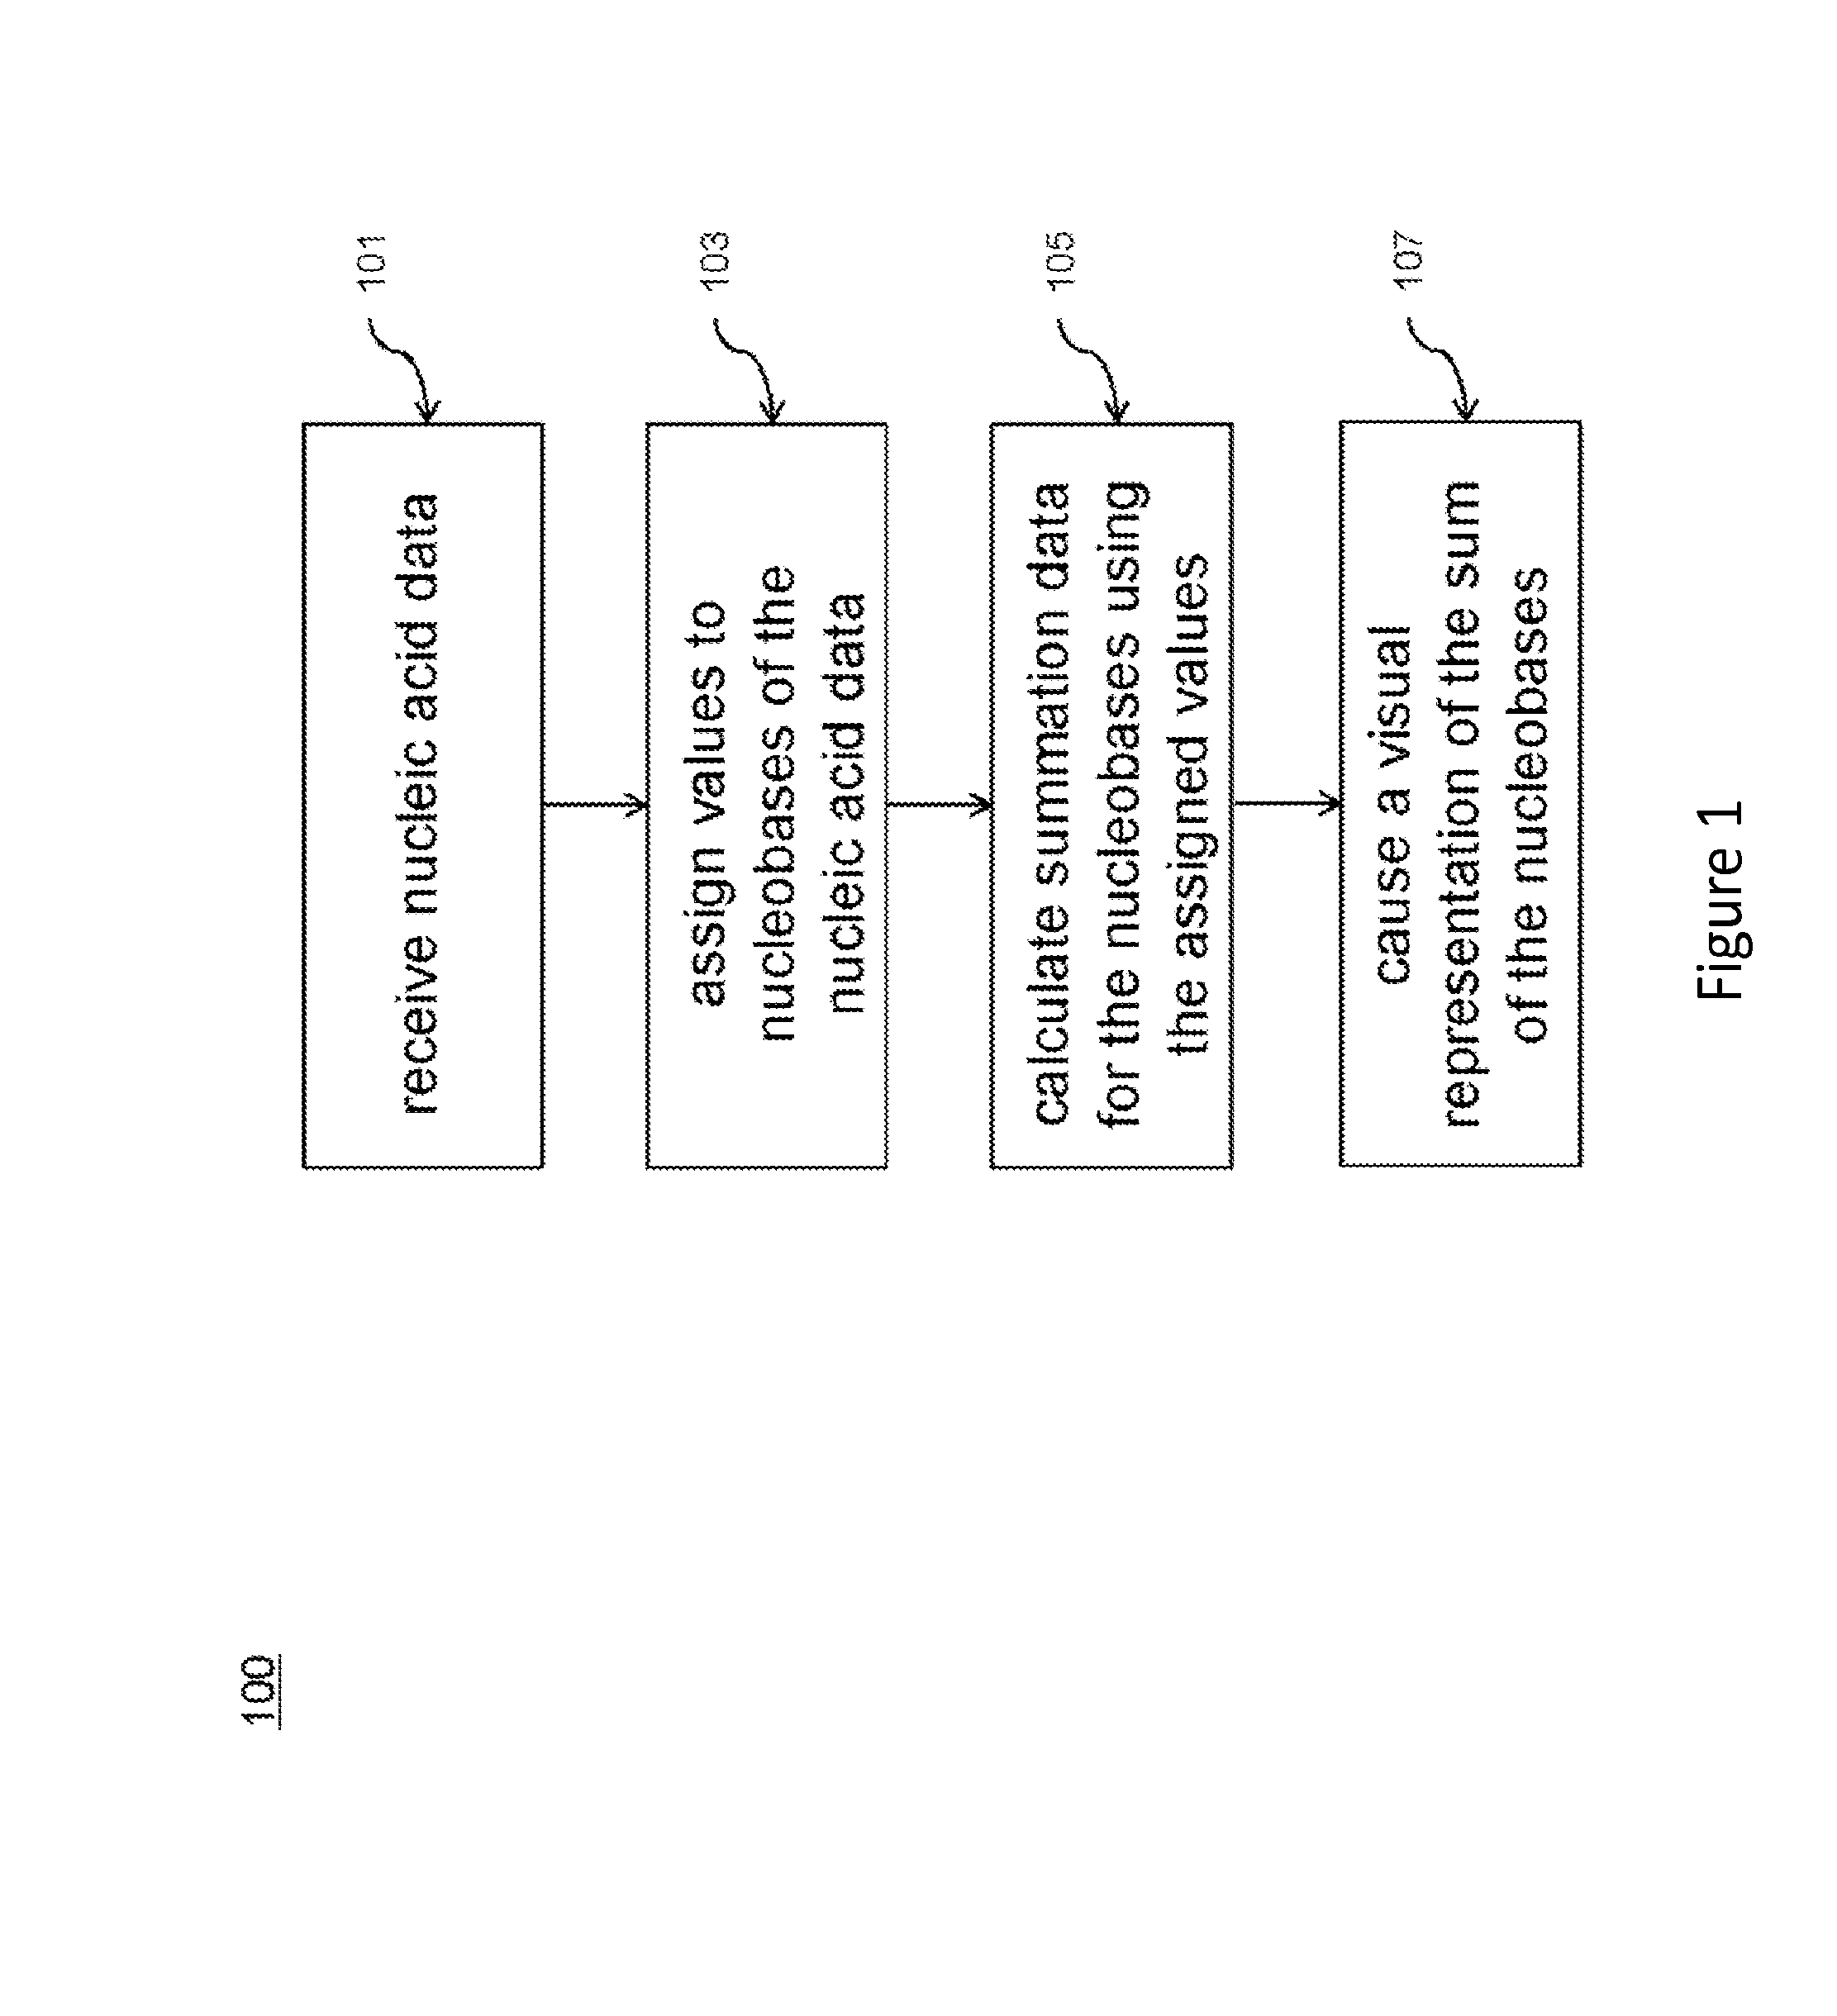
Figure 1 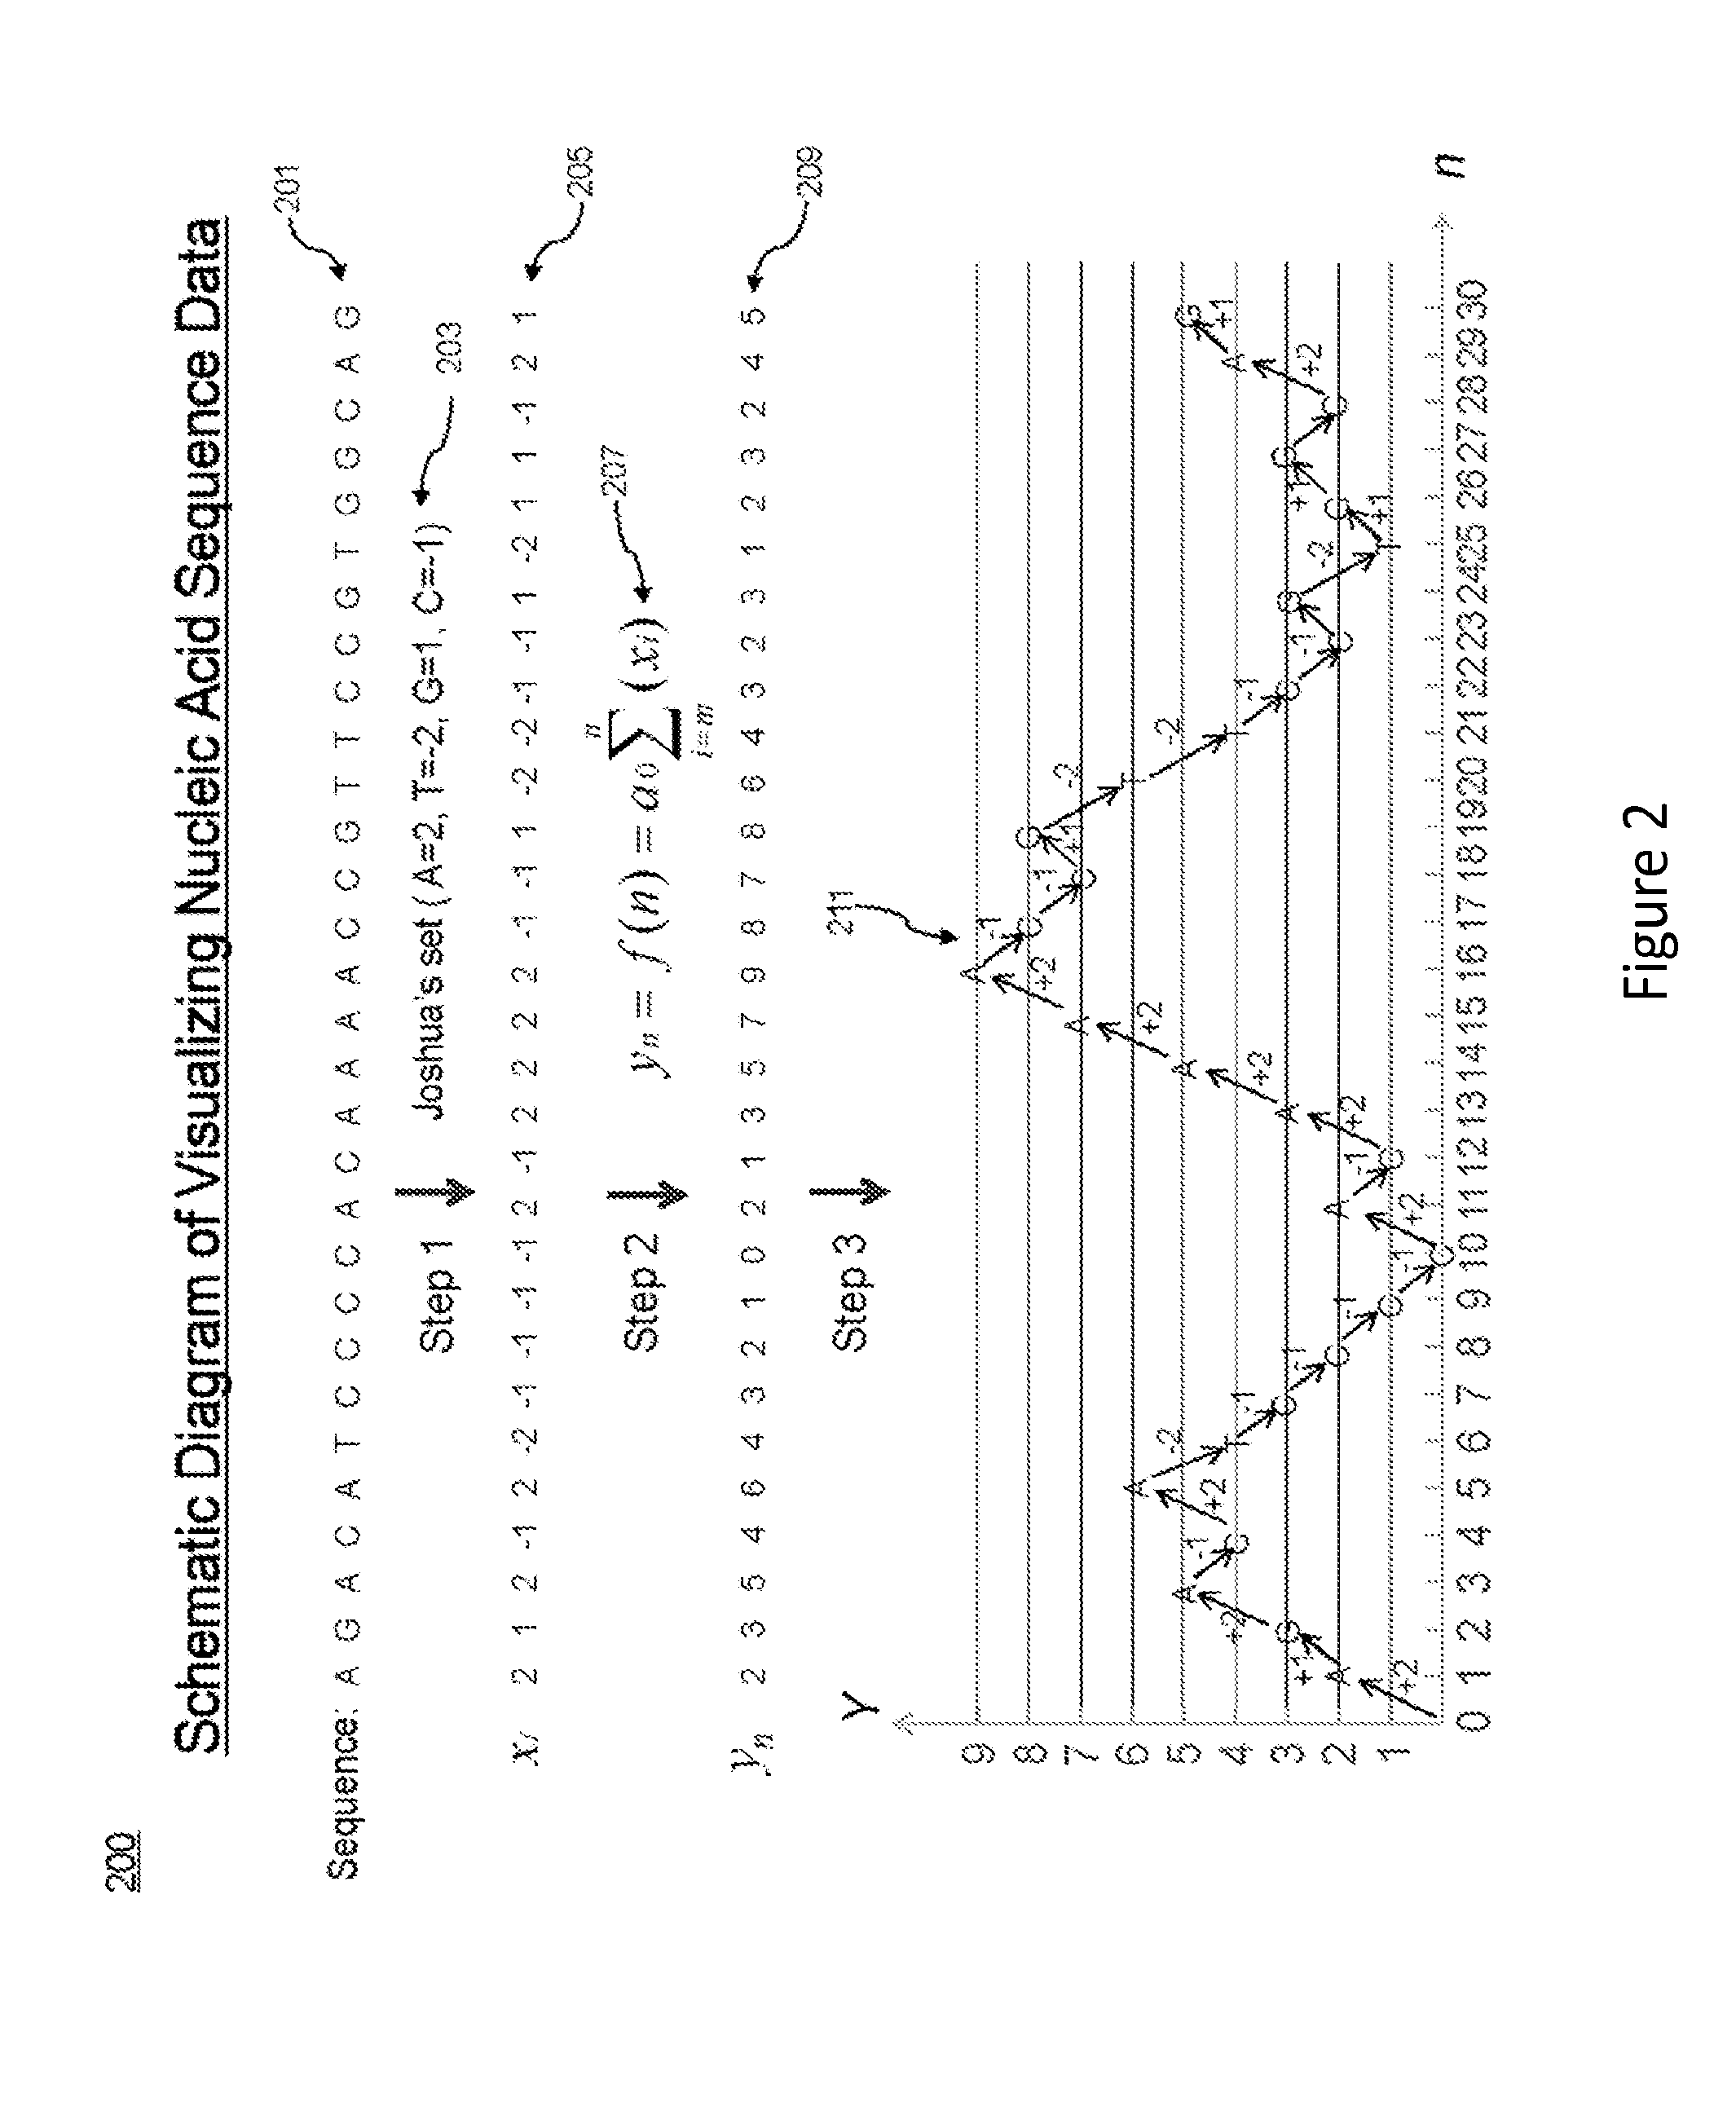
Figure 2 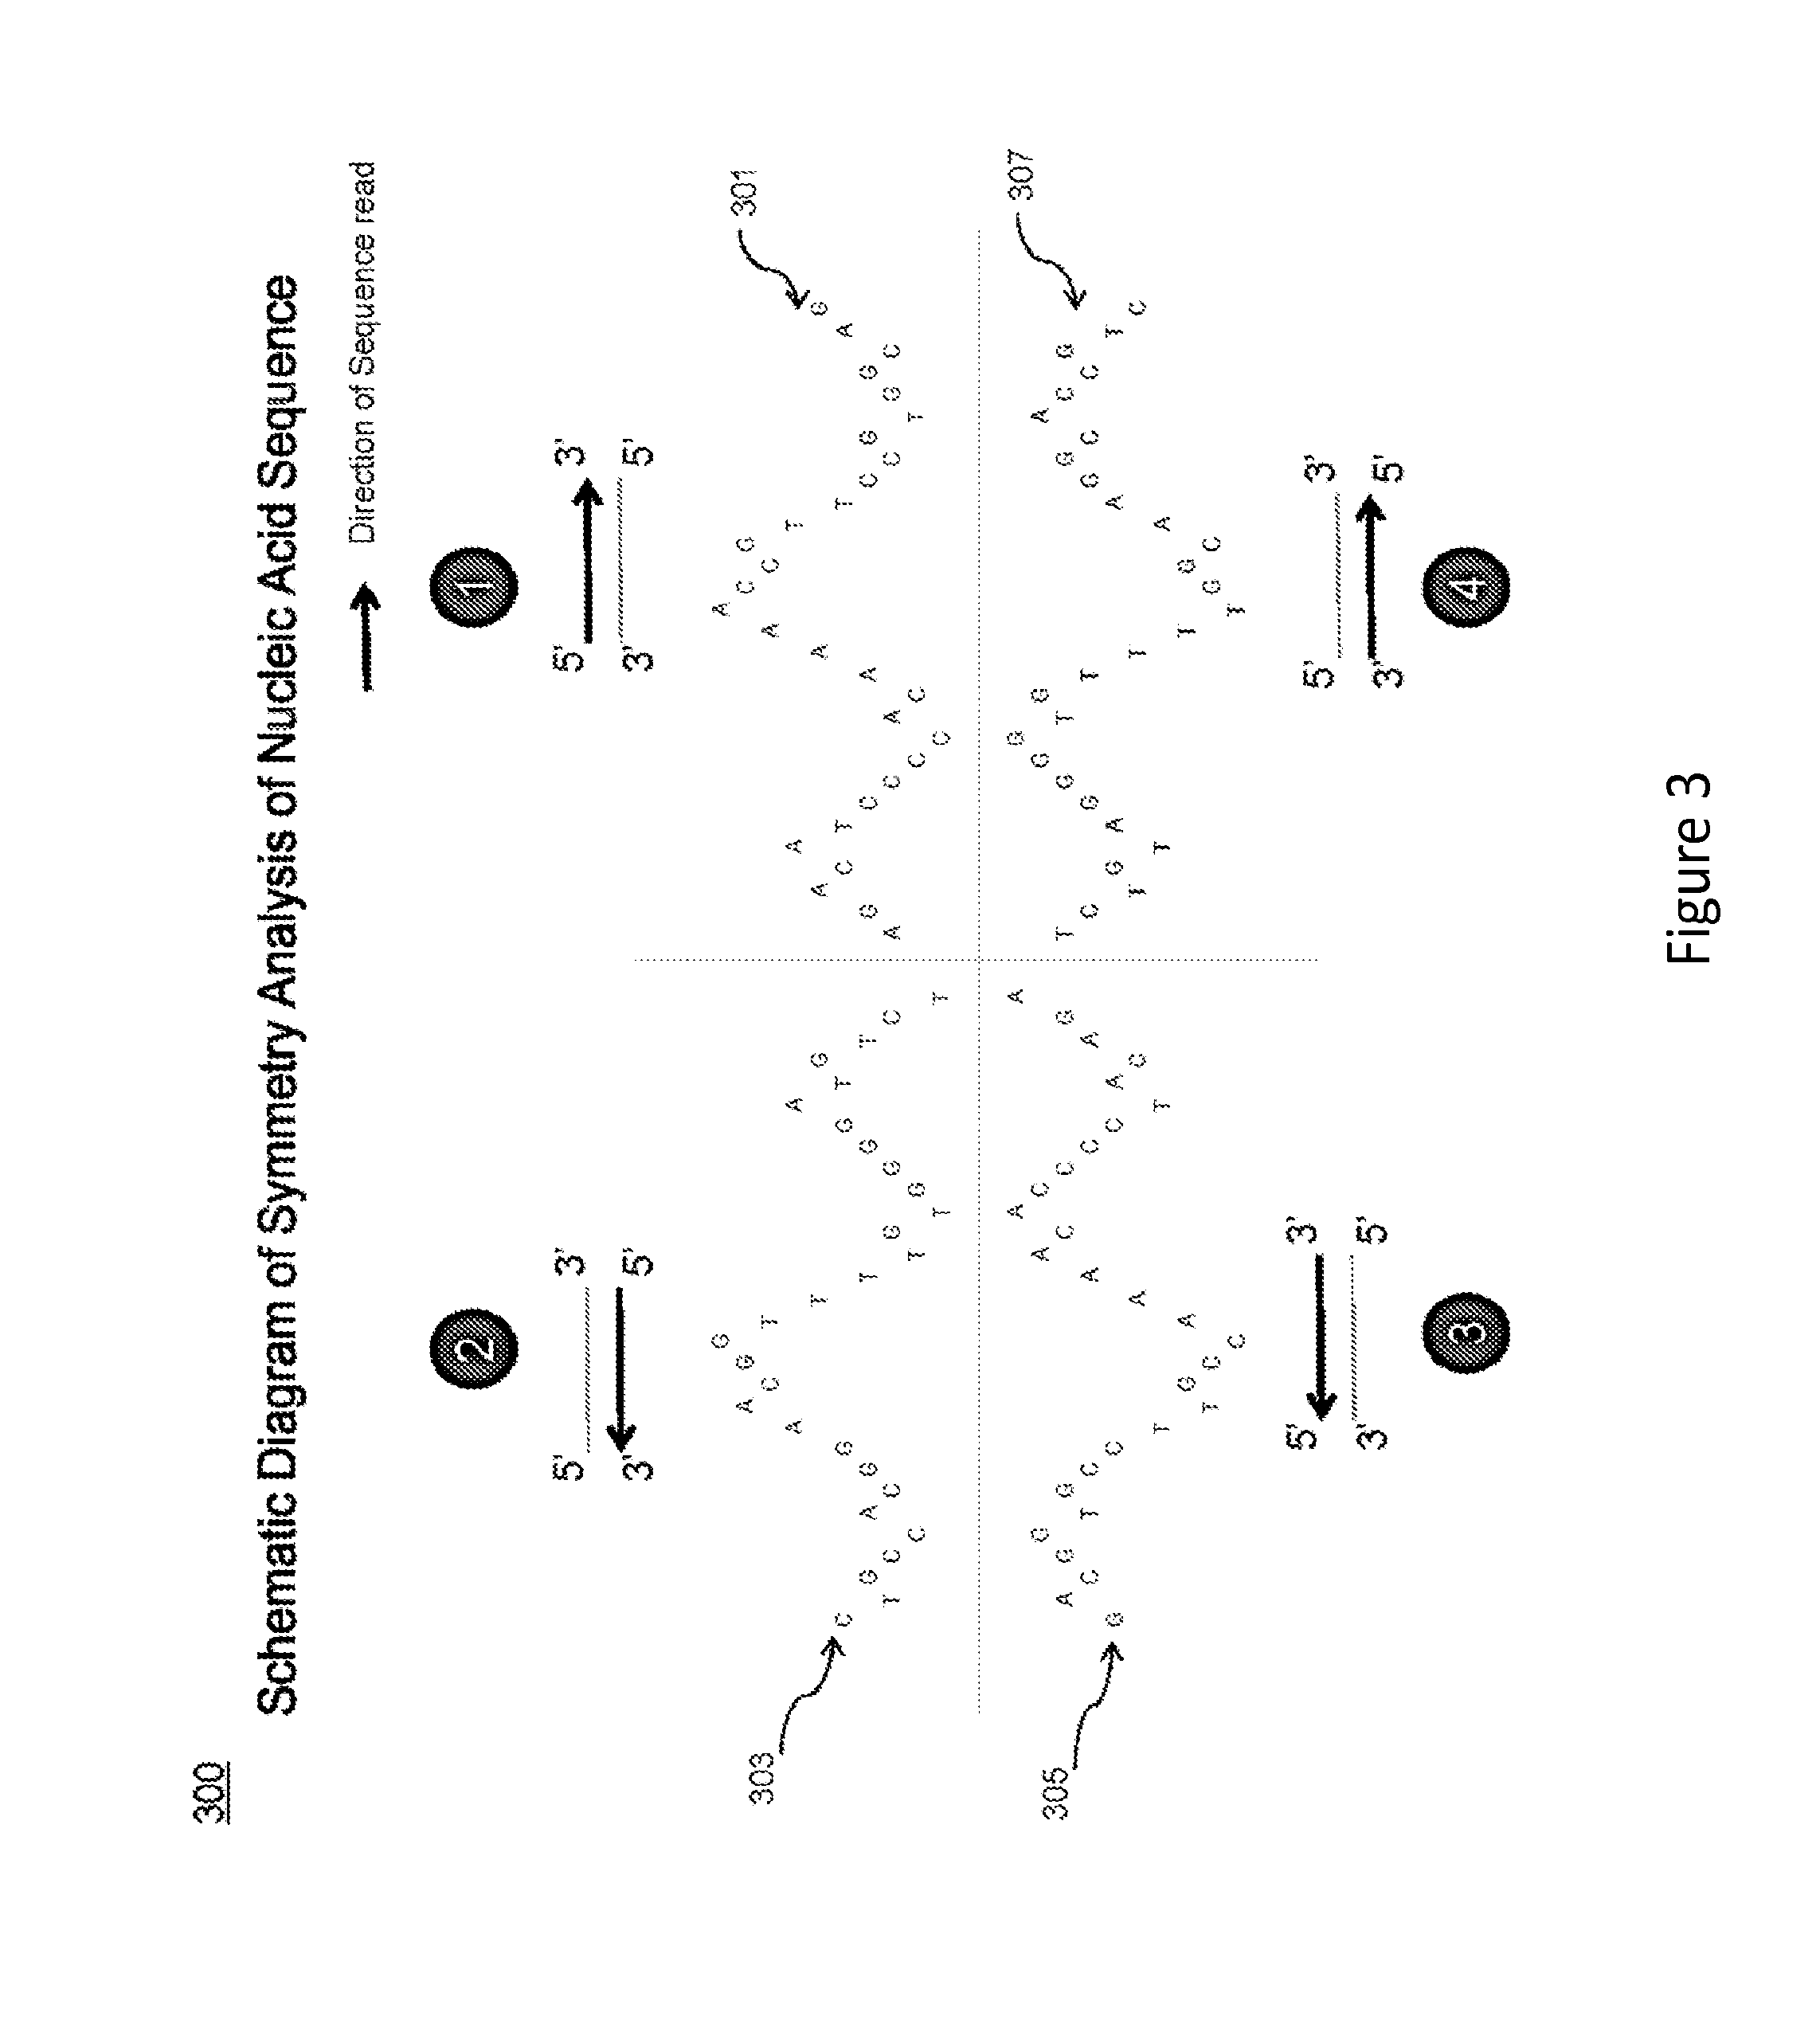
Figure 3
Abstract
Description
[0001] This application claims the benefit of and priority to U.S. Provisional Application Ser. No. 61 / 757,007, filed Jan. 25, 2013, the disclosure of which is hereby incorporated by reference in its entirety.BACKGROUND
[0002] 1. Field
[0003] This disclosure relates generally to computer-aided analysis of bioinformatics data and, more specifically, to computer-aided analysis of nucleic acid sequences.
[0004] 2. Related Art
[0005] Deoxyribonucleic acid (DNA) molecule contains the genetic code used in the development and functioning of living organisms. These instructions are encoded in two anti-parallel strands of nucleotides that make up the DNA molecule. Specifically, the instructions are stored in the nucleotides as a chain of four different nucleotides (adenine (A), cytosine (C), guanine (G), and thymine (T)). The specific sequence of the nucleotides defines all physical characteristics of the organism.
[0006] To better understand how DNA sequences affect living organisms, a process called ...
Examples
Embodiment Construction
[0036]The present application provides methods (such as computer-implemented methods, including systems and processes) for analyzing nucleic acid data. An exemplary method includes receiving a nucleotide sequence. Individual nucleobases within the nucleotide sequence are assigned numerical values. Using these assigned values, sums can be calculated for each position within the nucleotide sequence. The resulting sums can then be displayed in various ways, for example in the form of curves (also termed as “sequence spectra”).
[0037]The methods provided herein allow ready analyses of a large amount of sequence information. By visually displaying the nucleotide sequence data in the form of curves (“sequence spectra”), one can readily identify characteristic curve patterns (such as peaks and / or peak clusters) that correspond to a particular nucleotide sequence, i.e., a sequence of particular nucleotide combination. By way of example, the rise of the curve in some embodiments correlates (a...