

Method of separating text and graphs in digital image data
a digital image and graph technology, applied in the field of image processing methods for digital image data, can solve the problems of high hardware cost, complicated process, and difficult to realize, and achieve the effects of reducing the cost of the processing chip, speeding up the operation, and simplifying the procedure and algorithm
Patent Information
- Authority / Receiving Office
- US · United States
- Patent Type
- Patents(United States)
- Current Assignee / Owner
- Publication Date
- 2007-12-25
- Estimated Expiration
- Not applicable · inactive patent
Smart Images
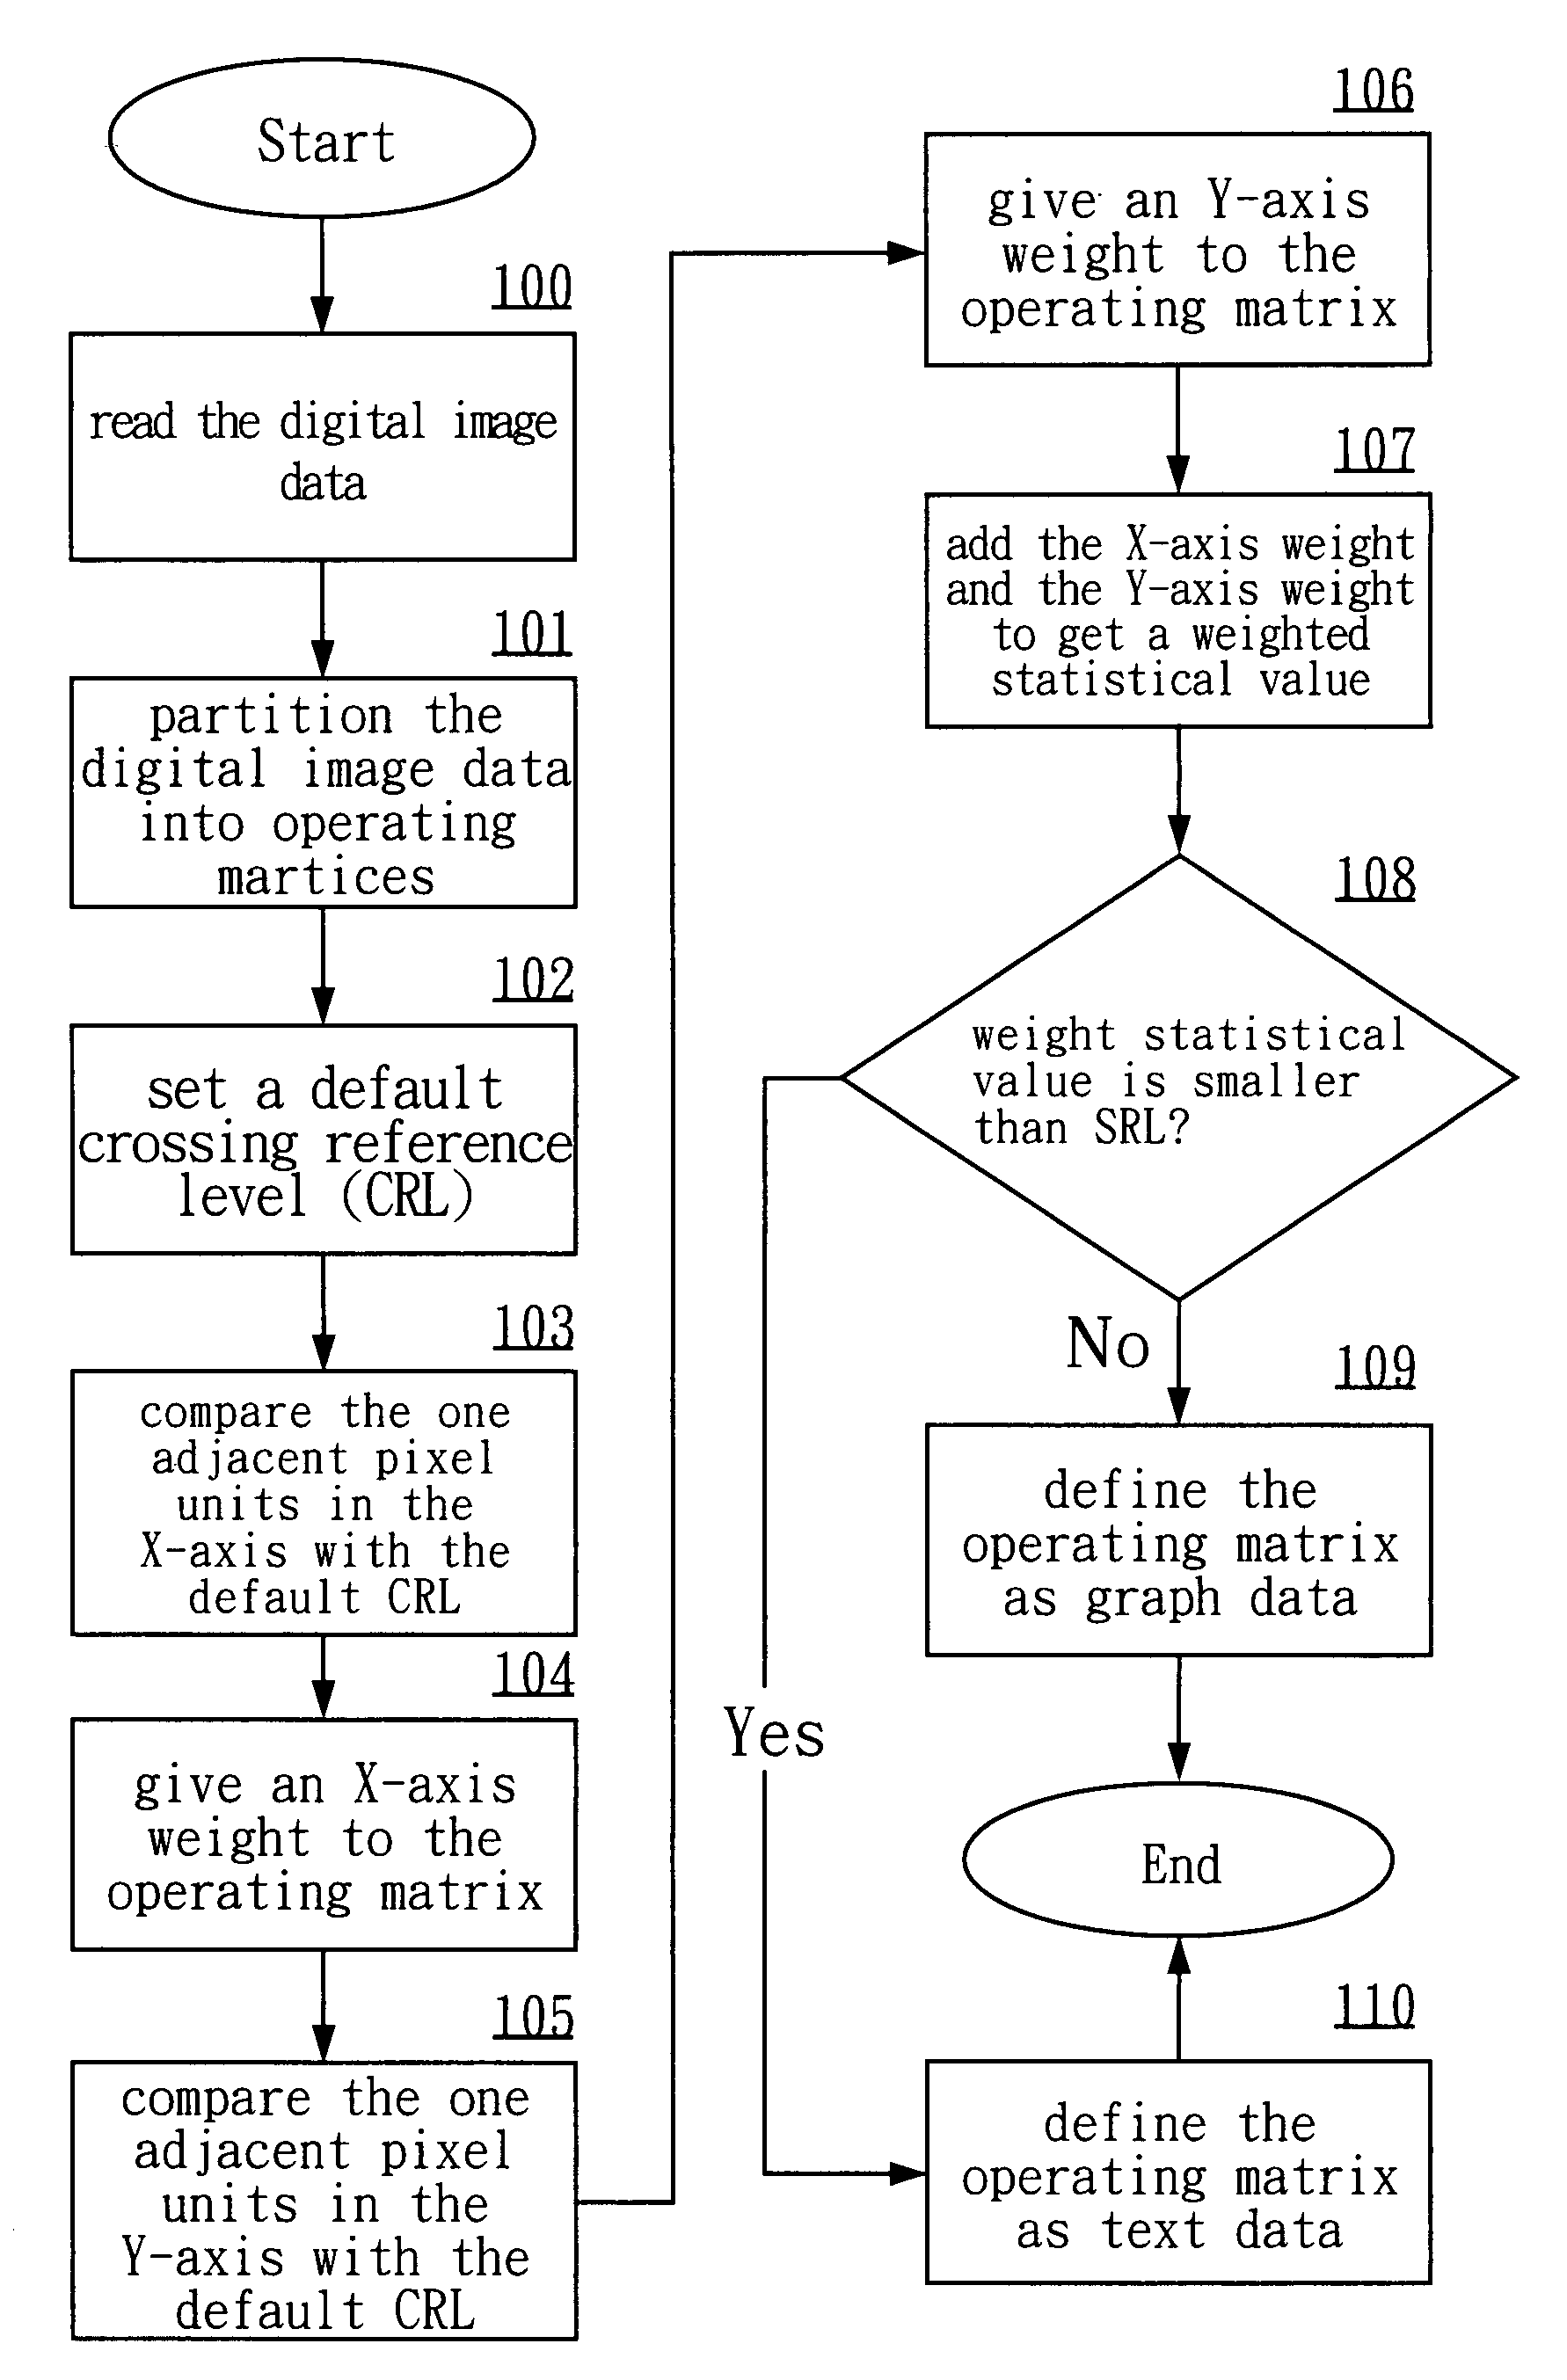
Figure 1 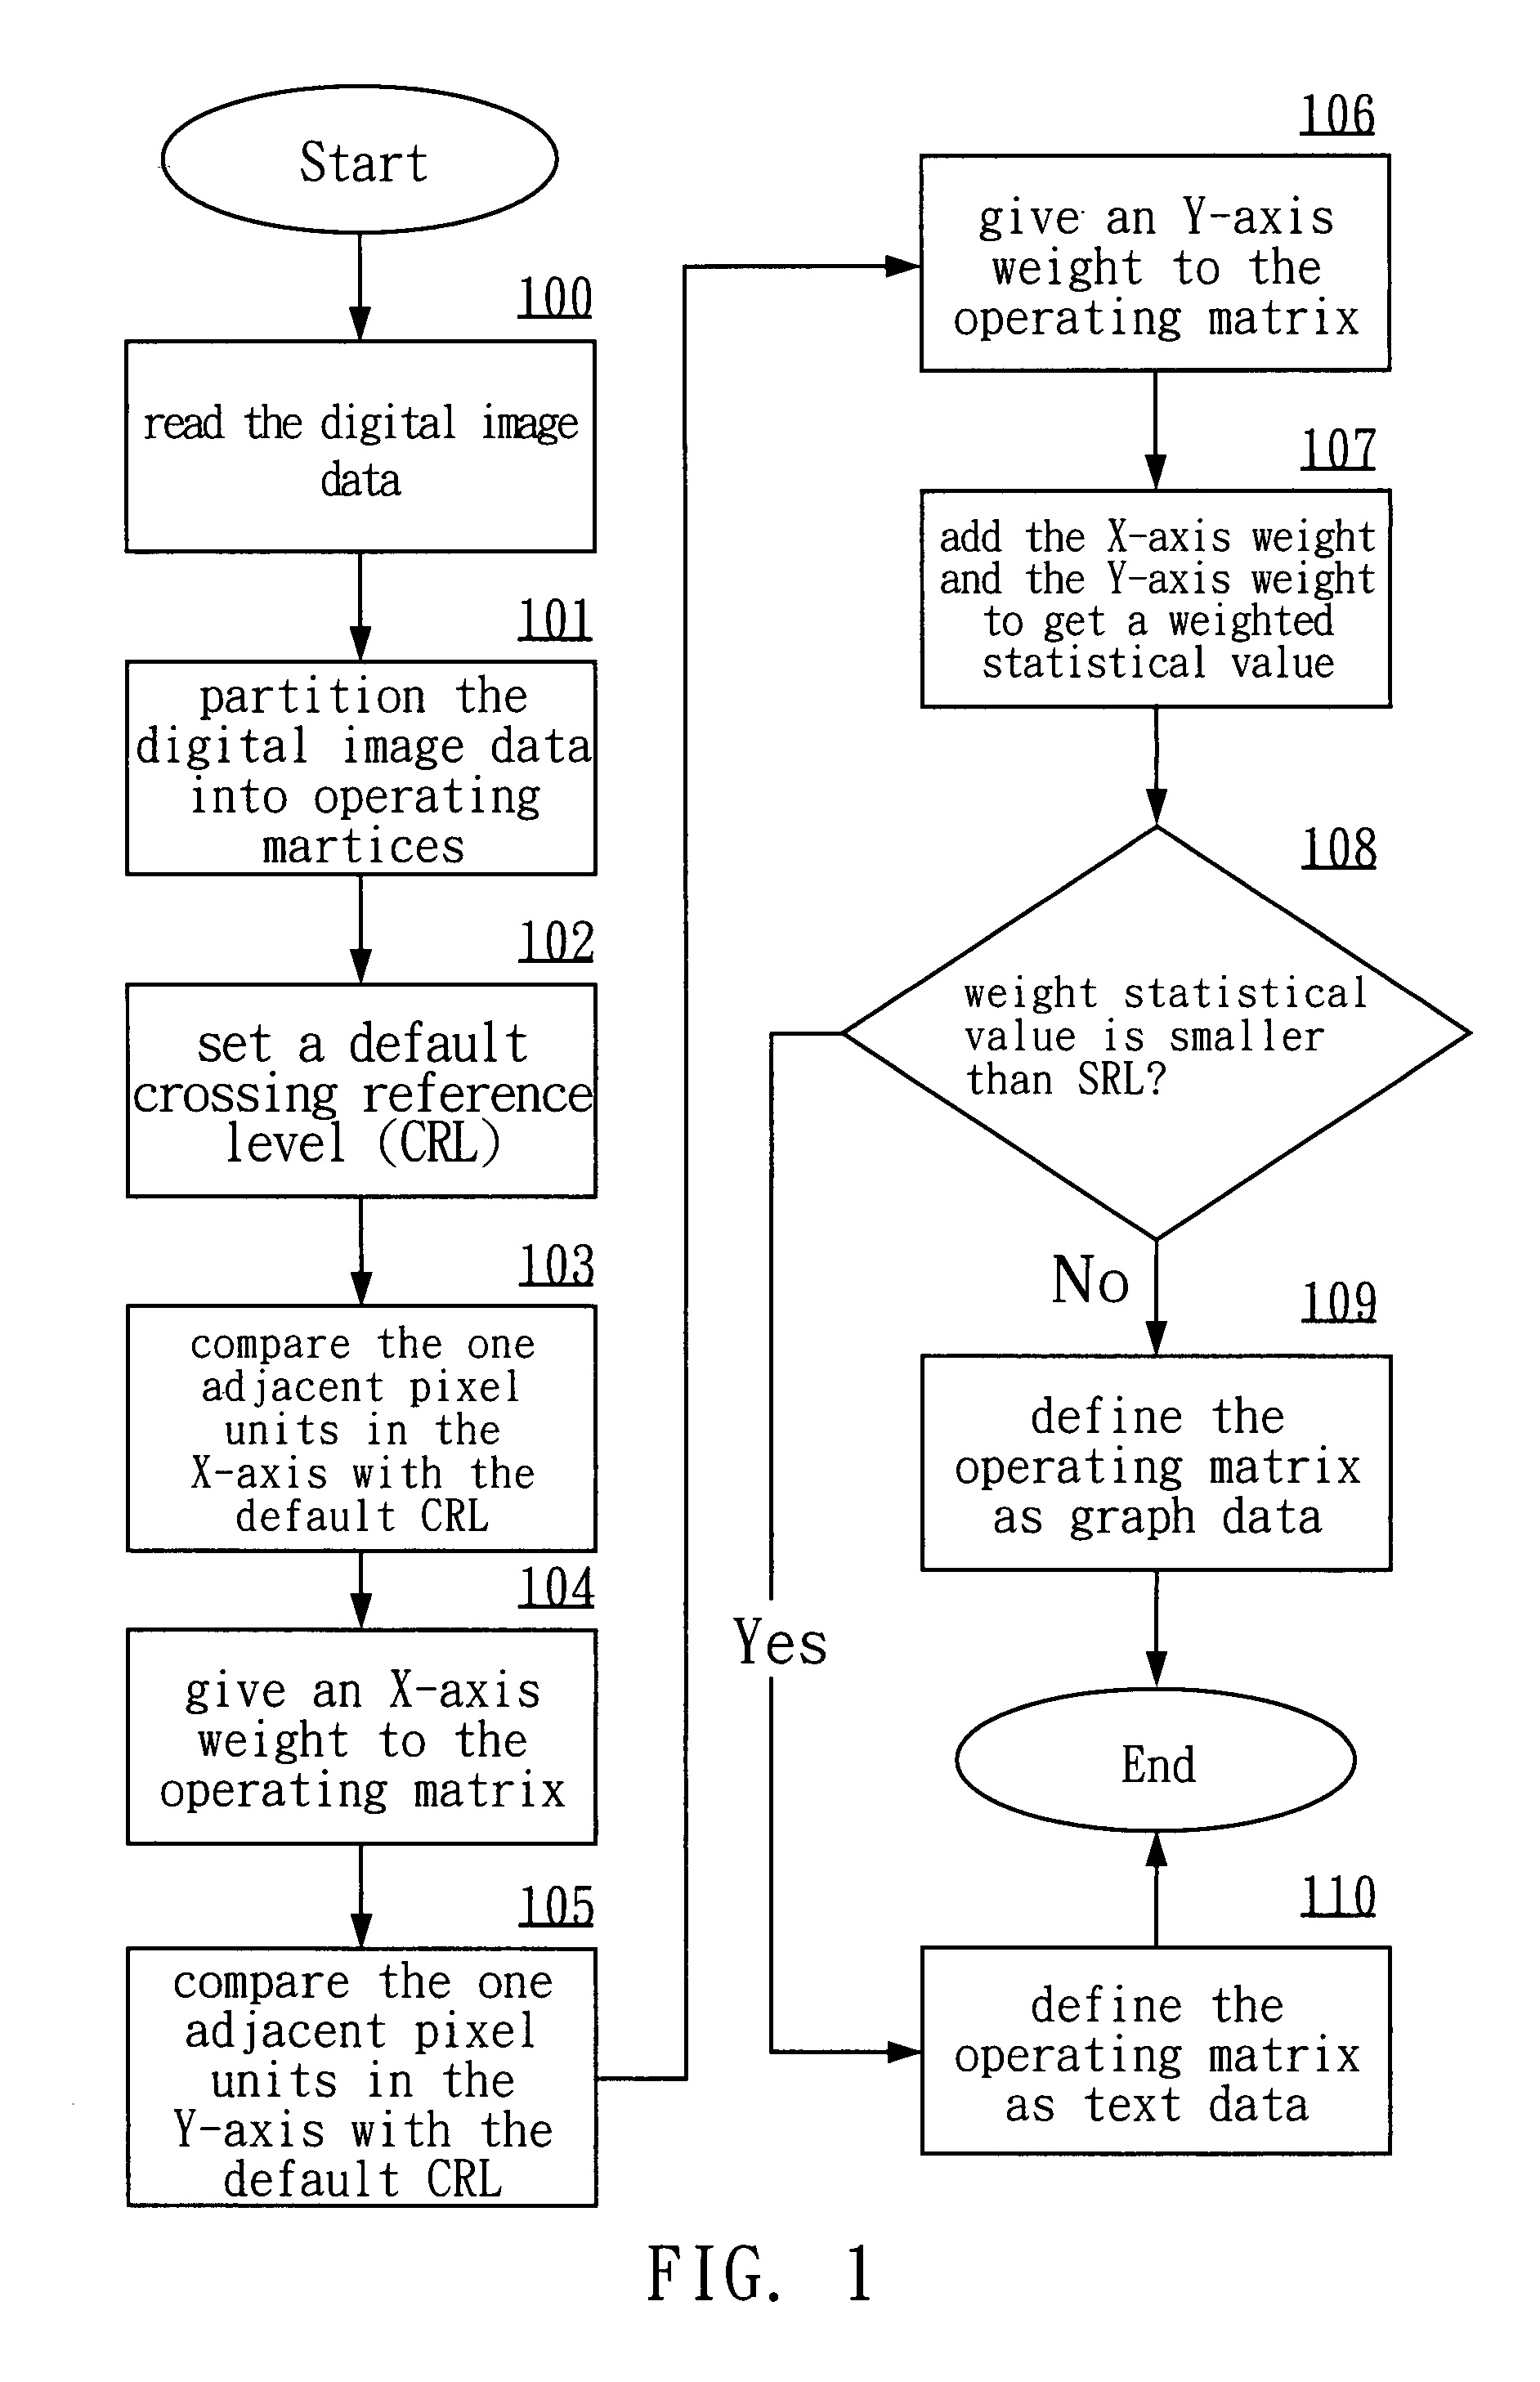
Figure 2 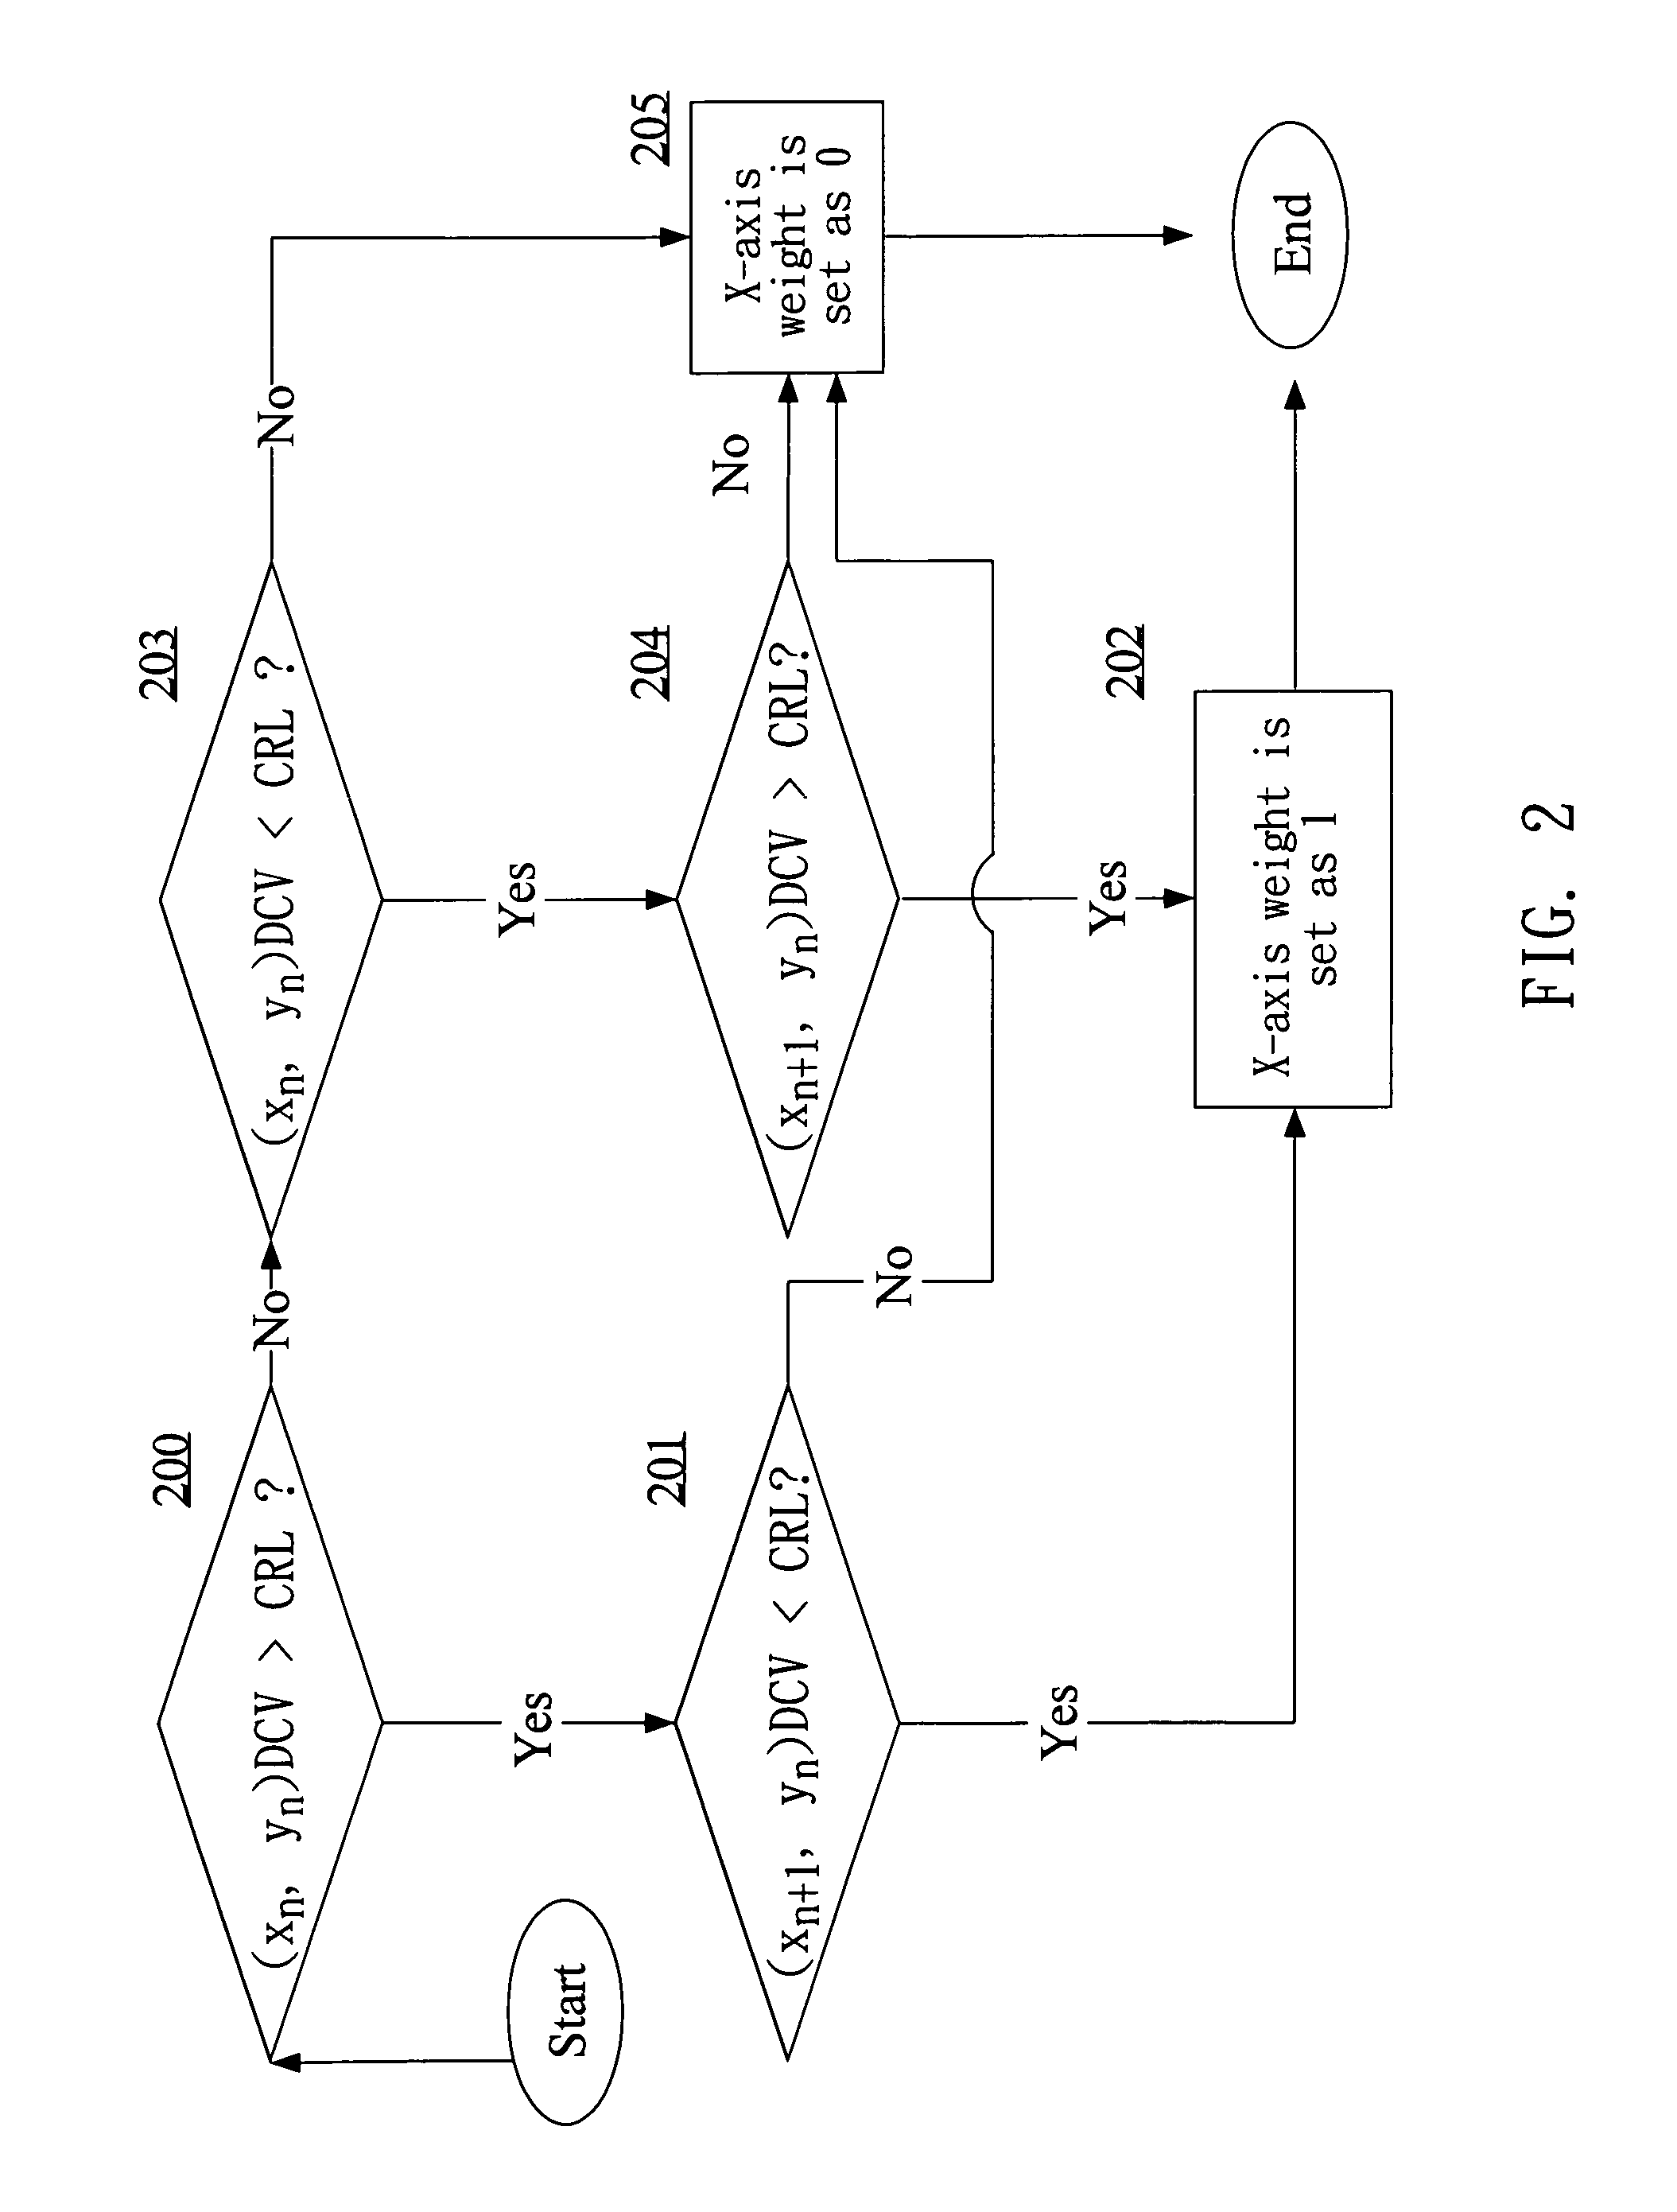
Figure 3
Abstract
Description
BACKGROUND OF THE INVENTION
[0001] 1. Field of Invention
[0002] The invention relates to an image processing method for digital image data and, in particular, to a method of separating graph data from text data in digital image data.
[0003] 2. Related Art
[0004] In order to obtain a better printing quality or a sharper image effect, digital image data have to be analyzed. A common method is to separate the graph data and the text data in the digital image data. There are many ways to implement the separation of graphs and text in digital image data. Discussions of such techniques can be readily found in journals, academic theses, and patents. For example, the U.S. Pat. No. 5,379,130 (hereinafter as P130), U.S. Pat. No. 5,889,885 (hereinafter as P885), and U.S. Pat. No. 6,681,053 (hereinafter as P053) have disclosed related techniques.
[0005] The purpose of the patent P130 is to increase the printing quality of digital image data. This patent uses a 3×3 matrix to process the image. It further ...
Examples
Embodiment Construction
[0018]We refer to FIGS. 1 to 7 to explain the procedure in the disclosed method of graph-text separation in digital image data. The method first read in digital image data provided by an electronic device such as a computer system, a printer, or a scanner (step 100). The digital image data are then partitioned into several operating matrices according to a default separating parameter (step 101). Each operating matrix consists of n×n pixel units, each of which contains X and Y coordinates. Moreover, each pixel unit has a digital characteristic value (DCV), which may be the level of gray, the RGB values, and the color saturation. In other words, the DCV gives the pixel characteristic of a pixel unit.
[0019]After step 101, one sets a default crossing reference level (CRL) (step 102) for performing a comparison analysis. The comparison analysis is done for adjacent two pixel units in the X direction or Y direction of the operating matrix. That is, we take two adjacent pixel units in the...