
Artificial intelligence supported solar power plant photovoltaic panel inspection system and its method
An AI-supported system using UAV thermal and RGB images converts 2D to 3D models and conducts solar simulations to efficiently detect defects in solar power plants, enhancing energy generation and reducing maintenance costs.
Patent Information
- Application Number
- PCT/TR2024/051253
- Authority / Receiving Office
- WO · WO
- Patent Type
- Applications
- Current Assignee / Owner
- Filing Date
- 2024-10-25
- Publication Date
- 2025-05-01
AI Technical Summary
Existing solar power plant inspection systems are inefficient and costly due to reliance on manual processes and 2D orthophoto analysis, which fail to accurately detect defects in PV panels and predict energy generation losses.
An AI-supported system that uses thermal and RGB images from UAVs to perform pixel-based thermal examinations, convert 2D images to 3D models, and conduct real-time solar simulations and navigation analyses to detect defects and optimize energy generation.
The system enables rapid, accurate detection of defects in PV panels, reduces maintenance costs, and increases energy efficiency by providing detailed 3D models and real-time performance analysis.
Smart Images
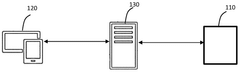
Figure 00000065_0000 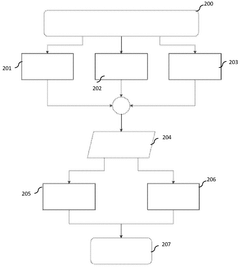
Figure 00000065_0001 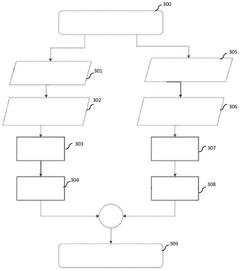
Figure 00000066_0000
Abstract
Description
[0001] ARTIFICIAL INTELLIGENCE SUPPORTED SOLAR POWER PLANT PHOTOVOLTAIC PANEL INSPECTION SYSTEM AND ITS METHOD
[0002] Technical Field of the Invention
[0003] The present invention relates to the detection of defects in photovoltaic panels on a panel cell basis by performing pixel-based thermal examination (thermographic examination) from unmanned aerial vehicle raw images with artificial intelligence technology, model conversion of images from two dimensions to three dimensions, real-time solar simulation and field navigation analysis.
[0004] State of the art
[0005] The energy generation efficiency and operational effectiveness of solar power plants depend on factors such as panel placement, exposure to sunlight, and the speed and safety of field crews on site. Existing techniques often consider factors such as the topography of the land (slope, elevation differences, geotechnical effects) independently or inadequately.
[0006] Detecting errors in PV Panels is an important problem. This problem is difficult to detect and eliminate, and in case of delay, it causes energy generation losses. Using manual solutions to detect these errors both complicates and delays the process. Therefore, it also causes cost increase and losses. The data obtained in thermographic inspections with traditional methods used in error detection and efficiency calculations, 2D orthophotos obtained with drone flights give outputs based only on the date and time of the inspection. Since no prediction can be made for before and after, other than the date and time of the inspection, efficiency analysis calculations based on geotechnics and topographic effects of the land cannot be made.
[0007] Malfunction detection in PV panels, which form the basis of Solar Power Plants (SPPs), is one of the most important issues. When we look at these problems in general, cell malfunctions are at the top of them. As it is known, PV panels consist of thousands of solar cells and solar energy is converted into electrical energy through these cells. Malfunctions that may occur in the cells include breaks, cracks, damage due to heat stress or loss of electrical contact. These malfunctions may cause a decrease in electricity production, loss of energy production, system instability or loss of performance. In addition, Port Malfunctions and Cable or cabling malfunctions may occur in Solar Power Plants. Since PV panels are connected to each other with connection points and cables, problems such as malfunctions at connection points, loose connections, broken cables, bad contact such as oxidation may occur. Such malfunctions may affect the electrical connection between panels, leading to power or production loss, outages, or loss of service. Malfunctions may occur in DC (direct current) and AC (alternating current) cables in PV panel connections. These malfunctions may be caused by problems such as damage to the cables, damage to the insulation or breakage. Cable malfunctions can cause energy loss, power drop or even fire risk. Inverter malfunctions are another type of malfunction. Some of the malfunctions that may occur during operation include inverters that convert DC power to AC power becoming disabled, losing efficiency, causing unbalanced power production, or completely failing. Such malfunctions affect energy efficiency and reduce power production. Environmental factors are another situation that should be taken into consideration. Since PV panels are in outdoor environments, they may be exposed to different threats and risks, and these factors may cause malfunctions. Factors such as extreme temperature, frost, weather conditions (wind, rain, hail, storm, tornado), humidity, sand or dust accumulation can cause unwanted damage to the panels. Naturally, such damage can negatively affect the performance of the panels.
[0008] These and similar malfunction types are some of the common problems encountered in PV panels. Maintenance and regular control of solar power plants, early detection and intervention of such faults, reduces system efficiency, reduces losses or risks of encountering any negativities in production.
[0009] Although many solutions have been developed in the literature to identify and resolve these malfunctions, these solutions are partially or completely human- or operator- oriented. Naturally, although these solutions contribute, they are still among the problems that affect the time and cost elements in the systems. The invention subject to the application numbered "KR2431935B1", which is in the state of the art, provides an artificial intelligence-based solar module diagnosis method and system that uses thermal images taken with a drone. By utilizing the thermal images of solar modules captured by the drone, it enables objective, rapid diagnosis of solar modules by performing malfunction and degradation analysis based on artificial intelligence, predicting outputs and determining degrees.
[0010] The invention subject to the application numbered "WO2019144317", which is in the state of the art, relates to systems for detecting a fault in a solar panel. The detection process may involve one or more unmanned aerial vehicles (UAVs) with cameras configured to capture images of the solar panel at different times. A cloud computing system can retrieve images from the UAV and determine a score based on each image. The cloud computing system can use pattern matching and machine learning to identify a malfunction based on temperature and / or color inconsistencies in images.
[0011] It is seen that the documents in the known state of the art use different technologies, methods and systems such as UAVs, drones and satellites used in photovoltaic energy generation complexes; offer various innovative solutions for improving the monitoring, fault detection, maintenance and diagnostic processes of solar energy facilities and obtain method, system and method-system patents in these solutions; drone technology and images taken from UAVs have made significant contributions to the photovoltaic energy sector by enabling effective monitoring of solar power plants and rapid detection and resolution of problems; and the images taken are transferred to central servers for analysis, they are analyzed manually or by expert personnel within possible solutions, that they require expert intensive studies, that they mostly use thermal images to detect faults in PV panels and determine them either sequentially or panel-based, that thermal and rgb images are matched, that they generally perform fault testing from thermal maps and determine the location of faulty panels from there.
[0012] Although there are some solutions in the literature, there is a need for a system that can reduce the number of errors, increase the quality of service, and prevent losses in production by detecting errors faster with the outputs of normal and thermal data for error detection with drone images and efficiency criteria in panels. In addition, analyzes are performed using two-dimensional orthophoto images in state of the art systems. These two-dimensional images cannot realistically reflect panel slopes, heights and land structure. For this reason, it is important to develop a system that is developed as a fully automated system based on cloud technology, that detects defective panels and faulty cells on a panel basis by matching thermal and RGB images taken from UAVs, that utilizes deep learning, image processing and machine learning techniques to increase performance and achieve full automation where necessary, that converts two-dimensional images into three-dimensional models and runs a solar simulation and navigation system on these three-dimensional images to increase the energy generation efficiency and operational efficiency of solar power plants and improve the speed and safety of field teams.
[0013] Traditional PV panel inspection systems are generally manual processes, and in these processes it is common to create orthophotos using images taken with a drone. The condition of the panels is analyzed based on the resulting images. However, these processes are time consuming and subject to various limitations. Manual inspection methods may be insufficient, especially in PV power plants spread over large areas. Additionally, the orthophoto creation process may produce erroneous results due to in-flight problems or limitations of the software used.
[0014] As a result, due to the abovementioned disadvantages and the insufficiency of the current solutions regarding the subject matter, a development is required to be made in the relevant technical field.
[0015] Brief Description and Objects of the Invention
[0016] The invention relates to the detection of the defect in photovoltaic panels on a panel cell basis by thermal inspection from unmanned aerial vehicle images with artificial intelligence technology, performing temperature measurement, model conversion of images from two dimensions to three dimensions, real-time solar simulation and field navigation analysis.
[0017] The most important object of the present invention is to enable efficiency calculations to be made with the differences in kW value produced by the anomaly types detected on the panel and potential shading areas, radiation deficiencies and atmospheric effects.
[0018] Another object of the present invention is to enable the detection of defective panels and faulty cells on a panel basis by matching thermal and RGB images taken from drones.
[0019] Another object of the present invention is to provide accurate and safe calculation of the shortest route by vehicle or pedestrian, based on the positions of the panels, land structure and potential obstacles through the three-dimensional (3D) field model.
[0020] Another object of the present invention is to provide a better understanding of panel error sources, classify error types, and increase panel efficiency with the developed system of thermographic inspection using printouts from aerial photographs. In this way, production loss can be minimized and financial losses can be eliminated.
[0021] Another object of the present invention is to develop a fully automatic web service and desktop application based on cloud technology. It is fully autonomous and makes it possible to report errors and malfunctions in PV panels, allowing operating costs to be significantly reduced and thus companies to achieve greater energy efficiency.
[0022] Another object of the present invention is to enable the use of deep learning and machine learning techniques to increase performance and provide full automation. By using artificial intelligence algorithms, the performance of PV panels is analyzed to detect errors, malfunctions and anomalies.
[0023] Another object of the present invention is to enable customers to remotely access the system from any location, to access the system securely and quickly, to support different media, and to provide users or customers with a reliable and data- respecting approach.
[0024] In one embodiment of this invention, it analyzes the condition of PV panels directly through images obtained from drone flights, eliminating the need to create orthophotos. The objects of the invention include quickly detecting possible errors in the panels, classifying these errors and presenting the results to the user instantly. In this way, maintenance processes of PV power plants are optimized and energy efficiency is increased.
[0025] Description of the Figures
[0026] Figure-1 ; is a drawing that gives a schematic view of the system subject to the invention.
[0027] Figure-2; is a drawing that provides a schematic view of the workflow of collecting data from solar power plants.
[0028] Figure-3; is a drawing that displays the workflow of creating an orthophoto.
[0029] Figure-4; is a drawing that displays the workflow of creating a 3D field model.
[0030] Figure-5; is a drawing that displays the workflow of creating panel polygon networks.
[0031] Figure-6; is a drawing that displays the workflow of anomaly detection.
[0032] Figure-7; is a drawing that shows the workflow of temperature measurement.
[0033] Figure-8; is a drawing that shows the workflow of solar simulation.
[0034] Figure-9; is a drawing that displays the workflow of navigation analysis.
[0035] Figure-10; is a drawing that displays the workflow of field performance and productivity analysis.
[0036] Figure-11 ; is a drawing that displays the workflow of generating an analysis report.
[0037] Figure-12; is a drawing that gives a schematic view of the workflow of the system subject to the invention.
[0038] Reference Numbers
[0039] 110. Database
[0040] 120. Application
[0041] 130. Server 10000. Collecting data from solar power plants
[0042] 20000. Creating orthophoto
[0043] 30000. Creating 3D field model
[0044] 40000. Creating panel polygon networks
[0045] 50000. Completing anomaly detection
[0046] 60000. Performing temperature measurement
[0047] 70000. Making solar simulation
[0048] 80000. Performing navigation analysis
[0049] 90000. Conducting field performance and efficiency analysis
[0050] 100000. Issuing the analysis report
[0051] 200. Starting data collection of solar power plants
[0052] 201 . Unmanned aerial vehicle with thermal and RGB cameras
[0053] 202. Drone Operator
[0054] 203. GNSS Device
[0055] 204. Producing Thermal and RGB Photographs
[0056] 205. Placing Thermal Photo into a Folder
[0057] 206: Placing RGB Photos into a Folder
[0058] 207. Completing Data Collection
[0059] 300. Starting orthophoto creation
[0060] 301 . Images with Thermal JPEG I RJPEG I RAW I TIF I FLIR extensions
[0061] 302. Collecting field-related data from EXIF data of images 500. Starting the creation of panel polygon networks
[0062] 501 . 2D thermal orthophoto
[0063] 502. Separation of Floor and Panels
[0064] 503. Determining the Corner Coordinates of Panels
[0065] 504. Determining Each Panel in Boxes
[0066] 505. Uploading metadata for each panel
[0067] 506. Creating Polygon Networks
[0068] 507. 2D RGB Orthophoto
[0069] 508. Separating floors and panels using image processing techniques, deep learning techniques and Al
[0070] 509. Determining the Corner Coordinates of Panels
[0071] 510. Determining Each Panel in Boxes
[0072] 511 . Uploading metadata for each panel
[0073] 512. Creating Polygon Networks
[0074] 513. Generating electrical infrastructure map
[0075] 514. Getting output from KML / .KMZ / .SHP formats
[0076] 515. Getting output from KML / .KMZ / .SHP formats
[0077] 516. Creating panel polygon networks
[0078] 600. Starting anomaly detection
[0079] 601 . Thermal Orthophoto
[0080] 602. Creating Data Set
[0081] 603. Enriching Data Set with Al Techniques 604. Training with the model
[0082] 605. Detecting Anomaly Panels with Al Techniques
[0083] 606. RGB Orthophoto
[0084] 607. Creating Data Set
[0085] 608. Enriching Data Set with Al Techniques
[0086] 609. Training with the model
[0087] 610. Detecting Anomaly Panels with Al Techniques
[0088] 611 . Completing anomaly detection
[0089] 700. Starting the temperature measurement
[0090] 701 . Thermal JPEG I RJPEG I PJWN I TIF I FLIR images taken from the UAV
[0091] 702. Temperature reflected from the panel surface, distance to the object (flight altitude), perceived air temperature, air temperature, humidity parameters
[0092] 703. Receiving XY Pixel coordinate information
[0093] 704. Adding temperature measurement information to XY values
[0094] 705. Calculating pixel-based delta T temperature values of PV panels determined by .KML
[0095] 706. Conducting Priority classification of panels where anomalies are detected
[0096] 707. Obtaining temperature and Delta T values for each panel
[0097] 708. Completing the Temperature Measurement Process,
[0098] 800. Starting the solar simulation
[0099] 801. Collecting relevant power plant coordinates and processing them together with atmospheric information 802. Calculating the sun's azimuth and zenith angle values based on date and time information
[0100] 803. Simulating solar radiation by integrating the power plant location with DSM and DEM data
[0101] 804. Calculating the shading analysis, panel slope and panel alignment in accordance with DSM data
[0102] 805. Determining potential shading areas according to solar radiation data at different time and date intervals of the power plant location
[0103] 806. Calculating the radiation falling on solar panel surfaces according to azimuth and zenith angles and detecting shadow projections
[0104] 807. Completing the solar simulation and integrating its outputs into the 2D and 3D field model
[0105] 900. Starting the navigation analysis
[0106] 901 . 2D RGB Orthophoto
[0107] 902. Creating the Digital Surface Model
[0108] 903. Creating the Slope Map
[0109] 904. Classifying the elevation values (Elevation zoning)
[0110] 905. Performing color and texture analysis for floor material and surface elements
[0111] 906. Identifying the road networks
[0112] 907. Completing the anomaly detection
[0113] 908. Performing the network analysis
[0114] 909. Visualizing on 3D model
[0115] 910. Completing Navigation Analysis
[0116] 1000. Starting of field performance and efficiency analysis 1001 . Anomaly Panels
[0117] 1002. Temperature measurement values in raw drone thermal image
[0118] 1003. kWh sales price of electricity production
[0119] 1004. Energy generation and total radiation analysis in kWh
[0120] 1005. Production analysis report obtained from the active energy generation of the field
[0121] 1006. Maximum energy analysis report produced when optimum conditions in the field are met
[0122] 1007. Completing field performance and efficiency analysis
[0123] 1100. Starting the analysis report
[0124] 1101. Field information
[0125] 1102. Thermal Orthophoto
[0126] 1103. Anomaly map polygon network with .KML extension
[0127] 1104. RGB Orthophoto
[0128] 1103. Anomaly map polygon network with .KML extension
[0129] 1106. Electrical Infrastructure Map
[0130] 1107. Prioritizing the anomalies according to delta t (temperature) values in the panels
[0131] 1108. Determining LOW -MEDIUM -HIGH priorities
[0132] 1109. Conducting field performance and efficiency analysis
[0133] 1110. Completing the Analysis Report Description of the Invention
[0134] The present invention relates to the detection of the defect in photovoltaic panels on a panel cell basis by thermal inspection (thermographic inspection) from unmanned aerial vehicle images with artificial intelligence technology, model conversion of images from two dimensions to three dimensions, real-time solar simulation and field navigation analysis.
[0135] The artificial intelligence-supported solar power plant photovoltaic panel inspection system and its method are compatible with all panel types produced in the world.
[0136] With its thermal and RGB camera, the unmanned aerial vehicle (UAV) collects RGB and thermal images in SPP (Solar Power Plant) power plants where thermographic inspection will be carried out in accordance with IEC World Standards. Normal and thermal data of solar panels are collected through UAV flights.
[0137] The database (110) enables recording of RGB and thermal images. The database (110) is protected by end-to-end encryption using strong encryption algorithms, such as AES-256, to ensure that data is not shared internally and to eliminate vulnerabilities in its security. The security of data during storage is increased with hardware-based security measures and data integrity is maintained with regular backup processes. The database (110) stores the polygon networks and orthophoto data with .kml extension generated by the server.
[0138] The application (120) is executed on an electronic device such as a mobile device, tablet, or computer, allowing users to view and manage information about the panels. The application (120) ensures that users' data is transmitted securely to the server by encrypting it at the application level. Secure authentication and encryption methods are used to transfer the images collected by the UAV to the database (110). Using this interface, users enable the images collected by the IHA to be uploaded to the application (120). The application (120) can operate as a web service or locally. The application (120) comprises an interface where users can take a photo of the photovoltaic panel serial number and ensure that the panel serial numbers are recorded. Application (120) provides the user with the thermal RGB images of the panels, as well as the coordinates, temperature and serial numbers of the electrical infrastructure elements (inverter, transformer, etc.). The server (130) provides an interface for calculating the shortest route by vehicle or pedestrian based on the positions of the panels, terrain structure and potential obstacles through the three- dimensional field model.
[0139] The server is in communication with the application (120) and the database (110). The server converts thermal and RGB images uploaded to the cloud in JPEG format into orthophotos using image processing techniques. With the artificial intelligence algorithms running on it, the server converts the distortions and deformations experienced in the camera into orthophotos to eliminate the problems experienced in different field conditions in order to make accurate analysis from RGB and thermal images. In order to analyze each panel, the server segments RGB images into panels with deep learning algorithms and creates a .kml (representation of panels as boxes) polygon network. With the Al layer running on the server, the server reaches each pixel in that panel by drawing KML on each panel and reaches the earth coordinate information and temperature values of the pixels. The server creates polygon networks with the panel model introduced into the system by using deep learning algorithms to distinguish and analyze the panels in the produced RGB and thermal orthophotos, using the coordinates at the panel corner points as reference. The electrical infrastructure map is created with kml. Like the project file, all electrical elements in the field are shown geographically. When a faulty panel is detected, it can reach the nearest transformer or electrical infrastructure element to which it is connected.
[0140] The server sends the KML mapping and orthophoto images to the database (110) for storage.
[0141] The server measures the temperature data obtained from thermal images on a pixel basis for each panel and performs minimum, maximum and delta t calculations. After analyzing the temperature data with the algorithms created with the calibration temperature library given certain parameter values, anomaly detection is made with deep learning algorithms depending on the temperature difference in the panel. The server uses architectures of deep learning models to reveal the types of anomalies detected from thermal data. However, in order to get accurate results for some types of anomalies, Thermal and RGB images are used independently in thermal images to detect different types of anomalies. While malfunctions in the panel based on temperature differences are detected in thermal images, physical problems such as deteriorations, fractures, cracks, contamination and shadowing in the panel can be determined through RGB images. Both image types enable the detection of different anomalies on the panel, increasing the automaticity and accuracy of the process. Temperature differences in thermal images detect thermal anomalies such as hotspot formation, overheating or cooling that can affect the efficiency of the panel, while RGB images are used to identify physical deformations, cracks, fractures, shading and contamination. Both types of images are analyzed autonomously, providing a comprehensive overview of the overall health of the panel.
[0142] The server calculates efficiency with the differences in kW value produced by the anomaly types detected on the panel. The server presents in the report a framed visual of the panels in box form on a panel basis, which facilitates the location of PV panels with anomaly detected using polygon networks with .KML extension (box form of panels). In addition to the thermal I RGB images of the panels, the outputs obtained from all data including coordinates, temperature and serial numbers are analyzed and the report with work orders for the maintenance and repair processes of all panels with anomalies detected in the application (120) report output together with representations such as pie chart histograms are presented to the user via the application (120).
[0143] The server uses image processing algorithms on the photovoltaic panel serial number image taken by users through the application (120), converts it into text format and ensures that it is recorded for the relevant panel. Letters and numbers at different levels in the image are added to the info information of the relevant faulty panel in the technical report as text in the output. In this way, it helps in the maintenance and repair processes of the existing faulty panel.
[0144] The server converts the images converted into two-dimensional (2D) orthophoto into three-dimensional (3D) field model images by creating a point cloud and mesh model. In this way, panel slopes, heights and field structure are represented realistically. It is of great importance to simulate the sun's position, irradiance and radiation values, shading and atmospheric conditions, which are among the parameters that affect panel efficiency. For this reason, the server calculates the azimuth and zenith angles of the sun based on the 3D field model images created from 2D orthophotos, the coordinates where the power plant is located and the date information. These angle values are used to simulate the position of the sun, and potential shading projections and irradiance deficiencies are determined in detail. At the same time, by integrating with DSM (Digital Surface Model) and DEM (Digital Elevation Model) data, the effect of solar radiation on the panels is simulated, taking into account the structure of the field and the slope of the panels. This provides the opportunity to make strategic plans to minimize losses in panel efficiency. In addition, by correctly calibrating the parameters (e.g. humidity, radiation, felt and reflected air temperature) to be used in anomaly detection and temperature measurement, the measured temperature data can be processed with higher accuracy.
[0145] To ensure that field teams reach faulty panels in the shortest and safest way, the server creates elevation zoning and slope maps over the three-dimensional site model to safely and accurately calculate the shortest route by vehicle or on foot based on the location of the panels, filed structure and potential obstacles. It saves time for field teams and minimizes potential risks, especially in large areas.
[0146] While commissioning the SPP sites, geotechnical changes can be determined by comparing the current orthophoto image of the land obtained as a result of the thermographic inspection and analysis carried out within the scope of periodic maintenance activities with the drone by using Autocad drawings (dwg) of the technical project file regarding the pv panel placement and electrical infrastructure of the power plant. Problems arising from changes in the angle of the panels and settlements due to geotechnical changes in the terrain, such as sliding and subsidence, are analyzed by simulating the detected changes in current 3D field models, apart from the anomalies reflected in the current images obtained, the 3D Field Model and Solar Simulation gives the user the ability to analyze the field before and after different dates and times to create accurate data for efficiency calculations according to solar radiation.
[0147] In determining temperature values in PV panels; measurements are carried out with thermal cameras placed on unmanned aerial vehicles and from which temperature measurement values can be taken. Thermographic cameras detect electromagnetic radiation in the infrared portion of the electromagnetic spectrum (roughly 900-14000 nanometers) and create images from this radiation. Infrared radiation is released from PV panels according to their temperature. (Radiation is the heat movement that occurs when radiated energy (electromagnetic waves) moves without a direct transmission medium.) The spectrum and amount of thermal radiation strongly depend on the surface temperature of the object. This makes it possible for a thermal camera to image the surface temperature of an object. The amount of radiation released from the surface of PV panels increases as the temperature increases, so thermography enables the differences in temperature to be seen. Thermal cameras used have a certain temperature range in which they can create images. Since there are different IR emissions at each temperature value and each IR emission has a different wavelength, these lenses can provide images in certain temperature ranges. The lenses used in thermal cameras are capable of capturing very small temperature differences (such as 0.01 °C) and creating images from this difference. During the thermographic measurement process, temperature data on PV panels are taken in two different formats. Photos in JPEG format are used for visual purposes, while exact data about temperature is recorded in RAW format. The RAW format provides the most accurate temperature measurements by correcting for environmental factors, ensuring that data is stored without compression and loss. In this process, temperature measurements of each pixel are taken from the data in RAW format and temperature differences are determined by calibrating environmental parameters (emissivity, distance, reflection and humidity). This data is then analyzed in the system to detect anomalies and errors that may occur on the panel in the most accurate way.
[0148] Certain parameters are needed for temperature measurements. Various environmental factors must be taken into account in order to accurately determine the temperature values on the surface of PV panels. Factors such as the area where the panel is located, the angle of solar radiation it receives, emissivity (heat dissipation capacity of the surface), distance, reflection and humidity directly affect the temperature measurement results. The emissivity of each panel can be different and usually varies between 0 and 1 . The higher the emissivity value, the more heat the panel emits and an accurate measurement is achieved. Since distance is the distance between the UAV and the panel, this factor must be corrected for accurate detection of thermal energy. Measurements made with a drone are generally carried out from a distance of 25-30 meters. Reflection can reflect thermal energy back from glass surfaces, which affects the measurement results. Additionally, humidity can negatively affect the dissipation of high levels of thermal energy. Therefore, all these environmental parameters should be automatically corrected by the system when making temperature measurements and the results should be calibrated according to environmental factors. In the cells in the PV panels we examined; the efficiency decrease for monocrystalline (c-Si) and polycrystalline (pc-Si) silicon solar cells is approximately 0,45% for each degree of temperature increase. For amorphous silicon solar cells, this effect is lower, approximately 0,25% per degree. For this reason, 4 main parametric values of temperature should be taken for accurate results for temperature measurement values.
[0149] Temperature data is captured directly in RAW format, because the RAW format allows the data to be stored in its original form without compression or loss of quality. JPEG format is used only for displaying data for visual purposes. This means more color information, greater tonal range and higher resolution. This provides greater editing flexibility. Precise and high resolution color and tone values in thermal images enable high precision solutions. JPEG files are used for visual evaluation only and color and tone settings are made automatically by the camera. Temperature measurements are obtained in RAW format to avoid being affected by such restrictions. More details in thermal images captured with high contrast can be preserved. This makes it easier to capture detail in both bright and shadow areas within the same frame. The RAW format, on the other hand, provides a better basis for further editing and quality preservation going forward. JPEG files may lose quality when used for visual purposes only. Temperature data is recorded in RAW format and stored unedited. High quality outputs are given in the next analysis in the system. Temperature values are recorded in RAW format as txt for each pixel. Raw files are read as text and the temperature values in the Raw files are introduced to the system in text format. After reading the RAW file containing the temperature information of the images, it is checked whether there is any distortion or unusual value in the raw drone image.
[0150] Since the temperature values obtained from the RAW format will be measured per pixel in thermal images, the X and Y (horizontal - vertical axis) coordinate values of each pixel are defined in the system. The first step is to set the upper left corner of the photo as the starting point. This point is the zero point of the X and Y pixel coordinates. The x pixel coordinates increase from the starting point to the right edge of the photo. The coordinate of the left edge is usually 0, and the coordinate of the right edge varies depending on the width of the photo. The Y pixel coordinates increase from the starting point to the bottom edge of the photo. The coordinate of the top edge is usually 0, and the coordinate of the bottom edge varies depending on the height of the photo. Coordinate values can be defined according to the total pixels in the thermal drone image examined. In this way, the horizontal and vertical locations of each pixel value are determined. Since the system will provide the most accurate location information by detecting anomaly from the temperature differences of the coordinate values of the pixels, it allows anomaly detection directly on a cell basis.
[0151] After the coordinate values obtained for the pixels are obtained in the most accurate position in the unprocessed drone image, the photograph and its location on the earth are determined. The temperature values of the pixels located in the image, the parameters that affect the temperature and guide the measurement process, and the temperature per pixel are measured. In the output file, the images with the temperature information processed into the image are saved and the temperature values obtained by the temperature measurement process are stored. In this way, the original photographs are also preserved.
[0152] Figure 2 shows the diagram showing the workflow of collecting data from solar power plants (10000);
[0153] - Start of data collection of solar power plants (200)
[0154] - Unmanned aerial vehicle with thermal and RGB cameras (201 ),
[0155] - Drone Operator (202)
[0156] - GNSS (Global Navigation Satellite Systems) Device (203),
[0157] - Generating the Thermal and RGB Photographs (204),
[0158] - Placing the Thermal Photo into a Folder (205)
[0159] - Placing the RGB Photos into a Folder (206) - Completing Data Collection (207).
[0160] Figure 3 shows the diagram showing the workflow of creating orthophoto (20000);
[0161] - Starting the orthophoto creation (300),
[0162] - Images with Thermal JPEG I RJPEG I RAW I TIF I FLIR extensions (301 ),
[0163] - Collecting field-related data from EXIF data of images (302),
[0164] - Eliminating distortions occurring in the field (303),
[0165] - Creating thermal orthophoto (304),
[0166] - Images with RGB JPEG I RJPEG I PJWN I TIF I FLIR extensions (305),
[0167] - Collecting field-related data from EXIF data of images (306),
[0168] - Eliminating distortions occurring in the field (307),
[0169] - Creating the RGB orthophoto (308),
[0170] - Completing the orthophoto creation process (309).
[0171] Figure 4 shows the diagram showing the workflow of creating the 3D field model (30000);
[0172] - Starting 3D field model creation (400),
[0173] - 2D Thermal Orthophoto Data (401 ),
[0174] - Adding Elevation Data (402),
[0175] - Creating Point Clouds (403),
[0176] - Creating DEM and DSM Data (404),
[0177] - Performing texture mapping (405),
[0178] - 3D Thermal Field Model (406),
[0179] - 2D RGB Orthophoto Data (407), - Adding Elevation Data (408),
[0180] - Creating Point Clouds (409),
[0181] - Creating DEM and DSM Data (410),
[0182] - Performing texture mapping (411 ),
[0183] - 3D RGB Field Model (412),
[0184] - Creating 3D field model (413),
[0185] Figure 5 shows the diagram showing the workflow of creating panel polygon networks (40000);
[0186] - Starting the creation of panel polygon networks (500),
[0187] - 2D Thermal Orthophoto (501 ),
[0188] - Separating floors and panels using image processing techniques, deep learning techniques and Al (502),
[0189] - Determining the Corner Coordinates of Panels (503),
[0190] - Determining Each Panel in Boxes (504),
[0191] - Uploading metadata for each panel (505),
[0192] - Creating polygon networks (506),
[0193] - 2D RGB Orthophoto (507)
[0194] - Separating floors and panels using image processing techniques, deep learning techniques and Al (508),
[0195] - Determining the Corner Coordinates of Panels (509),
[0196] - Determining Each Panel in Boxes (510), - Uploading metadata for each panel (511 ),
[0197] - Creating polygon networks (512),
[0198] - Generating maps of electrical infrastructure elements (513),
[0199] - Getting output from KML / .KMZ / .SHP formats (514),
[0200] - Getting output from KML / .KMZ / .SHP formats (515),
[0201] - Creating panel polygon networks (516).
[0202] Figure 6 shows the diagram showing the workflow of conducting anomaly detection (50000);
[0203] - Starting the anomaly detection (600),
[0204] - Thermal Orthophoto (601),
[0205] - Creating Data Set (602),
[0206] - Enriching Data Set with Al Techniques (603),
[0207] - Training with the model (604),
[0208] - Detecting the anomaly panels with Al techniques (605),
[0209] - RGB Orthophoto (606),
[0210] - Creating Data Set (607),
[0211] - Enriching Data Set with Al Techniques (608),
[0212] - Training with the model (609),
[0213] - Detecting the anomaly panels with Al techniques (610),
[0214] - Completing the anomaly detection (611 ). Figure 7 shows the diagram showing the workflow of conducting the temperature measurement (60000);
[0215] - Starting the temperature measurement (700),
[0216] - Thermal JPEG I RJPEG I PJWN I TIF I FLIR images taken from the UAV (701 ),
[0217] - Temperature reflected from the panel surface, distance to the object (flight altitude), perceived air temperature, air temperature, humidity parameters (702),
[0218] - Receiving XY Pixel Coordinate Information (703),
[0219] - Adding temperature measurement information to XY values (704),
[0220] - Calculating pixel-based delta T temperature values of PV panels determined by .KML (705),
[0221] - Conducting the priority classification of panels where anomalies are detected (706),
[0222] - Obtaining temperature and Delta T values for each panel (707),
[0223] - Completing the Temperature Measurement Process (708),
[0224] Figure 8 shows the diagram showing the workflow of conducting the solar simulation process (70000);
[0225] - Starting the solar simulation (800),
[0226] - Collecting relevant power plant coordinates and processing them together with atmospheric information (801 ),
[0227] - Calculating the sun's azimuth and zenith angle values based on date and time information (802),
[0228] - Simulating the solar radiation by integrating the power plant location with DSM and DEM data (803), - Calculating the shading analysis, panel slope and panel alignment in accordance with DSM data (804),
[0229] - Determining potential shading areas according to solar radiation data at different time and date intervals of the power plant location (805),
[0230] - Calculating the radiation falling on solar panel surfaces according to azimuth and zenith angles and detecting shadow projections (806),
[0231] - Completing the solar simulation and integrating its outputs into the 2D and 3D field model (807).
[0232] Figure 9 shows the diagram showing the workflow of conducting the navigation analysis (80000);
[0233] - Starting the navigation analysis (900),
[0234] - 2D RGB Orthophoto (901 ),
[0235] - Creating the Digital Surface Model (902),
[0236] - Creating the Slope Map (903),
[0237] - Classifying the elevation values (Elevation zoning) (904),
[0238] - Performing colour and texture analysis for floor material and surface elements (905),
[0239] - Identifying the road networks (906),
[0240] - Completing the anomaly detection (907);
[0241] - Performing the network analysis (908),
[0242] - Visualizing on 3D model (909),
[0243] - Completing Navigation Analysis (910).
[0244] Figure 10 shows the diagram showing the workflow of conducting the field performance and productivity analysis (90000); Starting the field performance and efficiency analysis (1000);
[0245] Anomaly Panels (1001 ),
[0246] - Temperature measurement values in raw drone thermal image (1002),
[0247] - kWh sales price of electricity production (1003),
[0248] - Energy generation and total radiation analysis in kWh (1004),
[0249] - Analysis report on the effect of anomalies detected according to the active energy generation of the field on production (1005),
[0250] - Maximum energy analysis report produced when optimum conditions in the field are met (1006),
[0251] - Completing the field performance and efficiency analysis (1007).
[0252] Figure 11 shows the diagram showing the workflow of generating analysis reports (100000);
[0253] - Starting the analysis report (1100)
[0254] - Field Information (1101 )
[0255] - Thermal Orthophoto (1102)
[0256] - Anomaly map polygon network with .KML extension (1103)
[0257] - RGB Orthophoto (1104)
[0258] - Anomaly map polygon network with .KML extension (1105)
[0259] - Electrical Infrastructure Map (1106)
[0260] - Prioritizing the anomalies according to delta t (temperature) values in the panels (1107),
[0261] - Determining LOW -MEDIUM -HIGH priorities (1108), - Conducting field performance and efficiency analysis (1109),
[0262] - Completing the analysis report (1110),
[0263] Figure 12 shows the diagram showing the workflow of generating analysis reports;
[0264] - Collecting data from solar power plants (10000)
[0265] - Creating orthophoto (20000)
[0266] - Creating 3D field model (30000)
[0267] - Creating the panel polygon networks (40000)
[0268] - Completing the anomaly detection (50000)
[0269] - Performing the temperature measurement process (60000)
[0270] - Making solar simulation (70000)
[0271] - Performing navigation analysis (80000)
[0272] - Conducting field performance and efficiency analysis (90000)
[0273] - Issuing the analysis report (100000)
[0274] The working method of the artificial intelligence-supported solar power plant photovoltaic panel inspection system comprises the following process steps;
[0275] - Collecting RGB and thermal images from solar power plants that will be subjected to thermographic inspection by the UAV thermal and RGB camera,
[0276] - Transmitting the thermal and RGB images collected by the UAV to the database (110) via the application (120) and storing the images on cloud storage,
[0277] - Converting thermal and RGB images to orthophoto via the server (130) to remove distortions and deformations experienced in the camera by using image processing methods, - Creating a point cloud and mesh model from the images converted to orthophoto by the server (130) and converting them into a three-dimensional field model,
[0278] - Making anomaly map outputs by creating polygon networks in . format by segmenting RGB and thermal orthophotos into panels with deep learning algorithms, the server (130) to reach each pixel in the panel and access the pixels' earth coordinate information and temperature values,
[0279] - Performing temperature measurements on a pixel basis for each panel in the temperature data obtained from the thermal images collected by the IHA by the server (130),
[0280] - Making classification by the server (130) according to the determined value ranges after the temperature measurement process is carried out,
[0281] - Determining error types and hot spots by examining the thermal and RGB images of solar PV panels with artificial intelligence models by the server (130),
[0282] - Detecting the potential shading zones, radiation deficiencies and atmospheric effects by simulating the position and irradiance of the sun according to the date and time entered by the user through the application (120) on the field model created by the server (130) from three-dimensional images,
[0283] - Making efficiency calculations by the server (130) with the differences in kW value produced by the anomaly types detected on the panel, potential shading areas, radiation deficiencies and atmospheric effects and presenting to the user through the application (120),
[0284] - Displaying the error type, temperature information and panel location information detected by the server (130) to the user via the application (120),
[0285] - Calculating the shortest route by vehicle or pedestrian by the server (130) based on the positions of the panels, terrain structure and potential obstacles over the three-dimensional field model, - Providing an interface through the application (120) where the user can receive driving or pedestrian directions to the panel location on the land he / she wants to go to.
[0286] In the process step of determining error types and hot spots by examining the thermal and RGB images of solar photovoltaic panels with artificial intelligence models by the Server (130), the error types are as follows; diode, cell, module, string, junction box, shadowing, contamination, broken / crack, vegetation and hot spot faults.
[0287] In the process step of classification according to the value ranges determined by the server (130) after the temperature measurement process is performed, the temperature status assignments are classified as medium high low according to the world standard temperature measurement values.
[0288] The temperature measurement process performed by the server (130) is completed with the classification process, taking into account certain temperature ranges, in line with the instructions of IEC 62446. Thermal data is classified into "low", "medium" and "high" temperature levels according to world-class temperature ranges by analysing the surface temperatures of the panels. This classification provides important information about the health of solar panels, as situations such as overheating (hotspot) can lead to serious losses in PV panel performance and greater malfunctions.
[0289] According to IEC 62446 standards, errors of different severities are classified into certain categories in error detection based on temperature measurements. Low severity errors usually involve slight temperature differences observed on the panel surface, and although they do not cause performance losses in the short term, they are anomalies that need to be taken into consideration in the long term. Moderate errors refer to situations where thermal differences become evident and may cause partial power loss in the panels. Such errors can often occur due to localized overheating or shadowing. High-severity errors involve significant temperature differences and mean that a significant part of the panel does not work or is completely disabled. These errors represent malfunctions that require immediate attention and can lead to complete panel malfunction as well as loss of efficiency in the system. The process step of measuring the temperature on a pixel basis for each panel in the temperature data obtained from the thermal images collected by the UAV by the server (130) comprises the following process steps;
[0290] - Obtaining temperature measurement parameters such as distance, surface reflection, reflection and humidity information from thermal UAV images,
[0291] - Obtaining temperature information for each pixel of the panels in the images from raw UAV images,
[0292] - Recording temperature data in images to the coordinates of each pixel
[0293] In one embodiment of the invention, it is aimed to increase the efficiency of photovoltaic (PV) panels and reduce maintenance costs, and for this purpose, analysis is made on images obtained by artificial intelligence-supported autonomous UAV flights. The invention offers an innovative approach to quickly and accurately examine PV panels, detect anomalies and visually present this information to the user. With this structuring, the invention provides unique speed and accuracy in the maintenance and monitoring processes of PV power plants. Digital twin technology, which eliminates the need for orthophotos, offers fast data analysis and anomaly detection. The system provides highly reliable results even for power plants in large areas and minimizes the margin of error. Furthermore, with its dynamic and user- friendly visualization features, users can easily monitor the power plant status and quickly plan the necessary interventions. This innovative approach increases the energy efficiency of PV plants and reduces maintenance costs. Thus, it makes a significant contribution to the energy generation sector. In this embodiment of the invention, an unmanned aerial vehicle, server, database and interface are used. In order to perform autonomous UAV flight and image collection, a GPS-based autonomous unmanned aerial vehicle (UAV) takes high-resolution photographs at regular intervals with a camera on board, covering the entire plant area. The photos taken are then transmitted to the server (130). The server (130) analyses using advanced image processing algorithms and artificial intelligence techniques and determines the types and severity of errors in each detected panel. The server (130) analyses and determines the energy generation performance of PV panels according to various environmental factors. In addition, the server (130) updates its algorithms and models in line with user feedback and new data via the interface. The server (130) simulates the effects of the positioning and slope angles of the panels on solar radiation. These simulations take into account the effects of environmental factors such as different weather conditions, dust, humidity, etc., and thus determine the optimal placement and maintenance strategies of the panels. Machine learning algorithms running on the server constantly analyse data to increase the accuracy and efficiency of the system. In this way, the system becomes smarter and more precise over time. The server (130) performs analysis of PV panels using image processing algorithms and artificial intelligence. This process begins through an artificial intelligence system that is trained primarily with Convolutional Neural Network (CNN) models. While CNN models are used to measure and evaluate the temperatures of panels detected through original and raw thermal images, CNNbased algorithms detect errors in the panels with visual analysis in RGB images. While this method reveals anomalies and potential malfunctions by determining temperature differences in thermal images, it detects errors by detecting surface defects, cracks or other visual distortions in RGB images. In this process, artificial intelligence constantly trains itself, obtains more precise results and improves its performance with each new analysis.
[0294] The server (130) comprehensively analyses factors such as environmental factors, atmospheric effects and pollution to calculate the energy generation performance of PV panels according to world standards. First, the surface temperatures and physical states of the panels are determined using thermal and RGB image processing algorithms. The data obtained is supported by artificial intelligence-based models and the effects of variables such as temperature, solar radiation, wind speed, humidity and air pollution on the energy generation of each panel are evaluated. Actual energy generation is calculated by comparing the production of each panel with STC (Standard Test Conditions) conditions; this includes ideal conditions such as a temperature of 25 °C, solar radiation of 1000 W / m2and humidity of 1 %. The performance ratio (PR) is obtained by calculating the ratio between actual energy generation and the energy expected to be generated under these ideal conditions. This ratio is expressed as follows: PR = Actual Energy Generation I Expected Energy Generation. This ratio takes a value between 0% and 100%, and the impact of external factors such as pollution or atmospheric conditions on this ratio is constantly updated by artificial intelligence algorithms. As a result, simulations are performed to optimize the positioning and slope angles of the panels, thus minimizing the impact of environmental conditions on energy generation and increasing the overall efficiency of the system. This process is supported by data mining and machine learning methods, increasing the accuracy of energy generation estimates and determining preventive maintenance requirements. Anomaly detections and panel conditions are visualized through a user-friendly interface. This interface may be in the application (120) or it may be an internet-based interface. The database (110) ensures that all collected data is stored and backed up securely. Data security is ensured by end-to- end encryption techniques. The database is protected against unauthorized access. The integrity of the data is maintained, and possible data loss is prevented with regular backups.
[0295] There is also a method for this embodiment. This method comprises the following process steps.
[0296] • Recording temperature data in images to the coordinates of each pixel,
[0297] • Collecting data from solar power plants during flight using sensors and cameras (10000), o Here the flight path is optimized to create a complete map of the PV plants. o The following process steps are applied here.
[0298] ■ Starting the data collection of solar power plants (200)
[0299] ■ Collecting data with Unmanned Aerial Vehicle (201 ) with thermal and RGB cameras,
[0300] ■ Drone Operator (202)
[0301] ■ GNSS Device (203)
[0302] ■ Producing Thermal and RGB Photographs (204),
[0303] ■ Placing the Thermal Photo into a Folder (205) ■ Placing the RGB Photos into a Folder (206)
[0304] ■ Completing Data Collection (207)
[0305] ■ Server (130) preferring the orthophoto method
[0306] • Server (130) processing the images coming from the UAV, o Here, the borders and corner points of the panels are determined. This process is carried out by deep learning models trained to recognize and classify objects in photographs. By segmenting the panels, the polygon network of each panel is created. This polygon network contains the exact location and dimensions of the panels.
[0307] • Server (130) detecting and classifying anomalies, o Here, artificial intelligence algorithms identify and classify various anomalies that may occur on the panels. For example, temperature differences, physical damage (cracks, fractures), contamination, shadowing and connection problems. Classifications are made according to the severity of anomalies and this information is recorded in the database (110) to be used in maintenance and repair planning.
[0308] • Server (130) visualizing and reporting the detected panel on the interface, o Here, on the switchboard map, the status of each detected panel is shown with color codes on the interface. Users can see detailed analysis of each panel by clicking on the map on the interface. All data is presented to the user by the server (130) in the form of graphs and reports and is saved in the database. Reports in the database (110) can be downloaded via the interface and shared with maintenance teams.
[0309] In the processing step where the server (130) prefers the orthophoto method, two processes can be used, where the method of the invention produces orthophotos and where it does not produce orthophotos. If the server (130) prefers the orthophoto method and orthophoto is produced in the process step;
[0310] - Generating and processing Orthophoto (20000), o The following process steps are applied here. o Starting the orthophoto creation (300) o Thermal JPEG / RJPEG / RAW / TIF / FLIR Images (301 ) o Collecting Information from EXIF Data (302) o Elimination of the Distortions (303) o Producing the Thermal Orthophoto (304) o RGB JPEG / RJPEG / RAW / TIF / FLIR Images (305) o Collecting Information from EXIF Data (306) o Eliminating the Distortions (307) o Producing RGB Orthophoto (308)
[0311] - Creating the 3D field model (30000), o The following process steps are applied here. o Starting 3D field model creation (400) o 2D Thermal Orthophoto Data (401 ) o Adding Elevation Data (402) o Creating Point Clouds (403) o Creating DEM and DSM Data (404) o Texture Mapping (405) o 3D Thermal Field Model (406) o 2D RGB Orthophoto Data (407) o Adding Elevation Data (408) o Creating Point Clouds (409) o 3B RGB Field Model (412)
[0312] - Creating polygon networks (40000), o The following process steps are applied here. o Starting the creating panel polygon networks (500) o 2D Thermal Orthophoto (501 ) o Separating floor and panels (502) o Determining Corner Coordinates of Panels (503) o Determining Each Panel in Boxes (504) o Uploading Metadata (505) o Creating the polygon networks (506), o 2D RGB Orthophoto (507) o Determining the Corner Coordinates (509) o Producing the Electrical Infrastructure Map (513)
[0313] - Conducting the Anomaly detection (50000), o The following process steps are applied here. o Starting the anomaly detection (600) o Taking Thermal Orthophoto (601 ) o Creating Data Set (602) o Enriching Data Set with Al Techniques (603), o Conducting Model Training (604), o Detecting the Anomaly Panels with Al Techniques (605) o RGB Orthophoto (606)
[0314] - Performing temperature measurement (60000), o The following process steps are applied here. o Starting the temperature measurement (700) o Taking Thermal Images (701 ) o Determining the Temperature Parameters (702) o Receiving XY Pixel Coordinate Information (703) o Adding Pixel Temperature Values (704) o Calculating Delta T Temperature Values (705) o Completing the Temperature Measurement Process (708),
[0315] - Making solar simulation (70000), o The following process steps are applied here. o Starting the solar simulation (800) o Collecting the Atmospheric Information (801 ) o Calculating the Sun Position (802) o Shadowing Analysis with DSM / DEM Data (803) o Calculating Irradiance (804) o Completing the Simulation (807) - Performing navigation analysis (80000), o The following process steps are applied here. o Starting the navigation analysis (900) o Using a Digital Twin o Creating a Digital Surface Model (902) o Creating a Slope Map (903) o Elevation Zoning (904) o Identifying the Road Networks (906) o Completing the Navigation Analysis (910)
[0316] - Conducting field performance and efficiency analysis (90000), o The following process steps are applied here. o Starting the field performance and efficiency analysis (1000) o Anomaly Panels (1001 ) o Taking Temperature Values (1002) in Thermal Image o Performing energy generation and Radiation Analysis (1004) o Completing the Performance and Efficiency Analysis (1007)
[0317] - Generating the analysis report (100000). o The following process steps are applied here. o Starting the analysis report (1100) o Obtaining Field Information (1101 ) o Taking Thermal Orthophoto (1102) o Creating Anomaly Map Polygon Network (1103) o Taking RGB Orthophoto (1104) o Creating the Electrical Infrastructure Map (1106) o Prioritizing the Anomalies (1107) o Completing the Analysis Report (1110)
[0318] If the server (130) prefers the orthophoto method and no orthophoto is produced in the process step;
[0319] - Inverting to real world coordinates, o The following process steps are applied here. o Separating floor and panels (502) o Processing of images begins. o Using EXIF and GNSS Data o GPS coordinates are read from the EXIF data of the collected images. o The coordinates of each pixel in the image on Earth are calculated. o The exact positions of the panels on the switchboard are determined. o Determining the Borders and Corner Points of Panels (503) o The boundaries of each panel are determined with image processing algorithms. o The corner points of each panel are determined using deep learning techniques. o The coordinates of each panel are mapped correctly. o Verifying Real World Coordinates o The accuracy of GNSS data is checked. o Synchronization is achieved between image data and GNSS data. o The exact locations of the panels on the earth are checked for accuracy.
[0320] - Creating polygon networks (40000), o The following process steps are applied here. o Starting the creation of panel polygon networks (500) o The process of creating panel polygons starts. o Polygon networks on Thermal and RGB Images (506) o The boundaries of each panel are determined on RGB and thermal images. o Using image processing techniques, the corner points and boundaries of each panel are detected. o A polygon is created for each panel from the specified corner points. o Determining Corner Coordinates of Panels (503) o The corner points of the panels are verified with deep learning and image processing algorithms. o Each corner point is associated with real-world coordinates. o Producing the Electrical Infrastructure Map (513) o Elements of the electrical infrastructure (inverters, transformers) are mapped. o These elements are associated with the panels and a map showing electrical connections is created. o All networks are stored in digital map format and converted to KML / SHP file formats.
[0321] - Creating a digital twin, o The following process steps are applied here. o Producing the Digital Twin Model o A digital field model is created using real-world coordinates and polygon networks. o RGB and thermal images are combined with this model. o The digital twin comprises all panels and electrical infrastructure elements on the power plant. o Adding a Digital Map of Panels and Elevation Data o The topographic structure of the land is represented in the digital model. o The slopes and height differences of the panels are visually reflected in the model. o Visual Analysis of Panels on Digital Twin o Panels are analyzed visually on the digital twin. o Anomalies, slopes and potential problems are visually marked on the digital twin. o Users receive information about the locations, performance and problems of the panels.
[0322] - Conducting the Anomaly detection (50000), o The following process steps are applied here. o Starting the anomaly detection (600) o Taking Thermal Orthophoto (601 ) o Creating Data Set (602) o Enriching Data Set with Al Techniques (603), o Conducting Model Training (604), o Detecting the Anomaly Panels with Al Techniques (605) o RGB Orthophoto (606)
[0323] - Performing temperature measurement (60000), o The following process steps are applied here. o Starting the temperature measurement (700) o Taking Thermal Images (701 ) o Determining the Temperature Parameters (702) o Receiving XY Pixel Coordinate Information (703) o Adding Pixel Temperature Values (704) o Calculating Delta T Temperature Values (705) o Completing the Temperature Measurement Process (708),
[0324] - Making solar simulation (70000), o The following process steps are applied here. o Starting the solar simulation (800) o Collecting the Atmospheric Information (801 ) o Calculating the Sun Position (802) o Shading Analysis with Digital Twin o Calculating Irradiance (804) o Completing the Simulation (807)
[0325] - Performing navigation analysis (80000), o The following process steps are applied here. o Starting the navigation analysis (900) o Using a Digital Twin o Creating a Digital Surface Model (902) o Creating a Slope Map (903) o Elevation Zoning (904) o Identifying the Road Networks (906) o Completing the Navigation Analysis (910)
[0326] - Conducting field performance and efficiency analysis (90000), o The following process steps are applied here. o Starting the field performance and efficiency analysis (1000) o Anomaly Panels (1001 ) o Temperature Values in Thermal Image (1002) o Energy Generation and Radiation Analysis (1004) o Completing the Performance and Efficiency Analysis (1007)
[0327] - Generating the analysis report (100000). o The following process steps are applied here. o Starting the analysis report (1100) o Obtaining Field Information (1101 ) o Taking Thermal Orthophoto (1102) o Creating Anomaly Map Polygon Network (1103) o Taking RGB Orthophoto (1104) o Creating the Electrical Infrastructure Map (1106) o Prioritizing the Anomalies (1107) o Completing the Analysis Report (1110)
[0328] In summary, the following operations are performed. a) Image Collection with UAV
[0329] • Unmanned Aerial Vehicle (UAV) collects high-resolution RGB and thermal images from the solar power plant in accordance with the flight plan covering the plant area.
[0330] • This image collection process, performed with thermal and RGB cameras on the UAV, is supported by the coordinate information recorded by the GNSS device.
[0331] • All images collected by the UAV are transmitted to the server (130) and these images are securely saved in the database (110). b) Production of Orthophoto
[0332] • The collected RGB and thermal images are processed by the server (130) and distortions occurring in the field are corrected using EXIF data (Figure 3)
[0333] • Orthophoto is created from corrected thermal and RGB images. This orthophoto is a two-dimensional map of the power plant and reflects the locations of the panels. Orthophoto operates on both thermal and RGB images during the panel inspection process (Figure 3).
[0334] • Additionally, DSM (Digital Surface Model) and DEM (Digital Elevation Model) data are created and these data show the elevation differences and surface structure in the field (Figure 4). c) Creating Polygon Networks
[0335] The boundaries and corner points of the panels are detected using deep learning algorithms and image processing techniques on RGB and thermal orthophotos (Figure 5).
[0336] Polygon networks are created using corner coordinates for each panel and these polygons are saved in KML format (Figure 5).
[0337] Polygon networks are visually presented in the user interface (Application 120) so that the user receives detailed information about the positions of the panels. d) Creating a 3D Model
[0338] • A 3D model (3D field model) is created for the power plant area, supported by the produced orthophoto, DSM and DEM data (Figure 4).
[0339] • This model reflects the slope, height and potential obstacles of the power plant, allowing detailed analyses in the field.
[0340] • Users can examine the slopes and heights of the panels in the field through this model. e) Sun Simulation and Shade Analysis
[0341] Based on DSM and DEM data, the sun's azimuth and zenith angles are calculated (Figure 8).
[0342] • With the calculated sun angle, the amount of radiation falling on the panel surfaces and shadow projections are calculated. These simulations show the solar radiation exposure processes of the power plant in detail (Figure 8).
[0343] • Along with the solar simulation, shading analysis based on DSM data is performed. Potential shadowing areas and their effects on power plant performance are analysed. f) Anomaly Detection and Efficiency Calculations
[0344] • Anomalies in each panel are detected by temperature measurements made on JPG and RAW photographs (Figure 6).
[0345] • By performing pixel-based analysis based on temperature differences, hot spots and potential problems in thermal images are determined. By calculating the delta T temperature difference, decreases and anomalies in panel performance are detected (Figure 7).
[0346] • Panel-based efficiency calculations are made according to detected anomalies and temperature differences. The locations of faulty panels and efficiency losses are presented to the user in detailed reports (Figure 1 1).
[0347] 2. Process Without Orthophoto Production a) Image Collection with UAV
[0348] • The UAV carries out its flight covering the power plant area by collecting RGB and thermal images in the same way (Figure 2).
[0349] • The images are transmitted to the server (130) along with EXIF and GNSS data and stored in the database (110). b) Conversion to Real World Coordinates
[0350] • Instead of orthophoto creation, images collected by the UAV are converted to real-world coordinates using EXIF and GNSS data (eliminating the distortion removal steps in Figure 3). • The positions of the panels on the switchboard are precisely determined by this transformation and each pixel is associated with world coordinates. c) Creating Polygon Networks
[0351] • RGB and thermal images are processed without orthophoto to detect the boundaries and corner points of each panel.
[0352] • Using these detected corner points, polygon networks are created and saved in KML format. These polygon networks allow the plant to be analysed without orthophoto.
[0353] • Polygon networks are presented to the user's interface for panel-based analysis in a digital environment. d) Creating a digital twin
[0354] • Instead of orthophoto, a digital twin of the power plant is created using created polygon networks and real-world coordinates.
[0355] • This digital twin represents the positions and structural features of the panels in detail in a digital environment and can be used in field inspection processes. e) Sun Simulation and Shadow Analysis
[0356] • Since DSM is not created, solar simulation and shading analyses are performed via digital twin and polygon networks.
[0357] • The azimuth and zenith angles of the sun are calculated, and irradiance calculations are made on the digital twin of each panel (Figure 8).
[0358] • Through the digital twin, potential shadowing areas are simulated and their effects on the efficiency of the plant are analysed. f) Anomaly Detection and Efficiency Calculations • In this process, which is carried out without orthophoto and DSM, temperature measurements are performed on the digital twin. Temperature data based on corner points and pixel basis of each panel is recorded. • Detected anomaly types are presented to the user via the digital twin, based on temperature differences and potential problems on the panel.
[0359] • Efficiency calculations and shadowing effects are also evaluated with the digital twin model.
[0360] Result: With the Production of Orthophoto: In the process based on orthophoto and DSM data, detailed 2D and 3D analyses of the panels are made, and solar simulation and shading analyses are supported by DSM. Without the Production of Orthophoto: Using real world coordinates and a digital twin model, the same processes are carried out without orthophoto production, and solar simulation and panel analyses are performed with the digital twin. In both variations, processes such as efficiency analysis of panels, anomaly detection based on temperature differences, and shadowing analyses are presented to the user with detailed reports by the server (130).
Claims
CLAIMS1. A solar power plant photovoltaic panel inspection system that enables the calculation of the efficiency of photovoltaic panels by detecting the error in the panel on a panel cell basis by thermal inspection from unmanned aerial vehicle images with artificial intelligence technology, comprising;• At least one UAV that enables the collection of RGB and thermal images in solar power plants where thermographic inspection will be carried out with the thermal and RGB camera thereon,• At least one database (110) to record RGB and thermal images, pixel-based temperature data on panels, mapping, orthophotos, three-dimensional models, efficiency calculations data generated by the server (130),• At least one application (120), which is executed on an electronic device, enables users to view and manage the information of the panels, has an interface for transferring the images collected by the UAV to the database (110), has an interface where users can take a photo of the photovoltaic panel serial number and record the panel serial numbers, has an interface where the user can get directions by vehicle or on foot to the panel location on the land where the user wants to go, and enables the user to display the efficiency values calculated by the server (130),• At last one server (130), which is in communication with the application (120) and the database (110); converts thermal and RGB images uploaded to the database (110) in JPEG format into orthophotos using image processing techniques; creates polygon networks with the panel model introduced to the system by using deep learning algorithms and taking the coordinates at the panel corner points as reference for distinguishing and analysing panels in RGB and thermal orthophotos; measures the temperature data obtained from thermal images on a pixel basis for each panel, detects anomalies with deep learning algorithms depending on the temperature difference in the panel, converts images converted to orthophoto into three-dimensional models by creating point clouds and mesh models, detects potential shading areas, radiation deficiencies and atmospheric effects by simulating the sun's position and radiation onthe three-dimensional field model created from two-dimensional images, according to the date and time entered by the user through the application (120), calculates the efficiency with the differences in kW value produced by the anomaly types detected on the panel and potential shading areas, radiation deficiencies and atmospheric effects.
2. Working method of the solar power plant photovoltaic panel inspection system, comprising the process steps of;- Collecting RGB and thermal images from solar power plants that will be subjected to thermographic inspection by the UAV thermal and RGB camera,- Transmitting the thermal and RGB images collected by the UAV to the database (110) via the application (120) and storing the images on cloud storage,- Converting thermal and RGB images to orthophoto via the server (130) to remove distortions and deformations experienced in the camera by using image processing methods,- Creating a point cloud and mesh model from the images converted to orthophoto by the server (130) and converting them into a three-dimensional field model,- Making anomaly map outputs by creating polygon networks in .KML format by segmenting RGB and thermal orthophotos into panels with deep learning algorithms, via the server (130) to reach each pixel in the panel and access the pixels' earth coordinate information and temperature values,- Performing temperature measurements on a pixel basis for each panel in the temperature data obtained from the thermal images collected by the IHA via the server (130),- Making classification by the server (130) according to the determined value ranges after the temperature measurement process is carried out,- Determining error types and hot spots by examining the thermal and RGB images of solar PV panels with artificial intelligence models by the server (130),- Detecting the potential shading zones, radiation deficiencies and atmospheric effects by simulating the position and irradiance of the sun according to the date and time entered by the user through the application (120) on the field model created by the server (130) from three-dimensional images,- Making efficiency calculations by the server (130) with the differences in kW value produced by the anomaly types detected on the panel, potential shading areas, radiation deficiencies and atmospheric effects and presenting to the user through the application (120),- Displaying the error type, temperature information and panel location information detected by the server (130) to the user via the application (120),- Calculating the shortest route by vehicle or pedestrian by the server (130) based on the positions of the panels, terrain structure and potential obstacles over the three-dimensional field model,- Providing an interface through the application (120) where the user can receive driving or pedestrian directions to the panel location on the land he / she wants to go to.
3. Working method of solar power plant photovoltaic panel inspection system according to claim 2, wherein, in the process step of determining fault types and hot spots by examining thermal and RGB images of solar photovoltaic panels with artificial intelligence models by the server (130), the error types are diode, cell, module, string, junction box, shadowing, contamination, fracture / crack, vegetation and hot spot faults.
4. Working method of solar power plant photovoltaic panel inspection system according to claim 2, wherein, the process step of measuring the temperature on a pixel-by-pixel basis for each panel in the temperature data obtained from the thermal images collected by the UAV by the server (130) comprises the process steps of;- Obtaining temperature measurement parameters such as distance, surface reflection, reflection and humidity information from thermal UAV images,- Obtaining temperature information for each pixel of the panels in the images from raw UAV images,- Recording temperature data in images to the coordinates of each pixel.
5. Working method of solar power plant photovoltaic panel inspection system according to claim 2, wherein, in the process step of classification according to the value ranges determined by the server (130) after the temperature measurement process is performed, the temperature status assignments are classified as medium high low according to the world standard temperature measurement values.
6. Solar power plant photovoltaic panel inspection system according to claim 1 , comprising an application (120) carried out on mobile devices, tablets, computers, cell phones.
7. Solar power plant photovoltaic panel inspection system according to claim 1 , comprising an application (120) that enables images to be transmitted to the database (110) by communicating via wireless communication protocols.
8. Solar power plant photovoltaic panel inspection system according to claim 1 , comprising an application (120) which enables the user to present the outputs prepared by the server (130) from all data including coordinates, temperature and serial numbers, as well as thermal RGB images of the panels, to the user with diagrams.
9. Solar power plant photovoltaic panel inspection system according to claim 1 , comprising at least one server (130) which creates polygon networks with the panel model introduced into the system by using deep learning algorithms to distinguish and analyse the panels in the produced RGB and thermal orthophotos, using the coordinates at the panel corner points as reference.
10. Solar power plant photovoltaic panel inspection system according to claim 1 , comprising at least one server (130) which uses image processing algorithms onthe photovoltaic panel serial number image taken by users through the application (120), converts it into text format and ensures that it is recorded for the relevant panel.
11. Solar power plant photovoltaic panel inspection system according to claim 1 , comprising a server (130) that allows field teams to calculate the shortest route by vehicle or pedestrian based on the positions of the panels, land structure and potential obstacles, and electrical infrastructure elements through a two- dimensional orthophoto and three-dimensional field model, in order to enable field teams to reach the faulty panels in the shortest and safest way.
12. Working system of the solar power plant photovoltaic panel inspection system according to claim 3, wherein the artificial intelligence model used is Convolutional Neural Networks based model.
13. Working method of the solar power plant photovoltaic panel inspection system according to claim 2 or claim 5, wherein, after the temperature measurements of the server (130), temperature differences are classified according to certain ranges.
14. Working method of the solar power plant photovoltaic panel inspection system according to claim 5 or claim 13, wherein, in order to identify anomaly types such as hot spot formation, diode malfunction, cell breaks or connection problems, the server (130) classifies deviations of less than 5% as “low”, deviations between 5% and 10% as “medium” and deviations of more than 10% as “high” temperature anomalies.
15. Working method of the solar power plant photovoltaic panel inspection system according to claim 5 or claim 13, wherein the server (130) performs the measurements for classification according to the IEC 62446 standard.
16. Solar power plant photovoltaic panel inspection system according to claim 1 , comprising;• GPS-based autonomous unmanned aerial vehicle (UAV) that takes high- resolution photographs at regular intervals, covering the entire plant areawith the camera on board, and transmits the images to the server (130) to collect images,• At last one server (130), which is in communication with the application (120) and the database (110); converts thermal and RGB images uploaded to the database (110) in JPEG format into orthophotos using image processing techniques; integrates information such as the positions, heights and slopes of the panels in the field using Digital Surface Model and Digital Elevation Model data, as well as RGB and thermal orthophotos; creates polygon networks with the panel model introduced to the system by using deep learning algorithms and taking the coordinates at the panel corner points as reference for distinguishing and analyzing panels in RGB and thermal orthophotos; measures the temperature data obtained from thermal images on a pixel basis for each panel, detects anomalies with deep learning algorithms depending on the temperature difference in the panel, converts the images converted to orthophoto into three-dimensional models with point cloud and mesh model created by taking into account the height differences in the field by additionally using Digital Surface Model and Digital Elevation Model data, detects potential shading areas, radiation deficiencies and atmospheric effects by simulating the sun's position and radiation on the three-dimensional field model created from two-dimensional images, according to the date and time entered by the user through the application (120), calculates the efficiency with the differences in kW value produced by the anomaly types detected on the panel and potential shading areas, radiation deficiencies and atmospheric effects, analyses the image using image processing algorithms and artificial intelligence and determining the types and severity of errors in each detected panel, analyses and detects the energy generation performance of PV panels according to environmental factors and simulates the effects of the positioning and slope angles of the panels on solar radiation,• Interface that visualizes anomaly detections and panel states through a user-friendly interface, and• Database (110), which ensures that all collected data is stored and backed up securely and protects against unauthorized access.
17. Solar power plant photovoltaic panel inspection system according to claim 1 or claim 16, comprising a server (130) that measures the temperatures of the panels detected through original and raw thermal images through an artificial intelligence system trained with Convolutional Neural Network models in order to analyse PV panels using image processing algorithms and artificial intelligence, enables detection of errors in panels with visual analysis by using CNN based algorithms again in RGB images, detects errors by detecting surface defects, cracks or other visual distortions in RGB images while it detects anomalies and potential malfunctions by detecting temperature differences in thermal images.
18. Solar power plant photovoltaic panel inspection system according to claim 1 or claim 16, comprising a server (130) that determines the surface temperatures and physical states of the panels by using thermal and RGB image processing algorithms to analyse environmental factors, atmospheric effects and pollution factors in order to calculate the energy generation performance of PV panels, evaluates the effects of temperature, solar radiation, wind speed, humidity and air pollution variables on the energy generation of each panel by supporting the obtained data with artificial intelligence-based models.
19. Solar power plant photovoltaic panel inspection system according to claim 1 or claim 16, comprising a server (130) that examines thermal and RGB images of solar photovoltaic panels with artificial intelligence models and determines diode, cell, module, array, junction box, shading, contamination, broken / crack, vegetation and hot spot errors and hot spots.
20. Solar power plant photovoltaic panel inspection method according to claim 2, comprising the process steps of;- Recording temperature data in images to the coordinates of each pixel,- Collecting data from solar power plants during flight using sensors and cameras (10000),- Server (130) processing the images coming from the UAV,- Server (130) detecting and classifying anomalies,- Server (130) visualizing and reporting the detected panel on the interface,21. Solar power plant photovoltaic panel inspection method according to claim 2 or claim 20, wherein the processing step of the server (130) processing images from the UAV comprises the process steps of;- Determining the borders and corner points of the panels,- Recognizing and classifying the objects in photographs with deep learning models,- Creating a polygon network for each panel by segmenting the panels.
22. Solar power plant photovoltaic panel inspection method according to claim 2 or claim 20, wherein the processing step of the server (130) performing anomaly detection and classification comprises the process steps of;- Identifying and classifying various anomalies that may occur on the panels with artificial intelligence running on the server,- Recording anomalies in the database (110) according to their classification to be used in maintenance and repair planning.
23. Solar power plant photovoltaic panel inspection method according to claim 14, wherein the polygon mesh generated comprises the exact location and dimensions of the panels.
24. Solar power plant photovoltaic panel inspection system according to claim 12, comprising a server (130) that takes into account the effects of weather conditions, dust, humidity environmental factors.
25. Solar power plant photovoltaic panel inspection system according to claim 12, comprising a server (130) that updates its algorithms and models based on new data and user feedback through the interface.
26. Solar power plant photovoltaic panel inspection system according to claim 12, comprising an internet based interface.
27. Solar power plant photovoltaic panel inspection method according to claim 2 or claim 20, wherein, the process step of collecting data from solar power plants using sensors and cameras during flight (10000) comprises the process steps of;- Collecting data with Unmanned Aerial Vehicle (201 ) with thermal and RGB cameras,- Generating theThermal and RGB Photographs (204),- Placing the Thermal Photo into a Folder (205),- Placing the RGB Photos into a Folder (206)- Completing Data Collection (207),- Server (130) preferring the orthophoto method.
28. Solar power plant photovoltaic panel inspection method according to claim 2 or claim 20, wherein, in the case where the server (130) prefers the orthophoto method, the orthophoto is generated in the process step comprising the process steps of;- Generating and processing Orthophoto (20000),- Creating the 3D field model (30000),- Creating polygon networks (40000),- Conducting the Anomaly detection (50000),- Performing temperature measurement (60000),- Making solar simulation (70000),- Performing navigation analysis (80000),- Conducting field performance and efficiency analysis (90000),- Generating the analysis report (100000).
29. Solar power plant photovoltaic panel inspection method according to claim 2 or claim 20, wherein, in the case where the server (130) prefers the orthophoto method, the orthophoto is generated in the process step comprising the process steps of;- Inverting to real world coordinates,- Creating polygon networks (40000),- Creating a digital twin,- Conducting the Anomaly detection (50000),- Performing temperature measurement (60000),- Making solar simulation (70000),- Performing navigation analysis (80000),- Conducting field performance and efficiency analysis (90000),- Generating the analysis report (100000).
30. Solar power plant photovoltaic panel inspection method according to claim 28, wherein the process step of producing and processing orthophotos (20000) comprises the process steps of; o Receiving Thermal JPEG / RJPEG / RAW / TIF / FLIR Images (301 ), o Collecting Information from EXIF Data (302) o Elimination of the Distortions (303) o Producing the Thermal Orthophoto (304) o Receiving RGB JPEG / RJPEG / RAW / TIF / FLIR Images (305), o Collecting Information from EXIF Data (306) o Eliminating the Distortions (307)o Producing RGB Orthophoto (308).
31. Solar power plant photovoltaic panel inspection method according to claim 28, wherein the process step of creating a 3D field model (30000) comprises the process steps of; o Receiving 2D Thermal Orthophoto Data (401 ), o Adding Elevation Data (402), o Creating Point Clouds (403), o Creating DEM and DSM Data (404), o Texture Mapping (405), o Creating 3D Thermal Field Model (406), o Receiving 2D RGB Orthophoto Data (407), o Adding Elevation Data (408) o Creating Point Clouds (409) o 3D RGB Field Model (412).
32. Solar power plant photovoltaic panel inspection method according to claim 28, wherein the process step of generating polygon networks (40000) comprises the process steps of; o Receiving 2D Thermal Orthophoto (501 ), o Separating the Floor and Panels (502), o Determining the Corner Coordinates of Panels (503), o Determining Each Panel in Boxes (504), o Uploading Metadata (505), o Creating the polygon networks (506),o Receiving 2D RGB Orthophoto (507), o Determining the Corner Coordinates (509), o Generating Electrical Infrastructure Map (513).
33. Solar power plant photovoltaic panel inspection method according to claim 28, wherein the process step of performing anomaly detection (50000) comprises the process steps of; o Receiving Thermal Orthophoto (601 ), o Creating Data Set (602), o Enriching Data Set with Al Techniques (603), o Conducting Model Training (604), o Detecting Anomaly Panels with Al Techniques (605).
34. Solar power plant photovoltaic panel inspection method according to claim 28, wherein the process step of performing the temperature measurement process (60000) comprises the process steps of; o Taking Thermal Images (701 ), o Determining the Temperature Parameters (702), o Receiving XY Pixel Coordinate Information (703), o Adding Pixel Temperature Values (704), o Calculating Delta T Temperature Values (705), o Completing the Temperature Measurement Process (708).
35. Solar power plant photovoltaic panel inspection method according to claim 28, wherein the process step of performing solar simulation (70000) comprises the process steps of; o Collecting the Atmospheric Information (801 ),o Calculating the Sun Position (802), o Shadowing Analysis with DSM / DEM Data (803), o Calculating Irradiance (804), o Completing the Simulation (807).
36. Solar power plant photovoltaic panel inspection method according to claim 28, wherein the process step of performing the navigation analysis (80000) comprises the process steps of; o Creating a Digital Surface Model (902), o Creating a Slope Map (903), o Elevation Zoning (904), o Identifying the Road Networks (906), o Completing the Navigation Analysis (910).
37. Solar power plant photovoltaic panel inspection method according to claim 28, wherein the process step of performing field performance and efficiency analysis (90000) comprises the process steps of; o Taking Temperature Values (1002) in Thermal Image, o Energy Generation and Radiation Analysis (1004), o Completing the Performance and Efficiency Analysis (1007).
38. Solar power plant photovoltaic panel inspection method according to claim 28, wherein the process step of producing the analysis report (100000) comprises the process steps of; o Obtaining Field Information (1101 ), o Taking Thermal Orthophoto (1102), o Creating Anomaly Map Polygon Network (1103),o Taking RGB Orthophoto (1104), o Creating the Electrical Infrastructure Map (1106), o Prioritizing the Anomalies (1107), o Completing the Analysis Report (1110).
39. Solar power plant photovoltaic panel inspection method according to claim 29, wherein the process step of inverting to real world coordinates comprises the process steps of; o Using EXIF and GNSS Data, o Reading GPS coordinates from the EXIF data of the collected images, o Calculating the coordinates of each pixel in the image on Earth, o Determining the exact positions of the panels on the switchboard, o Determining the Borders and Corner Points of Panels (503), o Determining the boundaries of each panel with image processing algorithms, o Determining the corner points of each panel using deep learning techniques, o Mapping the coordinates of each panel correctly, o Verifying Real World Coordinates, o Checking the accuracy of GNSS data, o Achieving synchronization between image data and GNSS data. o Checking the exact locations of the panels on the earth for accuracy.40.A solar power plant photovoltaic panel inspection method according to claim 29, wherein the process step of generating polygon networks (40000) comprises the process steps of; o Starting the process of creating panel polygons, o Creating Polygon networks on Thermal and RGB Images (506) o Determining the boundaries of each panel on RGB and thermal images, o Detecting the corner points and boundaries of each panel using image processing techniques, o Creating a polygon for each panel from the specified corner points, o Determining the Corner Coordinates of Panels (503), o Verifying the corner points of the panels with deep learning and image processing algorithms, o Associating each corner point with real-world coordinates, o Generating Electrical Infrastructure Map (513), o Mapping the elements of the electrical infrastructure, o Associating these elements with the panels and creating a map showing electrical connections, o Storing all networks in digital map format and converting the same to KML / SHP file formats.
41. Solar power plant photovoltaic panel inspection method according to claim 29, wherein the process step of creating a digital twin comprises the process steps of; o Creating the digital field model using real-world coordinates and polygon networks, o Combining RGB and thermal images with this model,o Digital twin comprising all panels and electrical infrastructure elements on the power plant, o Adding a Digital Map of Panels and Elevation Data, o Representing the topographic structure of the land in the digital model, o Reflecting the slopes and height differences of the panels visually in the model, o Conducting Visual Analysis of Panels on Digital Twin, o Analyzing the panels visually on the digital twin, o Marking the anomalies, slopes and potential problems visually on the digital twin, o Users receiving information about the locations, performance and problems of the panels.42.A solar power plant photovoltaic panel inspection method according to claim 29, wherein the process step of performing anomaly detection (50000) comprises the process steps of; o Receiving Thermal Orthophoto (601 ), o Creating Data Set (602), o Enriching Data Set with Al Techniques (603), o Conducting Model Training (604), o Detecting Anomaly Panels with Al Techniques (605).
43. Solar power plant photovoltaic panel inspection method according to claim 29, wherein the process step of performing the temperature measurement process (60000) comprises the process steps of;o Taking Thermal Images (701 ), o Determining the Temperature Parameters (702), o Receiving XY Pixel Coordinate Information (703), o Adding Pixel Temperature Values (704), o Calculating Delta T Temperature Values (705), o Completing the Temperature Measurement Process (708).
44. Solar power plant photovoltaic panel inspection method according to claim 29, wherein the process step of performing solar simulation (70000) comprises the process steps of; o Collecting the Atmospheric Information (801 ), o Calculating the Sun Position (802), o Shading Analysis with Digital Twin, o Calculating Irradiance (804), o Completing the Simulation (807).
45. Solar power plant photovoltaic panel inspection method according to claim 29, wherein the process step of performing the navigation analysis (80000) comprises the process steps of; o Creating a Digital Surface Model (902), o Creating a Slope Map (903), o Elevation Zoning (904), o Identifying the Road Networks (906), o Completing the Navigation Analysis (910).
46. The solar power plant photovoltaic panel inspection method according to claim 29, wherein the process step of performing field performance and efficiency analysis (90000) comprises the process steps of; o Taking Temperature Values (1002) in Thermal Image, o Energy Generation and Radiation Analysis (1004), o Completing the Performance and Efficiency Analysis (1007).
47. Solar power plant photovoltaic panel inspection method according to claim 29, wherein the process step of producing the analysis report (100000) comprises the process steps of; o Obtaining Field Information (1101 ) o Taking Thermal Orthophoto (1102), o Creating Anomaly Map Polygon Network (1103), o Taking RGB Orthophoto (1104), o Creating the Electrical Infrastructure Map (1106), o Prioritizing the Anomalies (1107), o Completing the Analysis Report (1110).
Citation Information
Patent Citations
Automated breeding system for black soldier fly
KR1020230052594A
Semiconductor manufacturing equipment with optical communcation
KR1020230155315A
Antiflaming paints composition with improving water resistance and abrasion resistance and manufacturing method thereof
KR102743432B1
Cited By
Intelligent inspection operation and maintenance system for photovoltaic power station
CN120494801A
Shadow perception satellite image nerve radiation field surface three-dimensional reconstruction method
CN120599178A
Photovoltaic panel defect detection and classification method based on thermal infrared image
CN120655967A
Photovoltaic module surface shielding object detection system based on unmanned aerial vehicle
CN120807930A
Distributed photovoltaic power station adaptive mobile monitoring system
CN120834774A