
System and process for supply management for the assembly of expensive products
a technology for expensive products and supply management, applied in the field of supply management, can solve the problems of high component inventories, prohibitively high quantity-based safety stocks, and poor scheduling effect of quantity-based inventory policies, and achieve the effect of fast component delivery
Patent Information
- Authority / Receiving Office
- US · United States
- Patent Type
- Patents(United States)
- Current Assignee / Owner
- Publication Date
- 2008-08-26
Smart Images
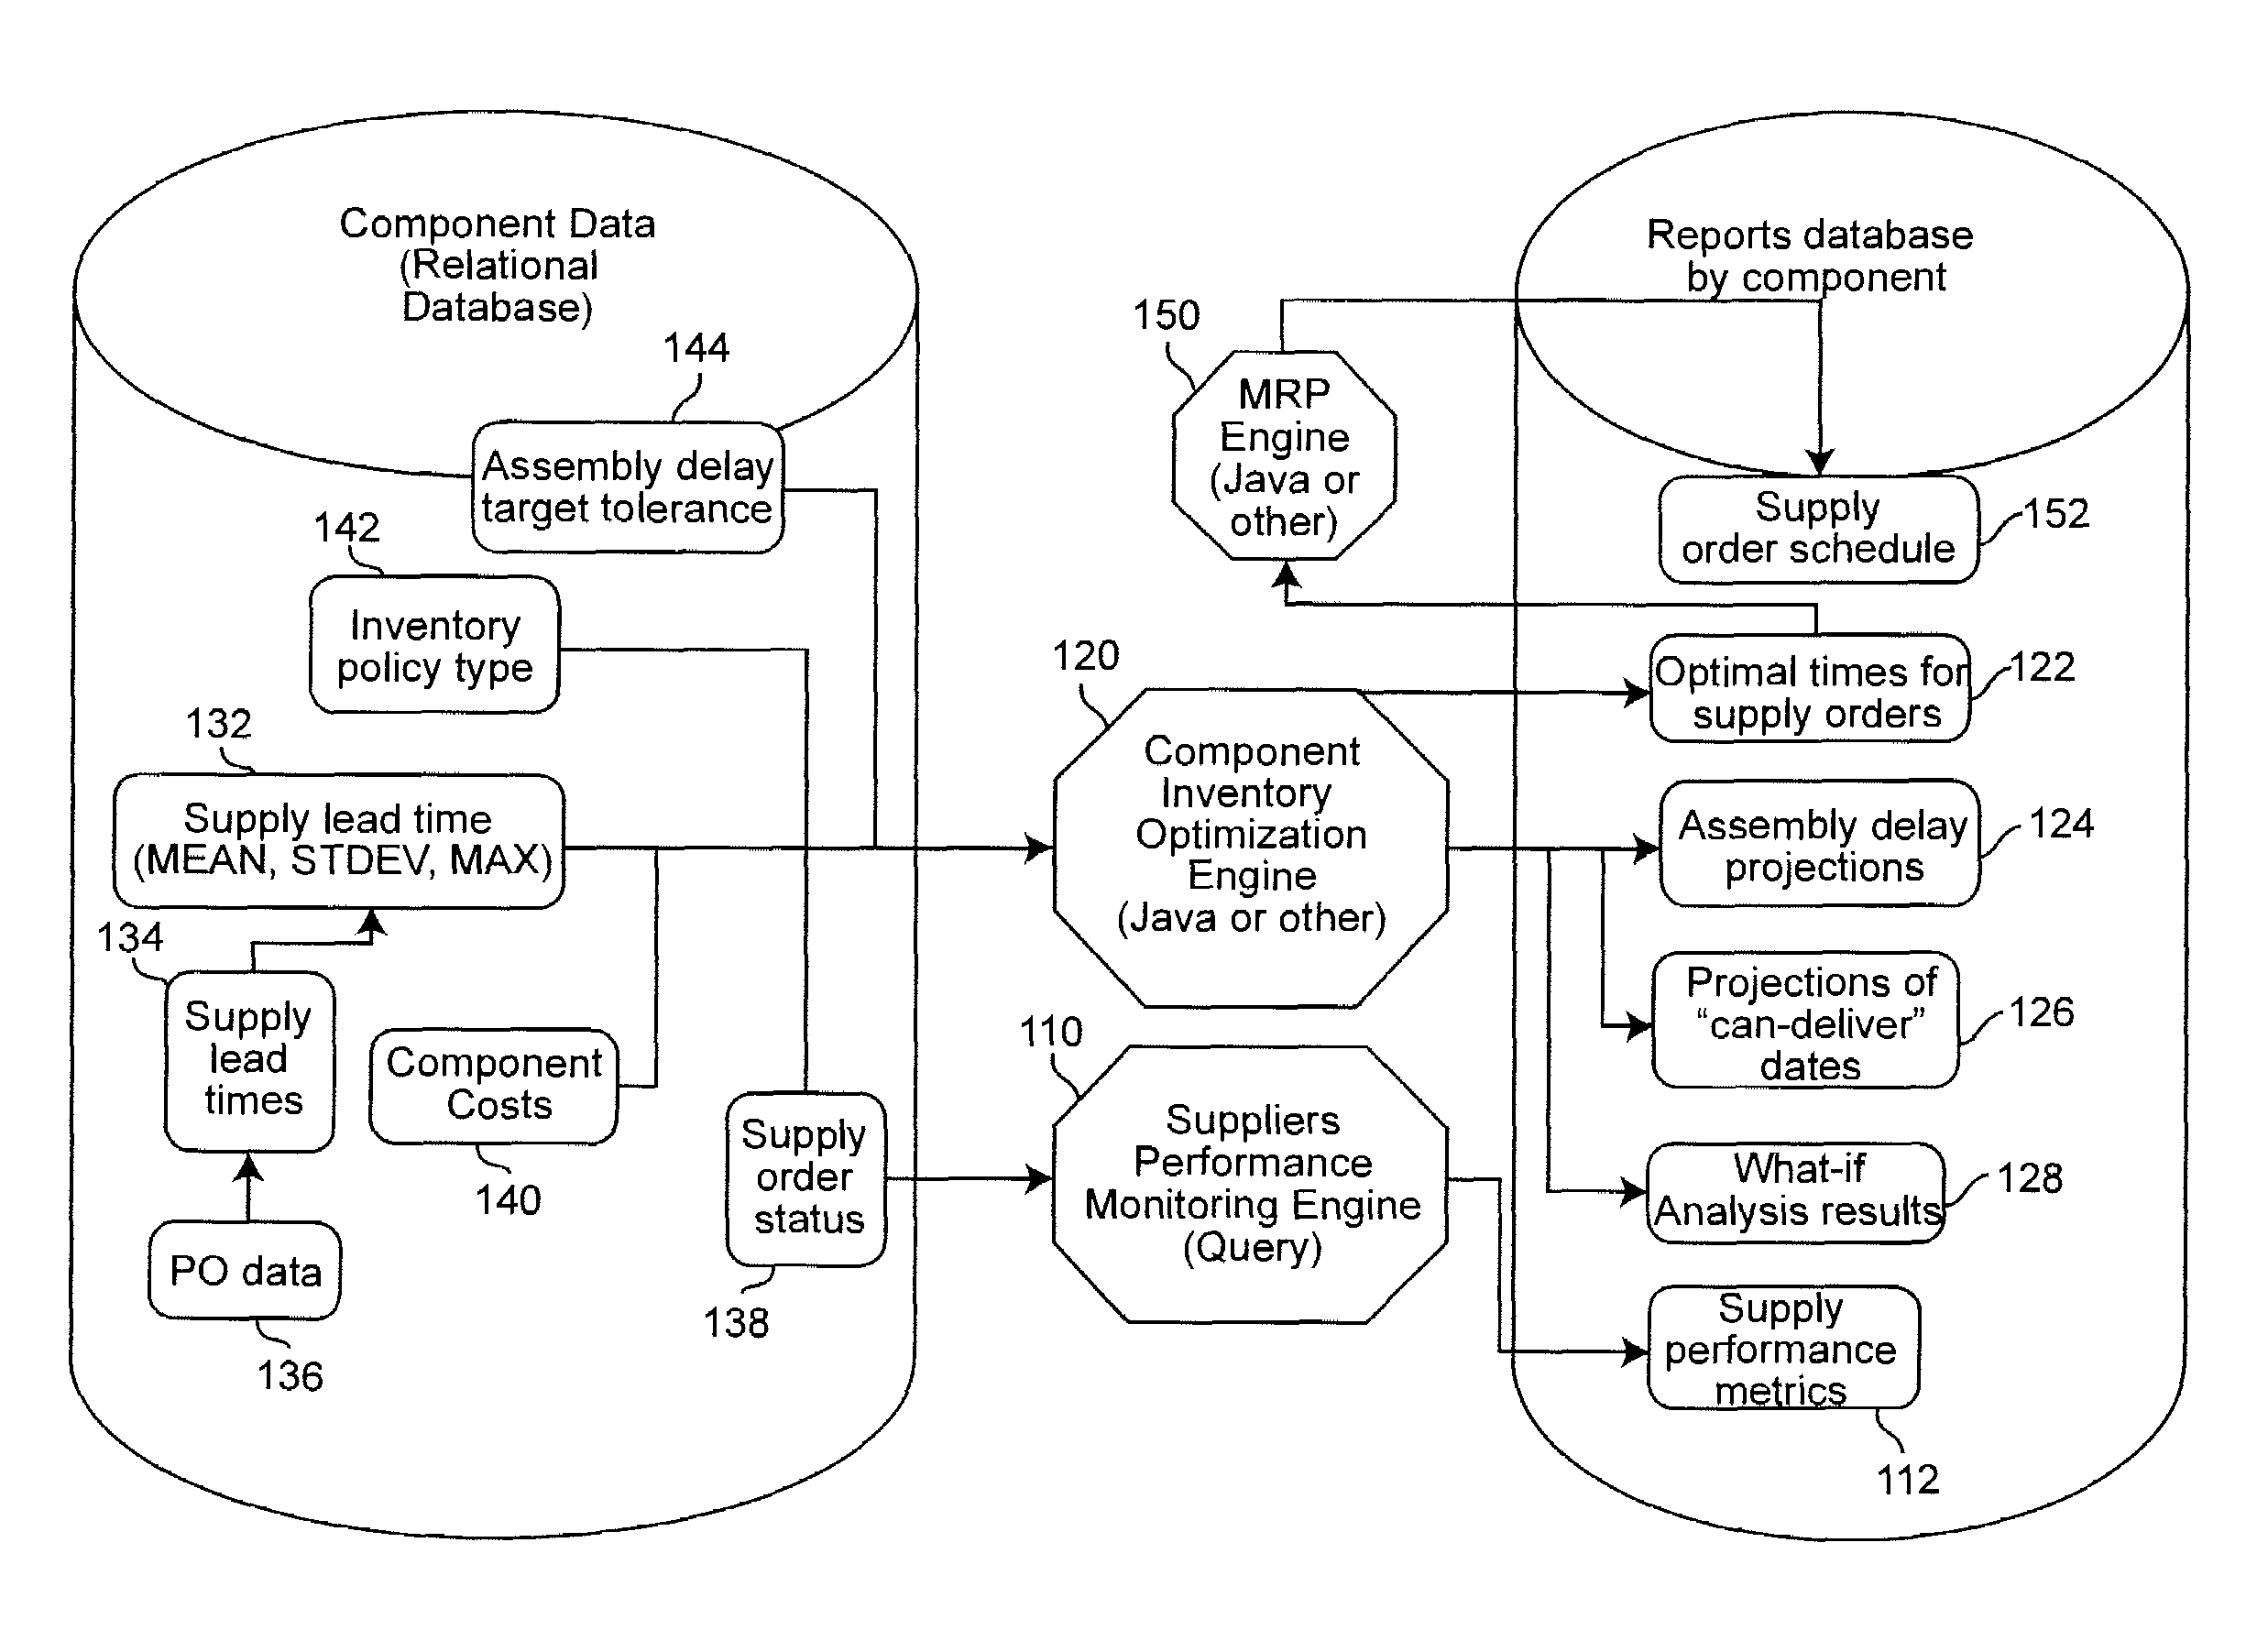
Figure 1 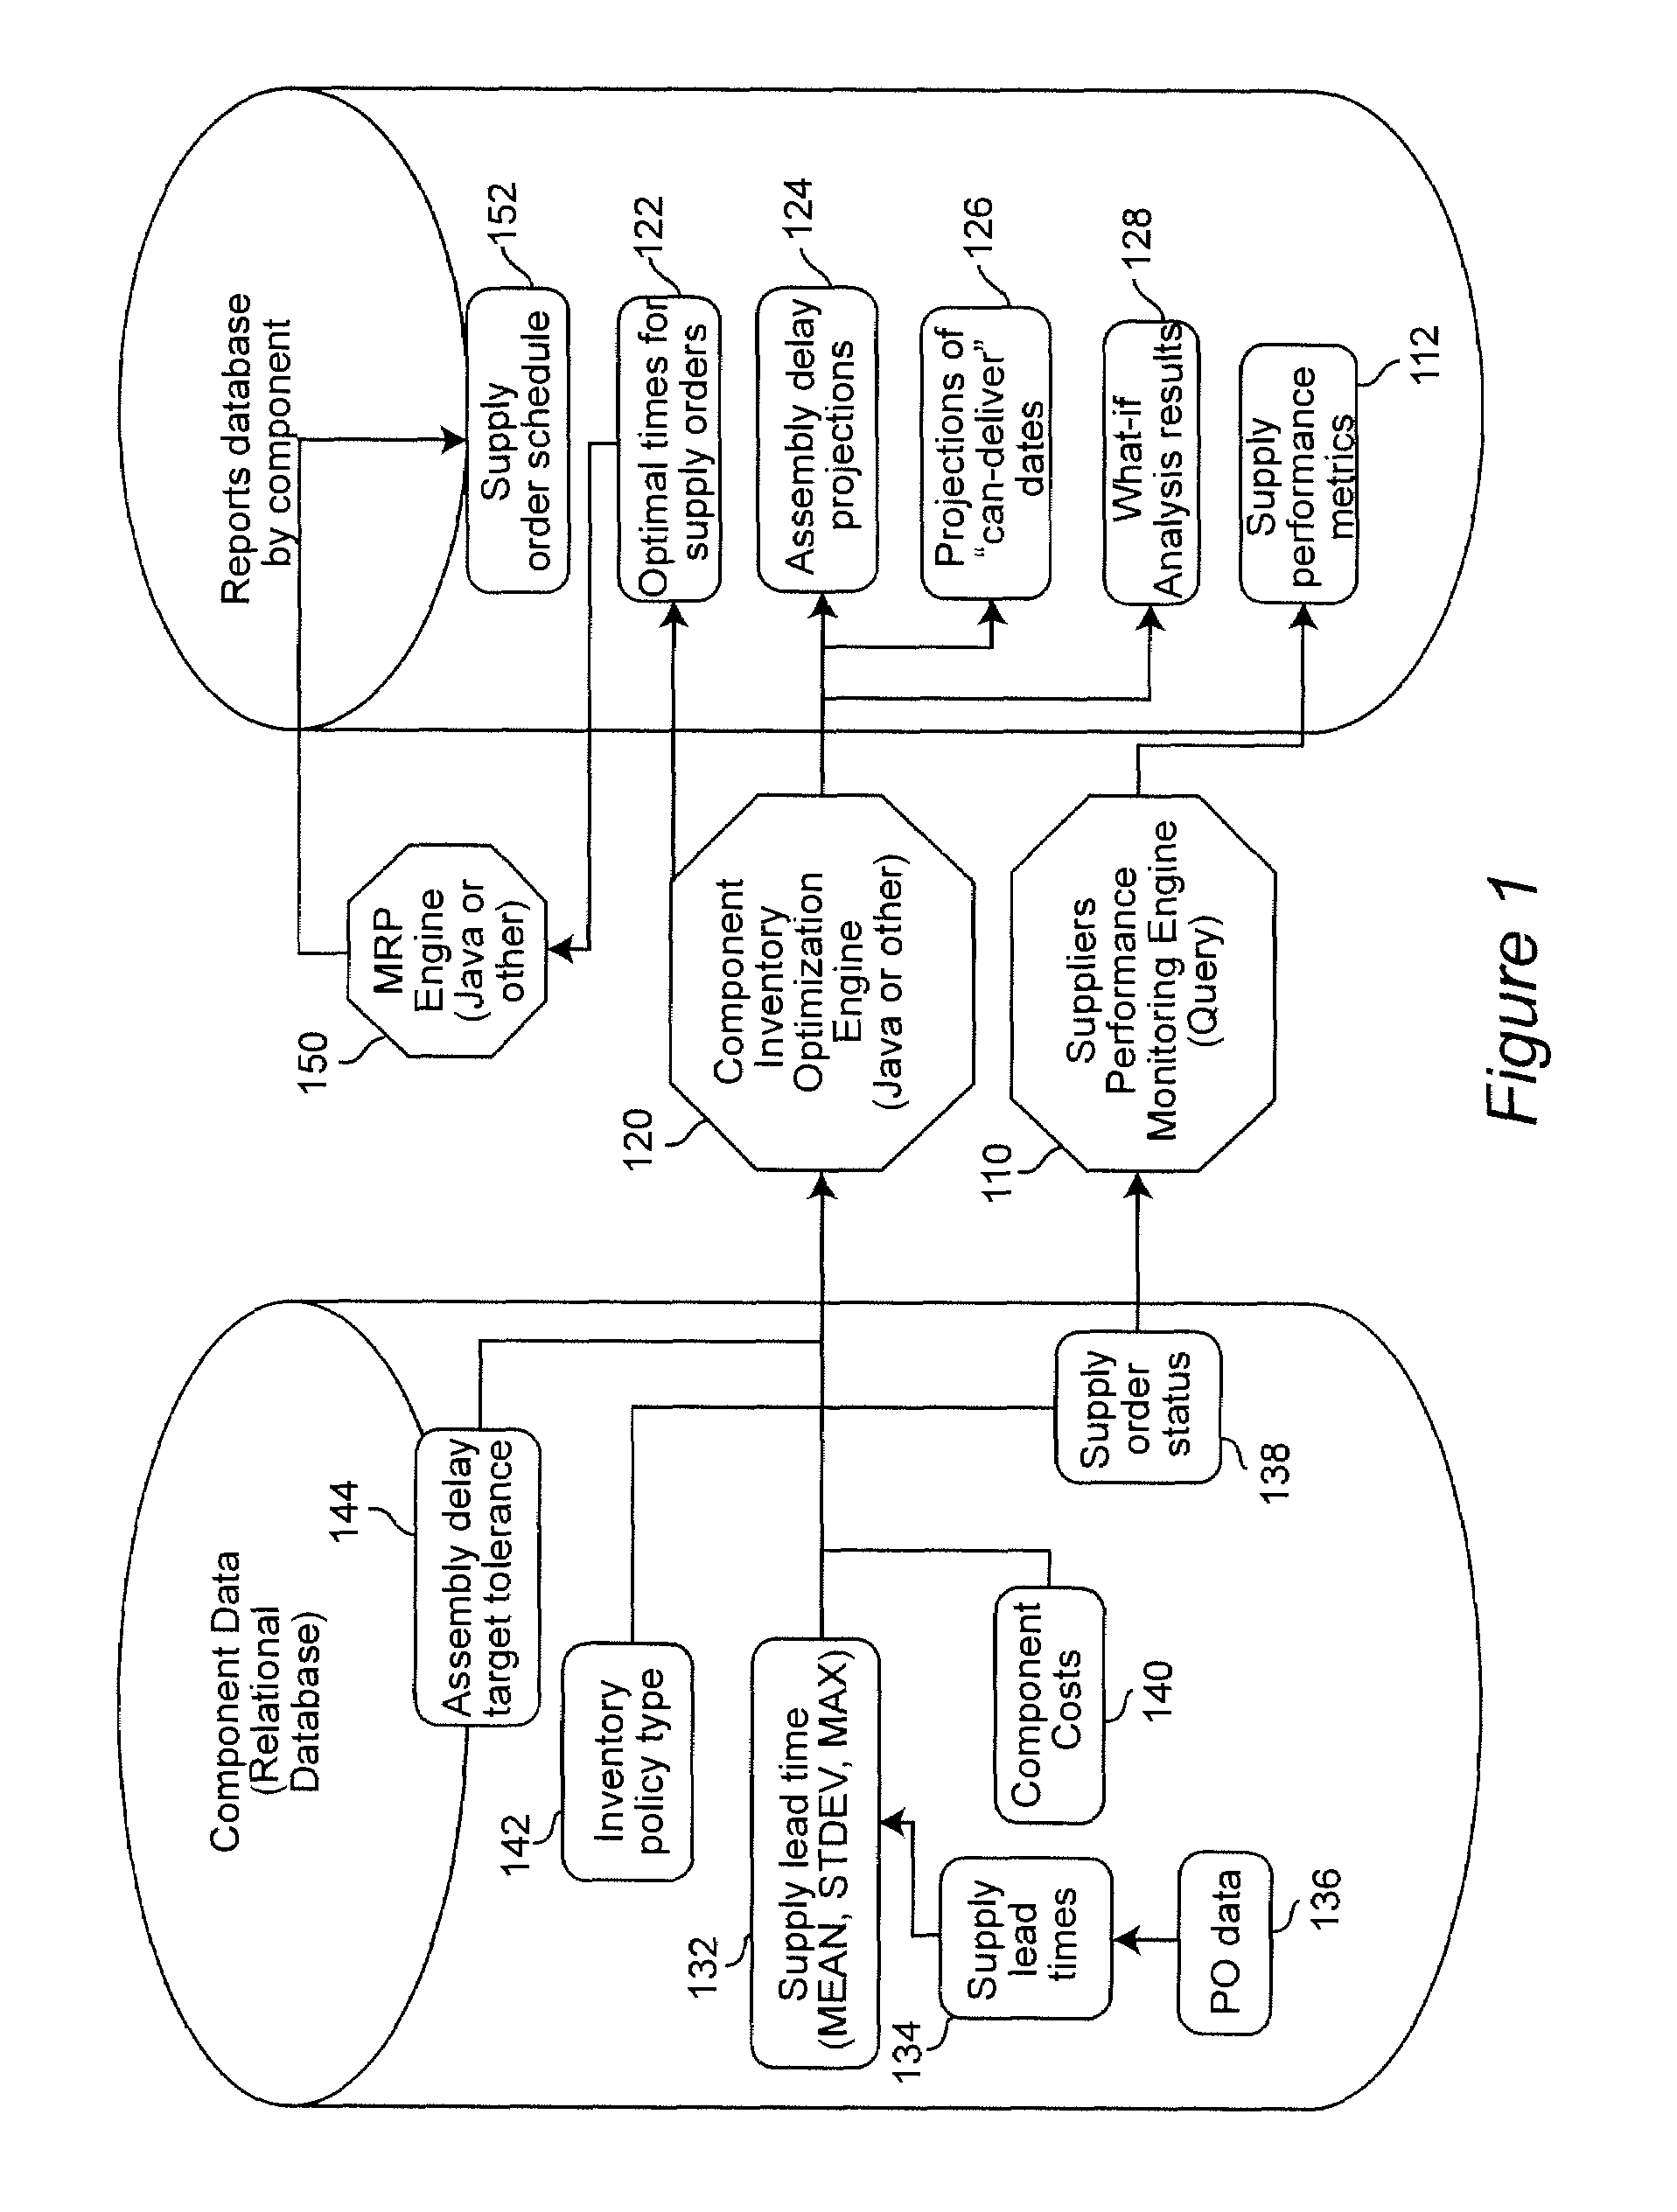
Figure 2 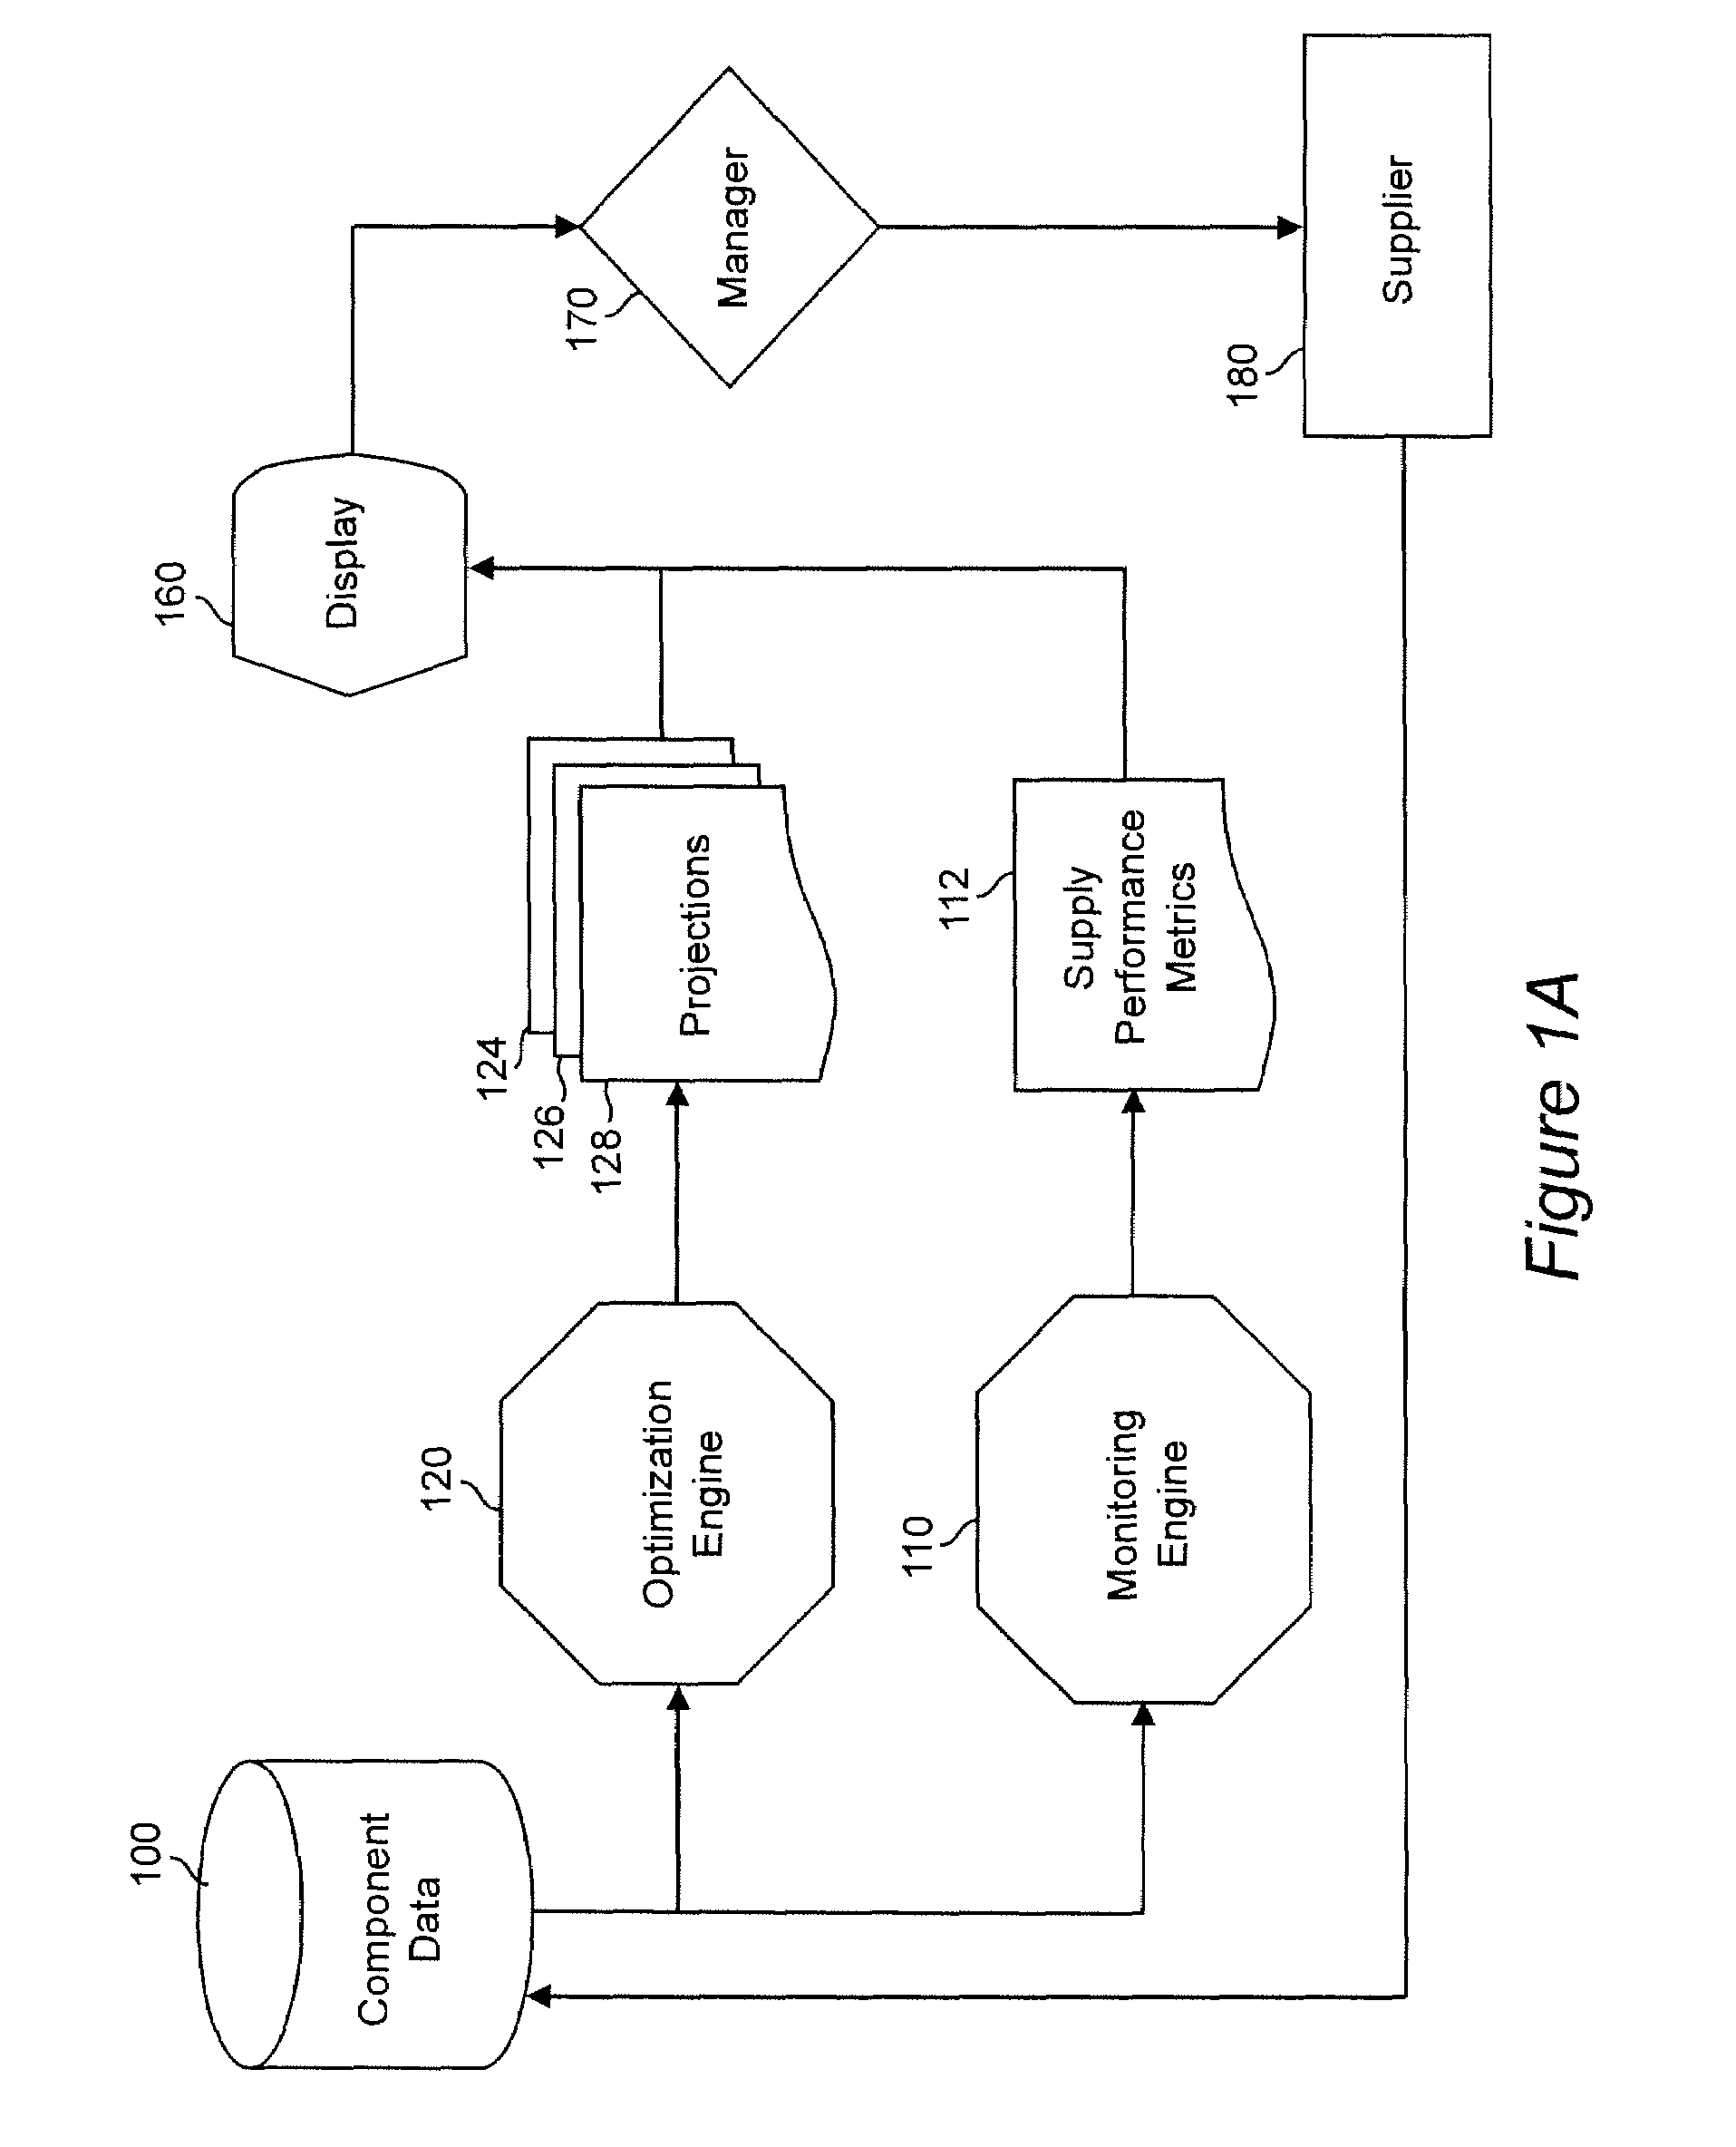
Figure 3
Abstract
Description
BACKGROUND OF THE INVENTION
[0001] 1. Field of the Invention
[0002] The present invention generally relates to supply management, and in particular to techniques for optimizing supply management for the assembly of expensive products.
[0003] 2. Background Description
[0004] There are numerous prior art methods and systems that manage inventory. Since inventory problems can show substantial variations depending on the industry, process, supply network, and product characteristics, there is a proliferation of academic publications as well as patents covering inventory management.
[0005] U.S. Pat. No. 7,016,764 to Penkar et al., “Inventory management system for reducing overall warehouse and pipeline inventory” discloses an inventory management system for warehouse and pipeline inventory. The system is designed to provide regular shipments of parts to multiple manufacturing facilities from a hub via an expedited delivery service. The objective of the design is to reduce the amount of safety stoc...
Examples
case 1
[0176] In order to answer this question, the user enters the value of change for the average lead time in percent terms. Then, the average supply lead time is updated as follows:
HASLTNEW[i]=HASLT[i]*(1+ASLTCHANGE[i]).
[0177]Then calculations described in method elements 124 and 126 are performed after replacing HASLT[i] by HASLTNEW[i].
case 2
[0178] In order to answer this question, the user enters the value of change for the variability of lead time in percent terms. Then, the average supply lead time is updated as follows:
HSSLTNEW[i]=HSSLT[i]*(1+SSLTCHANGE[i]).
[0179]Then calculations described in method elements 124 and 126 are performed after replacing HSSLT[i] by HSSLTNEW[i].
[0180]If both average lead time and variability of lead time change, then the new standard deviation is calculated as follows:
HSSLTNEW[i]=(HASLTNEW[i] / HASLT[i])*HSSLT[i]*(1+SSLTCHANGE[i]).
case 3
[0181] In order to answer this question, the user enters the value of anticipated delay in supply order delivery (in days). Then, this new delay (denote it by SSDNEW[i,k]) replaces the old one (i.e. SSD[i,k]). Then calculations described in method elements 124 and 126 are performed to answer the questions.
[0182]Table 128 shown in FIG. 2N illustrates exemplary what-if analysis data. These “what-if” questions are important for the operations managers to simultaneously control i) the assembly delays and on time delivery of completed products to customers and ii) component inventory. Accurate answers to these “what-if” questions require the above described method of this invention, and in particular the way the method of the invention links component supply delays to assembly delay, and the way it calculates the probabilities of on time starts of assemblies. Many planning systems particularly MRP does not incorporate uncertainties in the planning and hence is not able to generate probab...