
Three-dimensional display method of ocean waves based on ocean remote sensing data
A technology of three-dimensional display and ocean remote sensing, which is applied in the field of radar remote sensing, and can solve problems such as not adding actual measured data
Patent Information
- Authority / Receiving Office
- CN · China
- Patent Type
- Patents(China)
- Current Assignee / Owner
- Publication Date
- 2021-08-24
Smart Images
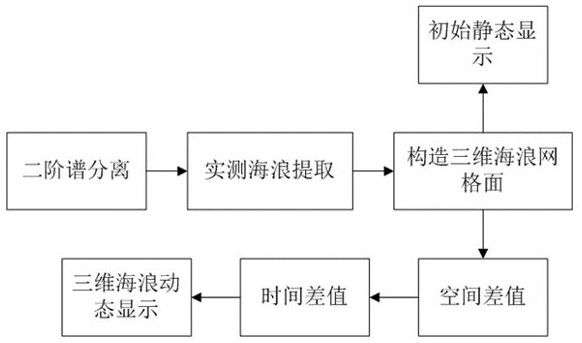
Figure 1 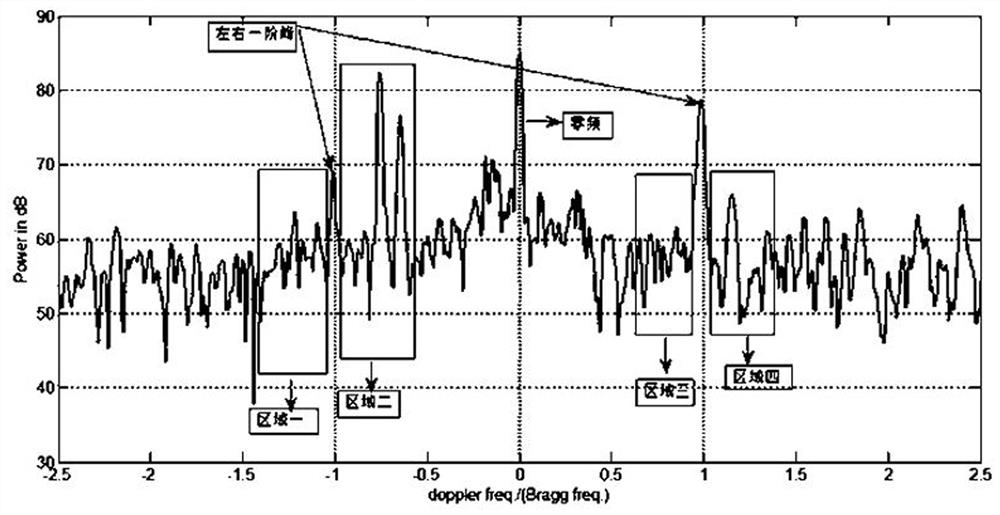
Figure 2 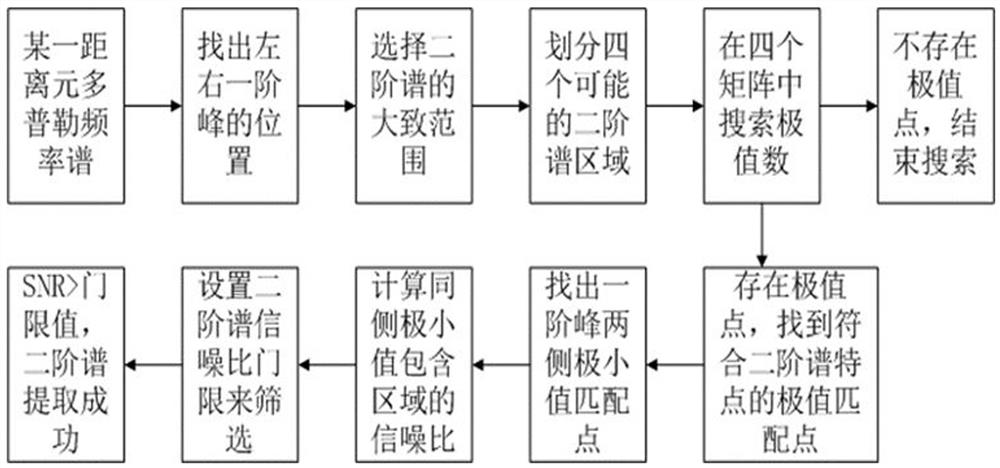
Figure 3
Abstract
Description
technical field
[0001] The invention relates to the technical field of radar remote sensing, in particular to a three-dimensional display method for ocean waves based on ocean remote sensing data. Background technique
[0002] With the development of radar remote sensing technology, large-scale real-time remote sensing monitoring of the ocean has been realized by using shore-based high-frequency ground wave radar. After obtaining the real-time data received by remote sensing, the motion state parameters and distribution of the ocean surface can be obtained through data analysis and feature extraction, including the velocity and direction of the ocean current, the height and intensity of the ocean wave, and the wind speed on the ocean surface information. Due to the wide range of oceans monitored, the amount of information obtained at one time is very large, and it is unrealistic to represent or display them all in digital form.
[0003] At present, for the research on thre...
Examples
Embodiment Construction
[0056] The specific embodiments of the present invention will be further described below in conjunction with the accompanying drawings, but the present invention is not limited.
[0057] figure 1 A 3D ocean wave display method based on ocean remote sensing data is shown. By extracting the second-order spectrum inversion wave parameters from the radar Doppler spectrum map, the kriging space interpolation algorithm is used to fill the grid nodes to simulate the preliminary 3D The waves are smoothed, and finally the cubic spline interpolation algorithm is used to interpolate the time series, so that the time intervals are continuous to achieve dynamic display; the specific steps are as follows:
[0058] (1) Extract the second-order spectrum from the radar Doppler spectrum map, such as image 3 shown, including the following sub-steps:
[0059] (1) Select a Doppler spectrum map of a distance element from a field of measured data, and estimate the position of the second-order spe...