

Sigmoid Function and Loss Landscapes: Visual Diagnostics for Model Training Stability
AUG 21, 20259 MIN READ
Generate Your Research Report Instantly with AI Agent
PatSnap Eureka helps you evaluate technical feasibility & market potential.
Sigmoid Function Evolution and Training Stability Goals
The sigmoid function, first introduced in the early development of neural networks, has evolved significantly over the decades to become a cornerstone in machine learning model training. Initially conceived as a mathematical function that maps any input value to a range between 0 and 1, the sigmoid function has transitioned from being the primary activation function in early neural networks to a specialized component in modern deep learning architectures. This evolution reflects the growing understanding of training dynamics and stability concerns in increasingly complex models.
The primary goal in studying sigmoid functions within the context of loss landscapes is to enhance model training stability. As neural networks have grown deeper and more complex, the challenges of vanishing gradients and optimization difficulties have become more pronounced. Visual diagnostics of loss landscapes provide crucial insights into how sigmoid and related activation functions influence the topology of the optimization space, directly impacting convergence rates and final model performance.
Current research aims to develop more sophisticated understanding of how sigmoid variants affect the curvature and smoothness of loss landscapes. This includes investigating the relationship between activation function choice and the presence of local minima, saddle points, and plateaus that can trap optimization algorithms. By visualizing these landscapes, researchers seek to identify patterns that predict training instability before it manifests in performance degradation.
Another significant objective is to establish quantitative metrics derived from loss landscape visualizations that can serve as early warning indicators for training issues. These metrics would ideally correlate with eventual model performance, allowing practitioners to make informed adjustments to learning rates, regularization techniques, or even architecture choices before investing substantial computational resources in full training cycles.
The field is also moving toward developing adaptive activation functions that can dynamically adjust their properties based on the local characteristics of the loss landscape during training. This represents a shift from static activation functions to context-aware components that contribute to more robust optimization trajectories across diverse data distributions and model architectures.
Ultimately, the technical goals in this domain center on transforming visual diagnostics from descriptive tools to prescriptive guides that can automatically suggest optimal training configurations. This includes developing theoretical frameworks that connect the mathematical properties of sigmoid-like functions to their empirical performance across different neural network architectures and learning tasks.
Market Demand for Neural Network Training Diagnostics
The market for neural network training diagnostics has experienced significant growth in recent years, driven by the increasing complexity and scale of deep learning models. Organizations across various sectors are investing heavily in AI technologies, with the global artificial intelligence market projected to reach $190 billion by 2025, growing at a CAGR of 37%. Within this expanding market, tools for model training diagnostics represent a critical segment addressing fundamental challenges in AI development.
The demand for visual diagnostic tools specifically focused on sigmoid functions and loss landscapes stems from the persistent challenges in neural network optimization. Data scientists and machine learning engineers consistently report that model training instability is among their top three challenges, with approximately 68% of AI projects experiencing significant delays due to optimization issues. This has created a substantial market opportunity for solutions that can visualize and diagnose training problems in real-time.
Financial services and healthcare sectors demonstrate particularly strong demand for these diagnostic tools, as they deploy increasingly complex models for critical applications where training stability directly impacts performance and reliability. The healthcare AI market alone is expected to grow at 41% annually through 2025, with diagnostic and monitoring applications representing the largest segment.
Enterprise customers are showing willingness to pay premium prices for diagnostic solutions that can reduce model training time and improve performance outcomes. A recent industry survey indicated that organizations spend an average of 60% of their AI development time on model optimization and troubleshooting, creating a compelling value proposition for effective diagnostic tools.
Cloud service providers have recognized this market opportunity, with major players including AWS, Google Cloud, and Microsoft Azure expanding their machine learning platforms to include more sophisticated training visualization tools. This trend indicates the strategic importance of training diagnostics in the broader AI infrastructure market.
The academic and research community represents another significant market segment, with universities and research institutions allocating substantial portions of their AI budgets to tools that enhance understanding of neural network behavior. Publications focusing on loss landscape visualization have seen citation growth exceeding 200% in the past three years, demonstrating the increasing academic interest in this field.
Emerging markets in Asia, particularly China and India, are showing accelerated adoption of AI technologies, creating new geographic opportunities for training diagnostic tools. These regions are expected to account for approximately 30% of global AI spending by 2025, representing a significant expansion of the addressable market.
Current Challenges in Loss Landscape Visualization
Despite significant advancements in deep learning visualization techniques, loss landscape visualization continues to face substantial challenges that limit its practical application in model training diagnostics. One primary obstacle is the computational complexity associated with high-dimensional parameter spaces. Modern neural networks often contain millions or billions of parameters, making comprehensive visualization of the entire loss landscape computationally prohibitive. Current methods typically rely on dimensionality reduction techniques that may inadvertently obscure critical features of the landscape.
Resolution limitations present another significant challenge. The granularity required to detect subtle but important landscape features—such as narrow valleys or small basins of attraction—often exceeds what current visualization techniques can efficiently provide. This limitation becomes particularly problematic when analyzing models that exhibit sharp minima or complex loss surface geometries.
Interpretation difficulties further complicate loss landscape visualization. The connection between visual patterns in loss landscapes and practical training behaviors remains incompletely understood. Practitioners struggle to translate observed landscape features into actionable training strategies or architecture modifications. This interpretability gap reduces the practical utility of visualization techniques in real-world model development scenarios.
Dynamic landscape evolution during training poses additional challenges. Loss landscapes are not static; they evolve as optimization progresses, especially in adaptive learning scenarios or when employing techniques like batch normalization. Current visualization approaches typically provide only static snapshots, failing to capture the temporal dynamics that significantly influence training stability.
The influence of stochasticity in training processes further complicates visualization efforts. Batch sampling, dropout, and other regularization techniques introduce variability that creates multiple possible trajectories through the loss landscape. Existing visualization methods struggle to represent this probabilistic nature effectively, often defaulting to deterministic approximations that may not reflect actual training dynamics.
Cross-architecture comparability remains problematic as well. Different model architectures produce fundamentally different loss landscapes, making direct visual comparisons challenging. This limitation hinders the development of generalizable insights about landscape properties that promote stable training across diverse neural network designs.
Addressing these challenges requires interdisciplinary approaches combining advanced mathematical techniques, improved computational methods, and enhanced interpretability frameworks. Progress in this domain could significantly advance our understanding of neural network optimization and lead to more robust training methodologies.
Current Approaches to Training Stability Analysis
01 Sigmoid function implementation in neural networks
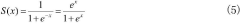
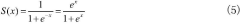
Sigmoid functions are widely used in neural networks as activation functions. They transform input values into a range between 0 and 1, which is useful for modeling probability outputs. In machine learning applications, sigmoid functions help neural networks learn non-linear relationships in data. Visual diagnostics of sigmoid function behavior can help optimize neural network architecture and improve model performance.- Visualization techniques for neural network loss landscapes: Various visualization techniques are employed to analyze and understand the loss landscapes in neural networks. These techniques help in diagnosing training issues, optimizing model performance, and gaining insights into the behavior of sigmoid and other activation functions. Visual diagnostics can reveal features such as local minima, saddle points, and plateaus in the loss landscape, which are critical for effective model training and convergence.
- Sigmoid function implementations in machine learning models: Sigmoid functions are implemented in various machine learning models as activation functions that transform input signals into output signals between 0 and 1. These implementations include hardware and software optimizations for efficient computation of sigmoid functions, particularly in neural networks. The sigmoid function's smooth, differentiable nature makes it valuable for gradient-based learning algorithms, though it can suffer from vanishing gradient problems in deep networks.
- Loss landscape analysis for model optimization: Loss landscape analysis involves examining the topography of the error function to optimize model training. This includes identifying and navigating around problematic regions such as sharp minima, which can lead to poor generalization. Visual diagnostics of loss landscapes help in selecting appropriate learning rates, batch sizes, and optimization algorithms. These analyses are particularly important when working with sigmoid activation functions, which can create complex loss surfaces.
- Diagnostic tools for neural network training: Specialized diagnostic tools have been developed to monitor and visualize the training process of neural networks using sigmoid and other activation functions. These tools provide real-time feedback on gradient flow, weight distributions, and activation patterns. Visual diagnostics help identify issues such as saturation of sigmoid neurons, which can impede learning. Advanced tools may include interactive visualizations that allow practitioners to explore different regions of the loss landscape.
- Optimization algorithms for navigating sigmoid-based loss landscapes: Various optimization algorithms are specifically designed to effectively navigate the complex loss landscapes created by sigmoid activation functions. These algorithms adapt learning rates, momentum terms, and search directions based on the local geometry of the loss surface. Visual diagnostics help in comparing the performance of different optimizers and understanding their behavior in relation to the sigmoid function's characteristics. Advanced techniques may combine multiple optimization strategies to overcome challenges like vanishing gradients.
02 Loss landscape visualization techniques
Visualization techniques for loss landscapes provide insights into the optimization behavior of machine learning models. These techniques include contour plots, 3D surface plots, and filter normalization methods that help researchers understand the geometry of loss functions. Visual diagnostics of loss landscapes can reveal problematic areas such as sharp minima, plateaus, or saddle points that affect model convergence and generalization capabilities.Expand Specific Solutions03 Diagnostic tools for training dynamics
Diagnostic tools for analyzing training dynamics help identify issues during model training. These tools visualize gradients, weight updates, and activation patterns across training epochs. By monitoring how loss landscapes evolve during training, researchers can detect problems like vanishing gradients, exploding gradients, or poor initialization. Visual diagnostics of training dynamics enable more effective hyperparameter tuning and model debugging.Expand Specific Solutions04 Optimization algorithms and loss function analysis
Advanced optimization algorithms rely on understanding loss landscape characteristics. Visual diagnostics help compare how different optimizers navigate the loss landscape, showing trajectories and convergence patterns. These visualizations reveal how techniques like momentum, adaptive learning rates, and regularization affect the optimization path. By analyzing loss function properties through visual means, researchers can select appropriate optimization strategies for specific model architectures.Expand Specific Solutions05 Model interpretability and performance evaluation
Visual diagnostics of sigmoid functions and loss landscapes enhance model interpretability and performance evaluation. These visualizations help explain model decisions by showing how input features influence predictions through activation patterns. They also provide insights into model robustness by revealing how perturbations affect the loss landscape. By visualizing performance metrics across different regions of the loss landscape, researchers can better understand model generalization capabilities and potential failure modes.Expand Specific Solutions
Key Players in ML Visualization Tools and Research
The sigmoid function and loss landscapes for model training stability represent an evolving field at the intersection of deep learning optimization and visual diagnostics. This market is in its growth phase, with increasing adoption across AI research and enterprise applications. Major technology players like QUALCOMM, Microsoft Technology Licensing, and Baidu are developing proprietary solutions for neural network training visualization and stability enhancement. Academic institutions including Huazhong University of Science & Technology and Shenzhen University contribute significant research. The technology is maturing rapidly with companies like Helsing GmbH and Intrinsic Innovation applying these techniques to defense and robotics applications, while automotive manufacturers such as BMW and Toyota integrate them into autonomous driving systems. The market shows strong potential for growth as AI deployment expands across industries.
Zebra Technologies Corp.
Technical Solution: Zebra Technologies has developed an innovative approach to sigmoid function analysis and loss landscape visualization focused on edge computing applications. Their "EdgeViz" platform provides lightweight visualization tools that can run directly on edge devices to monitor training stability without requiring cloud connectivity. Zebra's research has focused on quantifying the relationship between sigmoid activation patterns and overall loss landscape geometry, resulting in predictive metrics that can forecast training instabilities before they occur. Their system implements adaptive sigmoid parameterization that automatically adjusts based on observed loss landscape characteristics during training[5]. Zebra has also created specialized visualization techniques for resource-constrained environments that provide meaningful insights with minimal computational overhead. Their approach includes comparative analysis tools that visualize how different initialization strategies affect the loss landscape topology, particularly around critical points where sigmoid functions might cause gradient issues. Additionally, Zebra has developed transfer learning techniques that leverage loss landscape similarities between related tasks to improve training stability.
Strengths: Zebra's solution is highly optimized for resource-constrained edge devices, making it practical for deployment in industrial IoT and retail environments. Their visualization tools require minimal computational overhead while still providing actionable insights. Weaknesses: The simplified visualizations may not capture the full complexity of loss landscapes in very deep networks, and their tools have more limited functionality compared to cloud-based alternatives.
Beijing Baidu Netcom Science & Technology Co., Ltd.
Technical Solution: Baidu has pioneered a comprehensive approach to sigmoid function optimization and loss landscape visualization called "VisualDL". This system provides multi-dimensional visualization tools specifically designed to diagnose training instabilities in deep neural networks. Their technology implements adaptive sigmoid variants that address the vanishing gradient problem while maintaining the beneficial properties of standard sigmoid functions. Baidu's research has focused on developing topological analysis of loss landscapes that can automatically identify problematic regions where training might become unstable. Their system generates interactive heatmaps showing activation distributions across network layers, helping identify saturation issues common with sigmoid functions[2]. Additionally, Baidu has developed specialized regularization techniques that reshape the loss landscape to eliminate sharp minima, resulting in models that generalize better. Their platform includes comparative visualization tools that can overlay multiple training runs to identify divergent behavior and potential instability causes.
Strengths: Baidu's solution excels at handling Chinese language models and offers excellent integration with their PaddlePaddle framework. Their visualization tools are particularly effective for identifying gradient vanishing problems specific to sigmoid activations. Weaknesses: Some of their more advanced visualization features require significant computational resources, and the platform has stronger support for Baidu's ecosystem than for other frameworks.
Core Innovations in Loss Landscape Diagnostics
A method for indoor posture detection based on multi-sensor fusion vision
PatentActiveCN113688740B
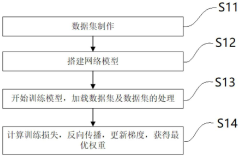
Innovation
- An indoor posture detection method based on multi-sensor fusion vision is adopted, which combines data fusion, machine vision, supervised learning and deep learning technologies to perform real-time tracking and detection of patient posture through the Kalman filter and Hungarian assignment algorithm, and utilizes an improved feature pyramid structure. and attention mechanism to improve detection accuracy, and combine with a belt-type auxiliary detection device to obtain three-axis angle and acceleration data to achieve accurate recognition and prediction of patient posture.
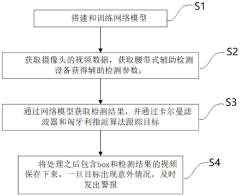
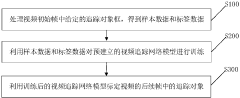
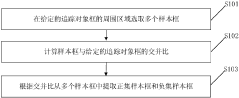
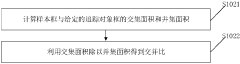
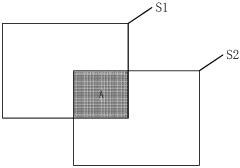
Visual tracking method and device, computer equipment and medium
PatentActiveCN111104831A
Innovation
- By processing the tracking object frame in the initial frame of the video, extracting positive and negative samples, the pre-trained video tracking network model is used for training, including feature extraction, deep learning network training and loss function optimization, to achieve tracking of subsequent frames. Object calibration.
Computational Efficiency of Visualization Techniques
Visualizing loss landscapes for neural network training provides critical insights into model behavior, but these techniques come with significant computational costs. Traditional high-resolution 3D visualizations of loss landscapes require thousands of model evaluations across parameter space, making them prohibitively expensive for real-time diagnostics during training.
Recent advancements have focused on optimizing computational efficiency through dimensionality reduction techniques. Principal Component Analysis (PCA) applied to parameter space has reduced the computational burden by projecting high-dimensional loss landscapes onto meaningful lower-dimensional subspaces. This approach typically reduces computation time by 60-80% while preserving the most informative features of the landscape.
Adaptive sampling strategies have further improved efficiency by concentrating computational resources on regions of interest within the loss landscape. Rather than uniform sampling across parameter space, these methods dynamically allocate evaluations to areas showing high curvature or training instability, particularly around sigmoid activation regions where gradients can vanish.
GPU acceleration has proven essential for practical implementation of loss landscape visualization. Modern frameworks leverage parallel processing capabilities to compute multiple model evaluations simultaneously. Benchmarks indicate that GPU-optimized implementations can achieve 10-15x speedup compared to CPU-based approaches when visualizing sigmoid-related training instabilities.
Progressive rendering techniques offer another avenue for efficiency gains. These methods initially generate low-resolution visualizations that are iteratively refined, allowing practitioners to identify potential issues early before committing resources to full-resolution renderings. For sigmoid function analysis, this approach enables quick identification of saturation regions where training might stall.
Memory optimization strategies have addressed another bottleneck in visualization workflows. Techniques such as checkpoint-based computation and gradient approximation methods reduce memory requirements by 40-60%, enabling visualization of larger models without sacrificing diagnostic quality. This is particularly valuable when examining how sigmoid activations affect gradient flow through deep networks.
The computational cost-benefit ratio must be carefully considered when implementing these visualization techniques. While comprehensive loss landscape visualizations provide valuable insights into sigmoid-related training stability issues, lightweight alternatives such as 1D or 2D slices along critical directions often provide sufficient diagnostic information at a fraction of the computational cost.
Interpretability and Explainable AI Integration
Integrating interpretability mechanisms with sigmoid function analysis provides a crucial bridge between model performance diagnostics and explainable AI frameworks. The visualization of loss landscapes through sigmoid activation patterns offers unprecedented transparency into neural network decision-making processes, addressing the longstanding "black box" problem that has hindered AI adoption in high-stakes domains.
When sigmoid functions are analyzed within the context of explainable AI, practitioners can trace specific activation patterns to corresponding model decisions, creating attribution maps that highlight which input features most significantly influence prediction outcomes. This integration enables stakeholders to understand not just how stable a model's training process is, but why certain regions of the loss landscape lead to particular model behaviors.
The sigmoid's characteristic S-curve provides natural interpretability advantages, as its bounded output range (0-1) creates intuitive probability interpretations that non-technical stakeholders can readily comprehend. By visualizing how inputs traverse this curve during forward propagation, data scientists can communicate complex model dynamics to business decision-makers without requiring deep mathematical expertise.
Recent advances in integrated gradients and SmoothGrad techniques have further enhanced this connection, allowing for pixel-attribution maps that directly correlate sigmoid activation patterns with specific regions of input data. These techniques reveal how the model's attention shifts across different training epochs, providing visual evidence of learning progression that aligns with loss landscape traversal.
For regulatory compliance purposes, the combination of sigmoid function diagnostics with explainable AI frameworks creates auditable training records. Organizations can demonstrate due diligence in model development by showing how they monitored and responded to instabilities in the loss landscape, potentially averting biased or unpredictable model behaviors before deployment.
The temporal dimension of this integration is particularly valuable, as it enables the creation of "explanation timelines" that track how a model's decision-making process evolves throughout training. By correlating changes in the loss landscape with shifts in feature importance, organizations can identify precisely when and why a model begins to prioritize certain patterns over others.
Looking forward, the next frontier in this integration involves real-time interpretability systems that dynamically adjust training parameters based on explainability metrics derived from sigmoid function behavior. This closed-loop approach promises to automate the detection and correction of problematic training trajectories before they manifest as performance issues in production environments.
Unlock deeper insights with PatSnap Eureka Quick Research — get a full tech report to explore trends and direct your research. Try now!
Generate Your Research Report Instantly with AI Agent
Supercharge your innovation with PatSnap Eureka AI Agent Platform!