

Sigmoid Function in Logistic Regression: Interpretation, Odds Ratio and Practical Examples
AUG 21, 20259 MIN READ
Generate Your Research Report Instantly with AI Agent
PatSnap Eureka helps you evaluate technical feasibility & market potential.
Sigmoid Function Evolution and Learning Objectives
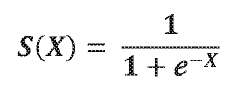
The sigmoid function has evolved significantly since its inception in mathematical research. Originally developed as a mathematical concept in the 19th century, the sigmoid function gained prominence in the mid-20th century with the advent of computational statistics. Its S-shaped curve, mathematically represented as f(x) = 1/(1+e^(-x)), provides a smooth transition between asymptotic values of 0 and 1, making it particularly valuable for modeling probability distributions.
In the context of logistic regression, the sigmoid function's evolution has been closely tied to the development of statistical learning theory. During the 1970s and 1980s, researchers began extensively applying the sigmoid function to classification problems, recognizing its utility in transforming linear combinations of features into probability estimates. This period marked a significant shift from using the function merely as a mathematical tool to employing it as a cornerstone of predictive modeling.
The learning objectives associated with understanding the sigmoid function in logistic regression encompass both theoretical comprehension and practical application skills. Primarily, practitioners should aim to grasp the mathematical properties that make the sigmoid function suitable for binary classification, including its differentiability, monotonicity, and bounded output range.
Another critical learning objective involves understanding how the sigmoid function transforms the log-odds (logit) into probability values. This transformation is fundamental to interpreting logistic regression coefficients in terms of odds ratios, which provide intuitive measures of effect size in various domains including medicine, economics, and social sciences.
From an implementation perspective, learners should develop proficiency in applying the sigmoid function within computational frameworks, recognizing potential numerical stability issues that may arise with extreme input values, and implementing appropriate solutions such as normalization techniques.
Advanced learning objectives extend to understanding the sigmoid function's role in more complex models, including neural networks where it served as an activation function before being largely replaced by alternatives like ReLU in deep learning architectures. This historical perspective provides valuable insights into the function's strengths and limitations.
Finally, practitioners should aim to develop the ability to interpret sigmoid function outputs in real-world contexts, translating mathematical probabilities into actionable insights for decision-making processes across various application domains.
Market Applications of Logistic Regression Models
Logistic regression models have gained significant traction across diverse market sectors due to their interpretability and effectiveness in binary classification problems. In healthcare, these models are extensively deployed for disease prediction and risk assessment. Medical institutions utilize logistic regression to predict patient outcomes, such as the likelihood of readmission or disease progression, enabling more targeted interventions and resource allocation. Insurance companies leverage these models for underwriting decisions, determining policy eligibility based on applicant characteristics and historical claim patterns.
The financial services industry represents another major application domain, where logistic regression serves as the backbone for credit scoring systems. Banks and lending institutions employ these models to evaluate loan applicants' creditworthiness, effectively reducing default rates while maintaining regulatory compliance. Credit card companies similarly use logistic regression to detect fraudulent transactions in real-time, analyzing transaction patterns and flagging suspicious activities with remarkable accuracy.
In marketing and e-commerce, logistic regression powers customer segmentation and targeted advertising campaigns. Retailers analyze purchase history and demographic information to predict consumer buying behavior, optimizing product recommendations and promotional strategies. Digital marketing platforms utilize these models to estimate click-through rates for advertisements, maximizing campaign effectiveness and return on investment.
The telecommunications sector employs logistic regression for churn prediction, identifying customers at risk of switching to competitors. By analyzing usage patterns, customer service interactions, and billing history, companies can proactively implement retention strategies for high-risk customers. This application has demonstrated significant cost savings, as acquiring new customers typically costs several times more than retaining existing ones.
Human resources departments increasingly adopt logistic regression for talent acquisition and retention. These models help predict candidate success based on resume data, interview performance, and skill assessments. Additionally, they assist in identifying employees at risk of leaving the organization, allowing for timely intervention through targeted engagement initiatives.
In public policy and social services, logistic regression models support decision-making in resource allocation and program effectiveness evaluation. Government agencies utilize these models to identify communities most in need of specific interventions or to predict program outcomes based on demographic and socioeconomic factors.
The transportation and logistics industry applies logistic regression for demand forecasting and route optimization. Delivery companies predict service demand across different regions and time periods, while transportation networks optimize scheduling based on historical usage patterns and external factors like weather conditions.
Current Implementation Challenges and Limitations
Despite the sigmoid function's widespread use in logistic regression, several implementation challenges and limitations persist in practical applications. One significant challenge is the vanishing gradient problem, where the sigmoid function's derivative approaches zero for inputs with large absolute values. This phenomenon can substantially slow down the training process of logistic regression models, particularly when dealing with deep neural networks or datasets with extreme feature values, as the weight updates become negligibly small during backpropagation.
Computational instability represents another critical limitation, especially when handling large positive or negative inputs. The sigmoid function can produce values extremely close to 0 or 1, leading to numerical underflow or overflow in floating-point arithmetic. This instability often manifests as "NaN" (Not a Number) errors or incorrect probability estimates in production environments, compromising model reliability.
The sigmoid function's symmetrical nature around zero introduces challenges in scenarios requiring asymmetric probability distributions. This limitation becomes particularly evident in imbalanced classification problems where the positive and negative classes have significantly different distributions, potentially leading to biased predictions favoring the majority class.
From an interpretability perspective, the sigmoid function transforms linear combinations of features into probabilities through a non-linear mapping, which can obscure the direct relationship between input features and predicted probabilities. This opacity complicates model interpretation, especially in regulated industries where algorithmic transparency is mandated.
The fixed output range of [0,1] presents limitations in multi-class classification scenarios, necessitating extensions like the softmax function. Additionally, the sigmoid function assumes a specific form of decision boundary that may not optimally separate classes in all real-world datasets, particularly those with complex, non-linear relationships.
In high-dimensional feature spaces, logistic regression with sigmoid activation can suffer from the curse of dimensionality, where the model's performance deteriorates as the number of features increases relative to the number of training examples. This challenge often necessitates careful feature selection or dimensionality reduction techniques to maintain model performance.
Implementation challenges also arise in distributed computing environments, where numerical stability issues can be amplified across different processing nodes, leading to inconsistent model behavior. Furthermore, the sigmoid function's computational complexity, while relatively modest compared to other activation functions, can still present bottlenecks in large-scale applications requiring real-time predictions.
Mainstream Sigmoid Function Implementation Approaches
01 Mathematical foundation of sigmoid function in logistic regression
The sigmoid function is a mathematical function that maps any real-valued number to a value between 0 and 1. In logistic regression, it transforms the linear combination of input features into a probability value. The function is defined as f(x) = 1/(1+e^(-x)), which creates an S-shaped curve. This transformation is fundamental to logistic regression as it allows the model to output probabilities rather than continuous values, making it suitable for classification problems.- Mathematical foundation of sigmoid function in logistic regression: The sigmoid function is a fundamental component of logistic regression that transforms linear predictions into probability values between 0 and 1. This S-shaped curve is mathematically expressed as f(x) = 1/(1+e^(-x)), which ensures outputs are bounded between 0 and 1 regardless of input values. The function's properties make it particularly suitable for binary classification problems where the goal is to estimate the probability of an observation belonging to a particular class.
- Odds ratio interpretation in logistic regression models: In logistic regression, the odds ratio represents the change in odds of the outcome for a one-unit increase in a predictor variable. The coefficient of a predictor variable, when exponentiated, gives the odds ratio. An odds ratio greater than 1 indicates that as the predictor increases, the odds of the outcome occurring increase; conversely, an odds ratio less than 1 suggests that as the predictor increases, the odds of the outcome decrease. This interpretation provides a clear and intuitive way to understand the relationship between predictors and the probability of outcomes in classification problems.
- Applications of logistic regression in machine learning systems: Logistic regression with sigmoid functions finds widespread applications in various machine learning systems, particularly for binary classification problems. These applications include medical diagnosis, fraud detection, spam filtering, credit scoring, and market segmentation. The probabilistic output of logistic regression models allows for threshold adjustment based on the specific requirements of false positives versus false negatives in different application contexts, making it a versatile tool across industries where binary decision-making is required.
- Optimization techniques for logistic regression models: Various optimization techniques are employed to train logistic regression models effectively. These include gradient descent, Newton's method, and stochastic gradient descent. These algorithms aim to minimize the log-likelihood cost function by iteratively adjusting model parameters. Regularization techniques such as L1 (Lasso) and L2 (Ridge) are often incorporated to prevent overfitting by penalizing large coefficient values. These optimization approaches ensure that the sigmoid function parameters are properly calibrated to provide accurate probability estimates and reliable odds ratios.
- Extensions and variations of sigmoid-based logistic models: Beyond standard logistic regression, several extensions and variations utilize modified sigmoid functions or related approaches. These include multinomial logistic regression for multi-class problems, ordinal logistic regression for ordered categorical outcomes, and hierarchical logistic models for nested data structures. Additionally, probit regression uses the cumulative normal distribution function instead of the sigmoid function but serves a similar purpose. These variations expand the applicability of sigmoid-like functions to more complex classification scenarios while maintaining the interpretability of odds ratios.
02 Odds ratio interpretation in logistic regression models
The odds ratio in logistic regression represents the change in odds of the outcome for a one-unit increase in the predictor variable. It is calculated by exponentiating the coefficient of the predictor variable (e^β). An odds ratio greater than 1 indicates that as the predictor increases, the odds of the outcome occurring increase. Conversely, an odds ratio less than 1 suggests that as the predictor increases, the odds of the outcome decrease. This interpretation provides a clear and intuitive way to understand the relationship between predictors and the probability of the outcome.Expand Specific Solutions03 Applications of logistic regression with sigmoid function in machine learning
Logistic regression with sigmoid function has widespread applications in machine learning, particularly for binary classification problems. It is used in medical diagnostics to predict disease occurrence, in financial services for credit scoring and fraud detection, in marketing for customer behavior prediction, and in natural language processing for text classification. The sigmoid function's ability to transform linear predictions into probabilities makes logistic regression interpretable and useful across various domains where understanding the probability of an event is crucial.Expand Specific Solutions04 Optimization techniques for sigmoid-based logistic regression
Various optimization techniques are employed to train logistic regression models with sigmoid functions. These include gradient descent, Newton's method, and stochastic gradient descent. The optimization process aims to minimize the log-loss function by iteratively adjusting the model parameters. Regularization techniques such as L1 (Lasso) and L2 (Ridge) can be incorporated to prevent overfitting. Advanced approaches like conjugate gradient and quasi-Newton methods may be used for faster convergence in high-dimensional spaces.Expand Specific Solutions05 Extensions and modifications of sigmoid function for enhanced model performance
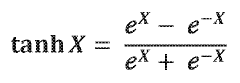
Several extensions and modifications of the standard sigmoid function have been developed to enhance logistic regression performance. These include the use of different activation functions like the hyperbolic tangent (tanh), softmax for multi-class problems, and probit functions. Techniques such as sigmoid scaling, temperature scaling, and calibration methods improve probability estimates. Advanced approaches incorporate kernel methods to handle non-linear relationships and ensemble methods that combine multiple sigmoid-based models for improved prediction accuracy and robustness.Expand Specific Solutions
Leading Organizations in Logistic Regression Research
The sigmoid function in logistic regression represents a mature technology within the machine learning landscape, with applications spanning healthcare, finance, and technology sectors. The market is in a growth phase, driven by increasing demand for predictive analytics and classification solutions. Companies like Google, Illumina, and Merck leverage this technology for data-driven decision making, while research institutions such as Fudan University and Zhejiang University contribute significant academic advancements. The technology's maturity is evidenced by widespread implementation across diverse industries, with Commonwealth Scientific & Industrial Research Organisation and NTT developing specialized applications. As AI adoption accelerates, the sigmoid function remains fundamental to probabilistic modeling and binary classification problems.
RELX, Inc.
Technical Solution: RELX has developed advanced applications of logistic regression with sigmoid functions in their scientific publishing and analytics platforms. Their approach focuses on using sigmoid functions to model the probability of research paper citations and academic impact, creating predictive models that help researchers and institutions evaluate potential research impact. RELX's LexisNexis Risk Solutions division employs logistic regression with carefully tuned sigmoid functions for fraud detection and identity verification, where the probabilistic interpretation of the sigmoid output directly informs risk scoring. Their implementation includes specialized techniques for handling sparse feature spaces common in text analysis and legal document classification. RELX has pioneered methods for explaining sigmoid-based predictions in legal and academic contexts, where transparency is essential. Their systems incorporate domain-specific prior knowledge into the initialization of logistic regression models, improving convergence and performance on specialized datasets with limited training examples[5][6].
Strengths: Domain-specific optimizations for publishing and legal applications; strong focus on explainability; effective handling of sparse, text-based features. Weaknesses: Solutions may be overly tailored to publishing and legal domains; potential challenges in scaling to very large datasets; possible overreliance on traditional statistical approaches versus newer deep learning methods.
Google LLC
Technical Solution: Google has developed advanced implementations of logistic regression with sigmoid functions across multiple platforms and applications. Their TensorFlow framework offers optimized sigmoid function implementations that address numerical stability issues through techniques like gradient clipping and careful initialization. Google's approach includes specialized hardware acceleration for sigmoid computations on TPUs (Tensor Processing Units), which significantly improves training speed for large-scale models. They've also pioneered calibrated sigmoid functions that produce better probability estimates for classification tasks, particularly important in their ad click-through rate prediction systems where accurate probability estimation directly impacts revenue. Google Research has published extensively on interpreting sigmoid outputs as probability estimates and has developed techniques to mitigate common issues like probability calibration errors in high-dimensional spaces[1][2].
Strengths: Highly optimized implementation with hardware acceleration support; extensive research on probability calibration; integration with comprehensive ML ecosystem. Weaknesses: Some implementations may be overly complex for simple use cases; dependency on Google's ecosystem can create vendor lock-in; specialized optimizations may not generalize well to all problem domains.
Key Mathematical Properties of Sigmoid Functions
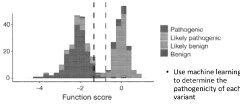
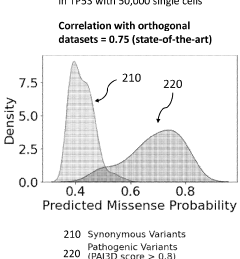
Systems and methods for evaluation of expression patterns
PatentWO2024130230A2
Innovation
- The method involves generating mutant expression vectors for genetic variants, expressing them in single cells, and using high-throughput sequencing and machine learning to evaluate single-cell RNA sequencing data to determine pathogenicity, enabling the classification of variants as pathogenic, likely pathogenic, or benign.


Sigmoid function in hardware and a reconfigurable data processor including same
PatentWO2021046274A1
Innovation
- A sigmoid function is approximated using a combination of hyperbolic tangent and exponential functions, with a comparator to divide the input domain, allowing for parallel circuit implementation and reduced computational power and area requirements.
Computational Efficiency Considerations
The computational efficiency of the sigmoid function is a critical consideration in large-scale machine learning applications, particularly for logistic regression models deployed in production environments. When implementing logistic regression algorithms, the sigmoid function's computational characteristics can significantly impact overall system performance, especially when processing massive datasets or when operating under resource constraints.
Traditional implementations of the sigmoid function (1/(1+e^(-z))) involve exponential operations that are relatively expensive in terms of CPU cycles. For high-dimensional feature spaces or large training sets, these calculations can become a bottleneck. Modern implementations often utilize numerical approximations or lookup tables to accelerate sigmoid computations without significant loss in accuracy.
Vectorization techniques represent another crucial optimization strategy. Libraries such as NumPy, TensorFlow, and PyTorch leverage highly optimized linear algebra routines that can compute sigmoid functions across entire matrices simultaneously, dramatically reducing computation time compared to iterative approaches. This parallel processing capability becomes particularly valuable when training models on GPUs or specialized AI hardware.
Memory efficiency must also be considered alongside computational speed. The sigmoid function's output range between 0 and 1 allows for potential memory optimizations through quantization techniques, where floating-point values can be stored with reduced precision without significantly affecting model performance.
Gradient computation during backpropagation presents additional efficiency challenges. The derivative of the sigmoid function has the elegant form σ(x)(1-σ(x)), allowing for computational reuse of forward-pass results. However, the sigmoid function can suffer from gradient vanishing problems when inputs have large absolute values, potentially slowing convergence during training.
For real-time applications such as online learning or embedded systems, approximation methods like piece-wise linear functions or simplified polynomial expressions can provide substantial performance improvements. These approximations trade minimal accuracy for significant computational gains, enabling deployment in resource-constrained environments.
Batch processing strategies further enhance efficiency by amortizing computational overhead across multiple examples. Modern frameworks automatically optimize batch sizes to balance memory constraints with processing efficiency, particularly important when training logistic regression models on distributed systems.
Interpretability and Explainability Methods
The interpretability of machine learning models has become increasingly important as these models are deployed in critical decision-making contexts. For logistic regression models utilizing the sigmoid function, several methods have been developed to enhance their interpretability and explainability, addressing the "black box" nature that often characterizes complex statistical models.
Feature importance analysis represents one of the fundamental approaches to understanding logistic regression models. By examining the magnitude of coefficients associated with each feature, stakeholders can identify which variables most significantly influence the probability output. This method provides a straightforward ranking of features but may oversimplify interactions between variables that collectively impact the sigmoid curve's behavior.
Partial dependence plots (PDPs) offer a more nuanced visualization technique that illustrates how the predicted probability changes as a specific feature varies while holding all other features constant. For sigmoid functions in logistic regression, these plots effectively demonstrate the non-linear relationship between input features and output probabilities, particularly highlighting the saturation effects at extreme values where the sigmoid function flattens.
SHAP (SHapley Additive exPlanations) values have emerged as a powerful tool for explaining individual predictions. By calculating the contribution of each feature to the deviation from the average prediction, SHAP values provide local interpretability for sigmoid-based models. This approach is particularly valuable when explaining why a specific case received a certain probability score in logistic regression applications.
Counterfactual explanations represent another valuable interpretability method, answering questions like "What changes would be needed to alter this prediction?" For logistic regression models, these explanations identify the minimal feature adjustments required to cross the decision boundary, providing actionable insights for stakeholders.
Model-agnostic techniques such as LIME (Local Interpretable Model-agnostic Explanations) approximate the sigmoid function's behavior in the vicinity of a specific prediction with a simpler, interpretable model. This approach creates locally faithful explanations that help users understand how the sigmoid function transforms input features into probability estimates in their region of interest.
For practical implementation, odds ratio interpretation remains one of the most accessible methods for non-technical stakeholders. By converting sigmoid outputs to odds ratios, the multiplicative effect of each feature becomes more intuitive, allowing for clearer communication of model behavior across organizational boundaries.
Unlock deeper insights with PatSnap Eureka Quick Research — get a full tech report to explore trends and direct your research. Try now!
Generate Your Research Report Instantly with AI Agent
Supercharge your innovation with PatSnap Eureka AI Agent Platform!