
Tools for objectively determining severity of systemic sclerosis
Patent Information
- Authority / Receiving Office
- US · United States
- Current Assignee / Owner
- Publication Date
- 2011-08-04
- Estimated Expiration
- Not applicable · inactive patent
Smart Images
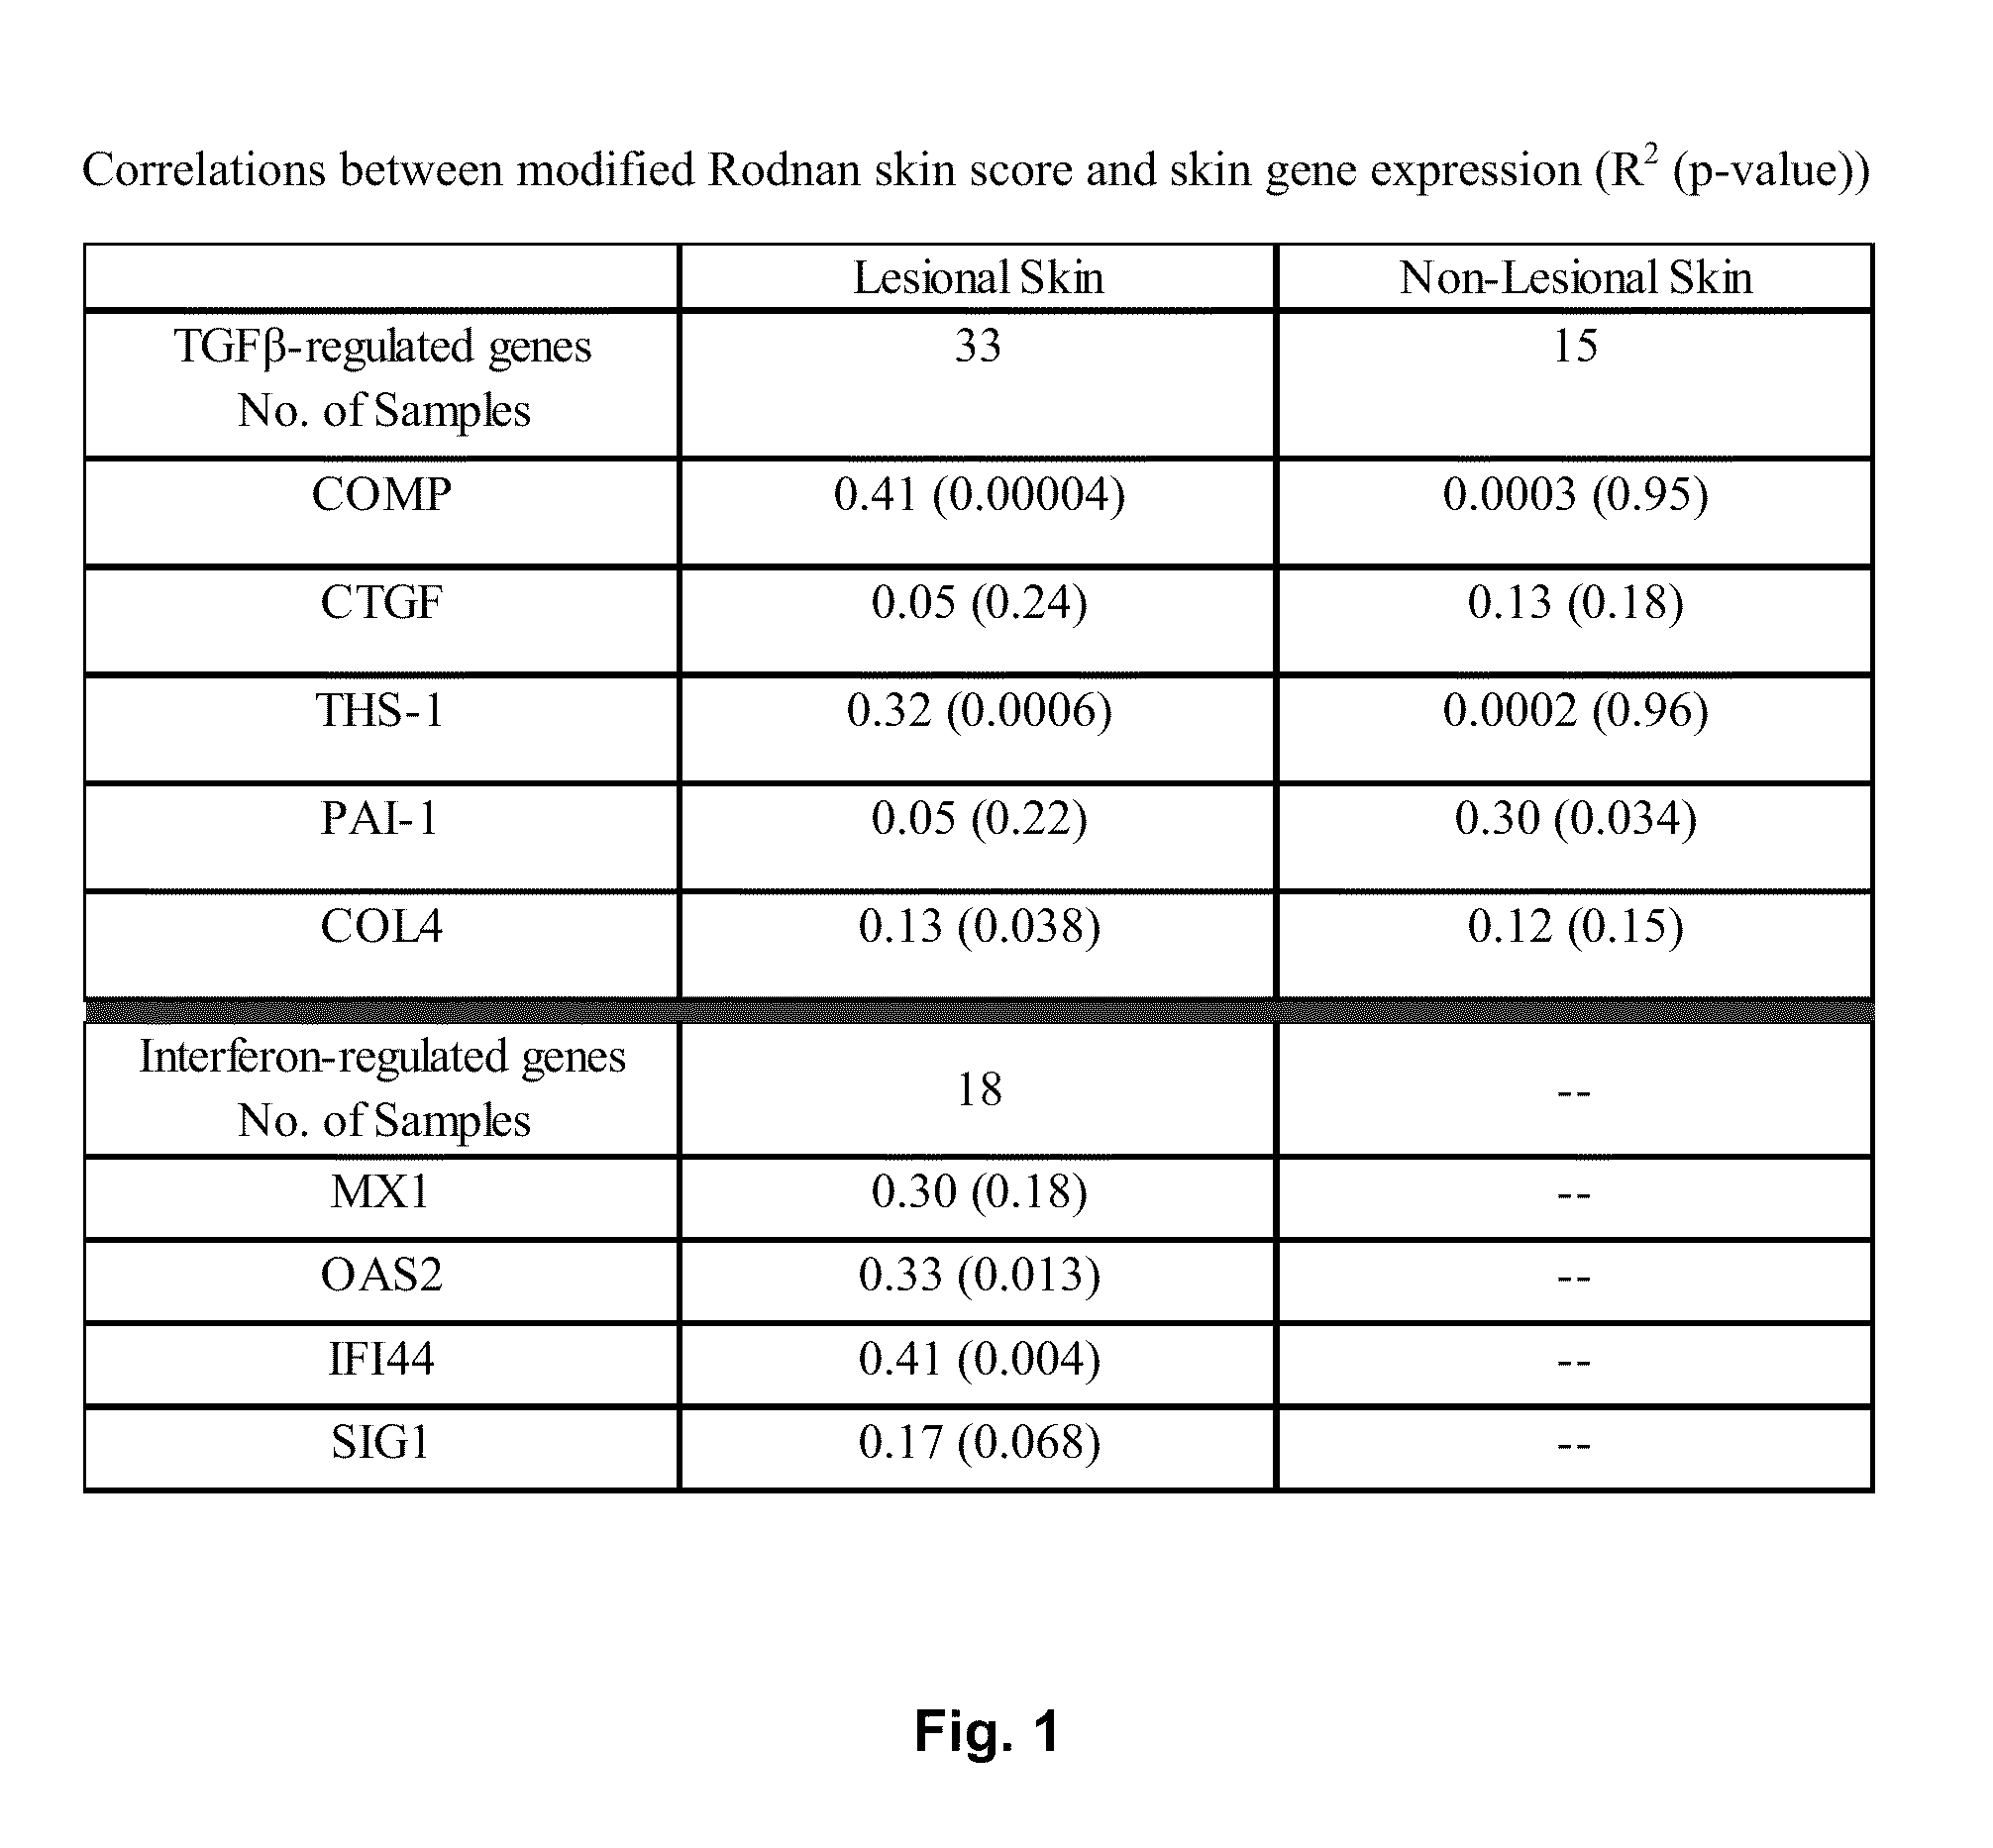
Figure 1 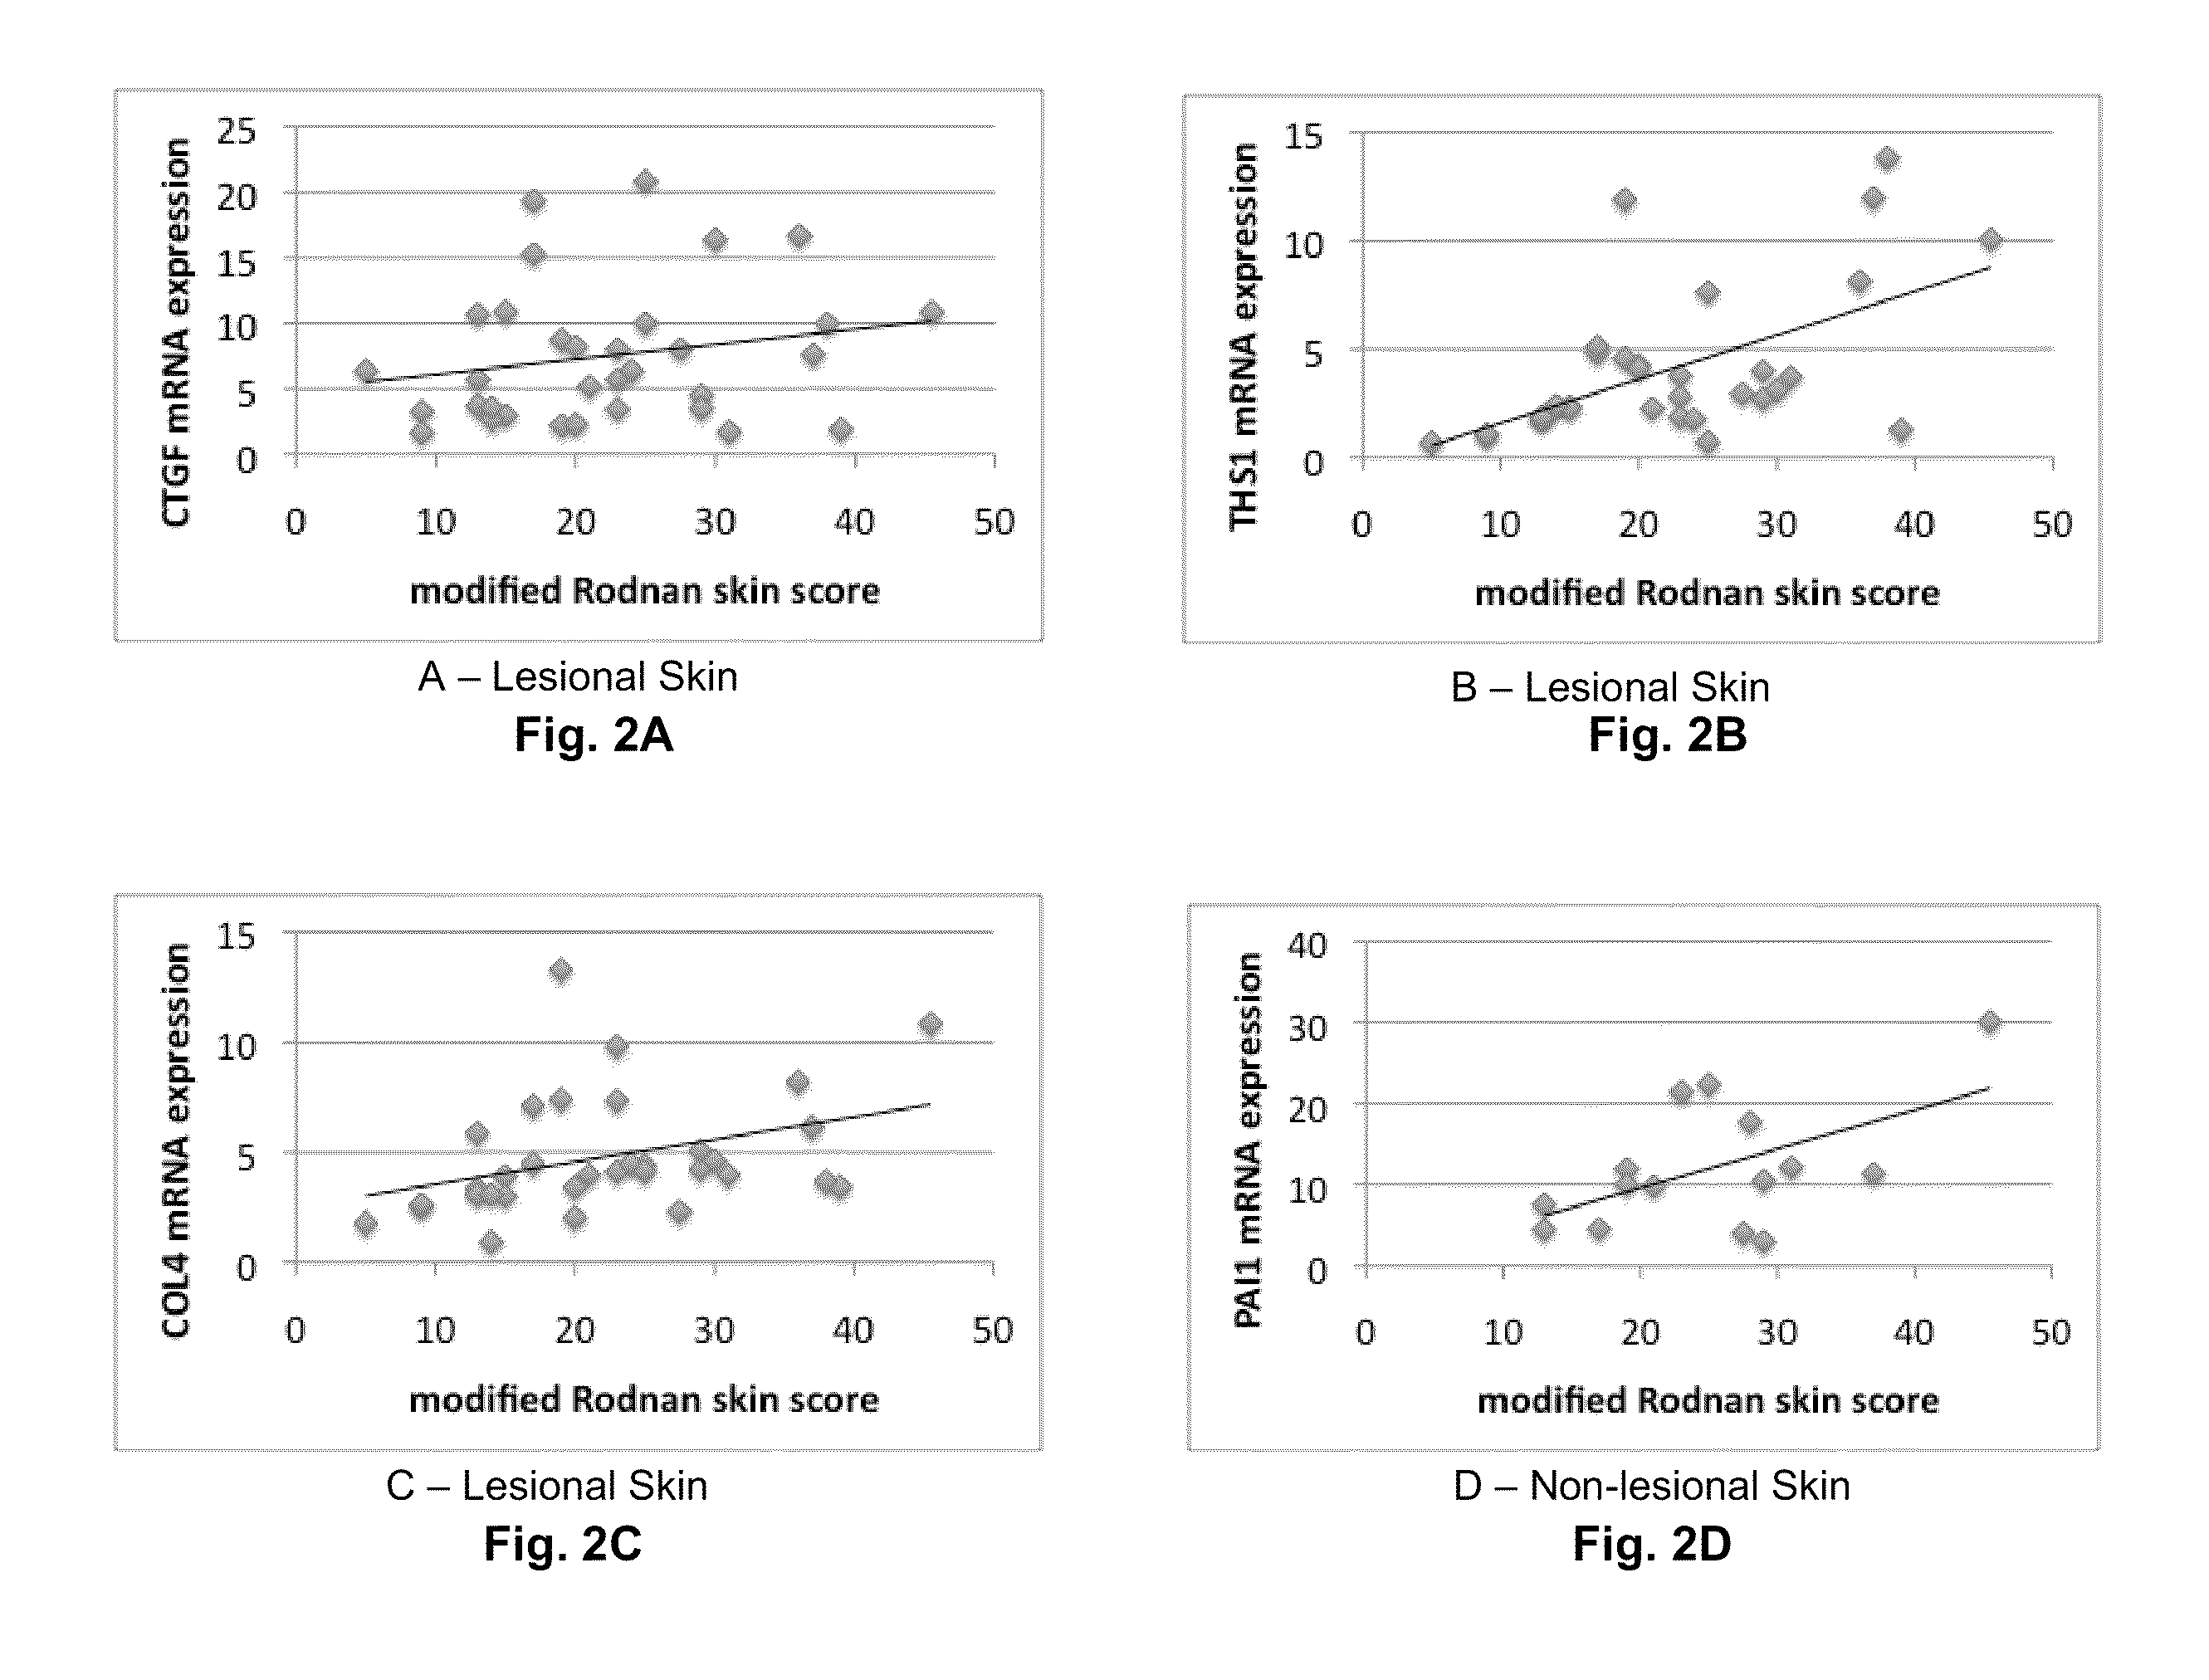
Figure 2 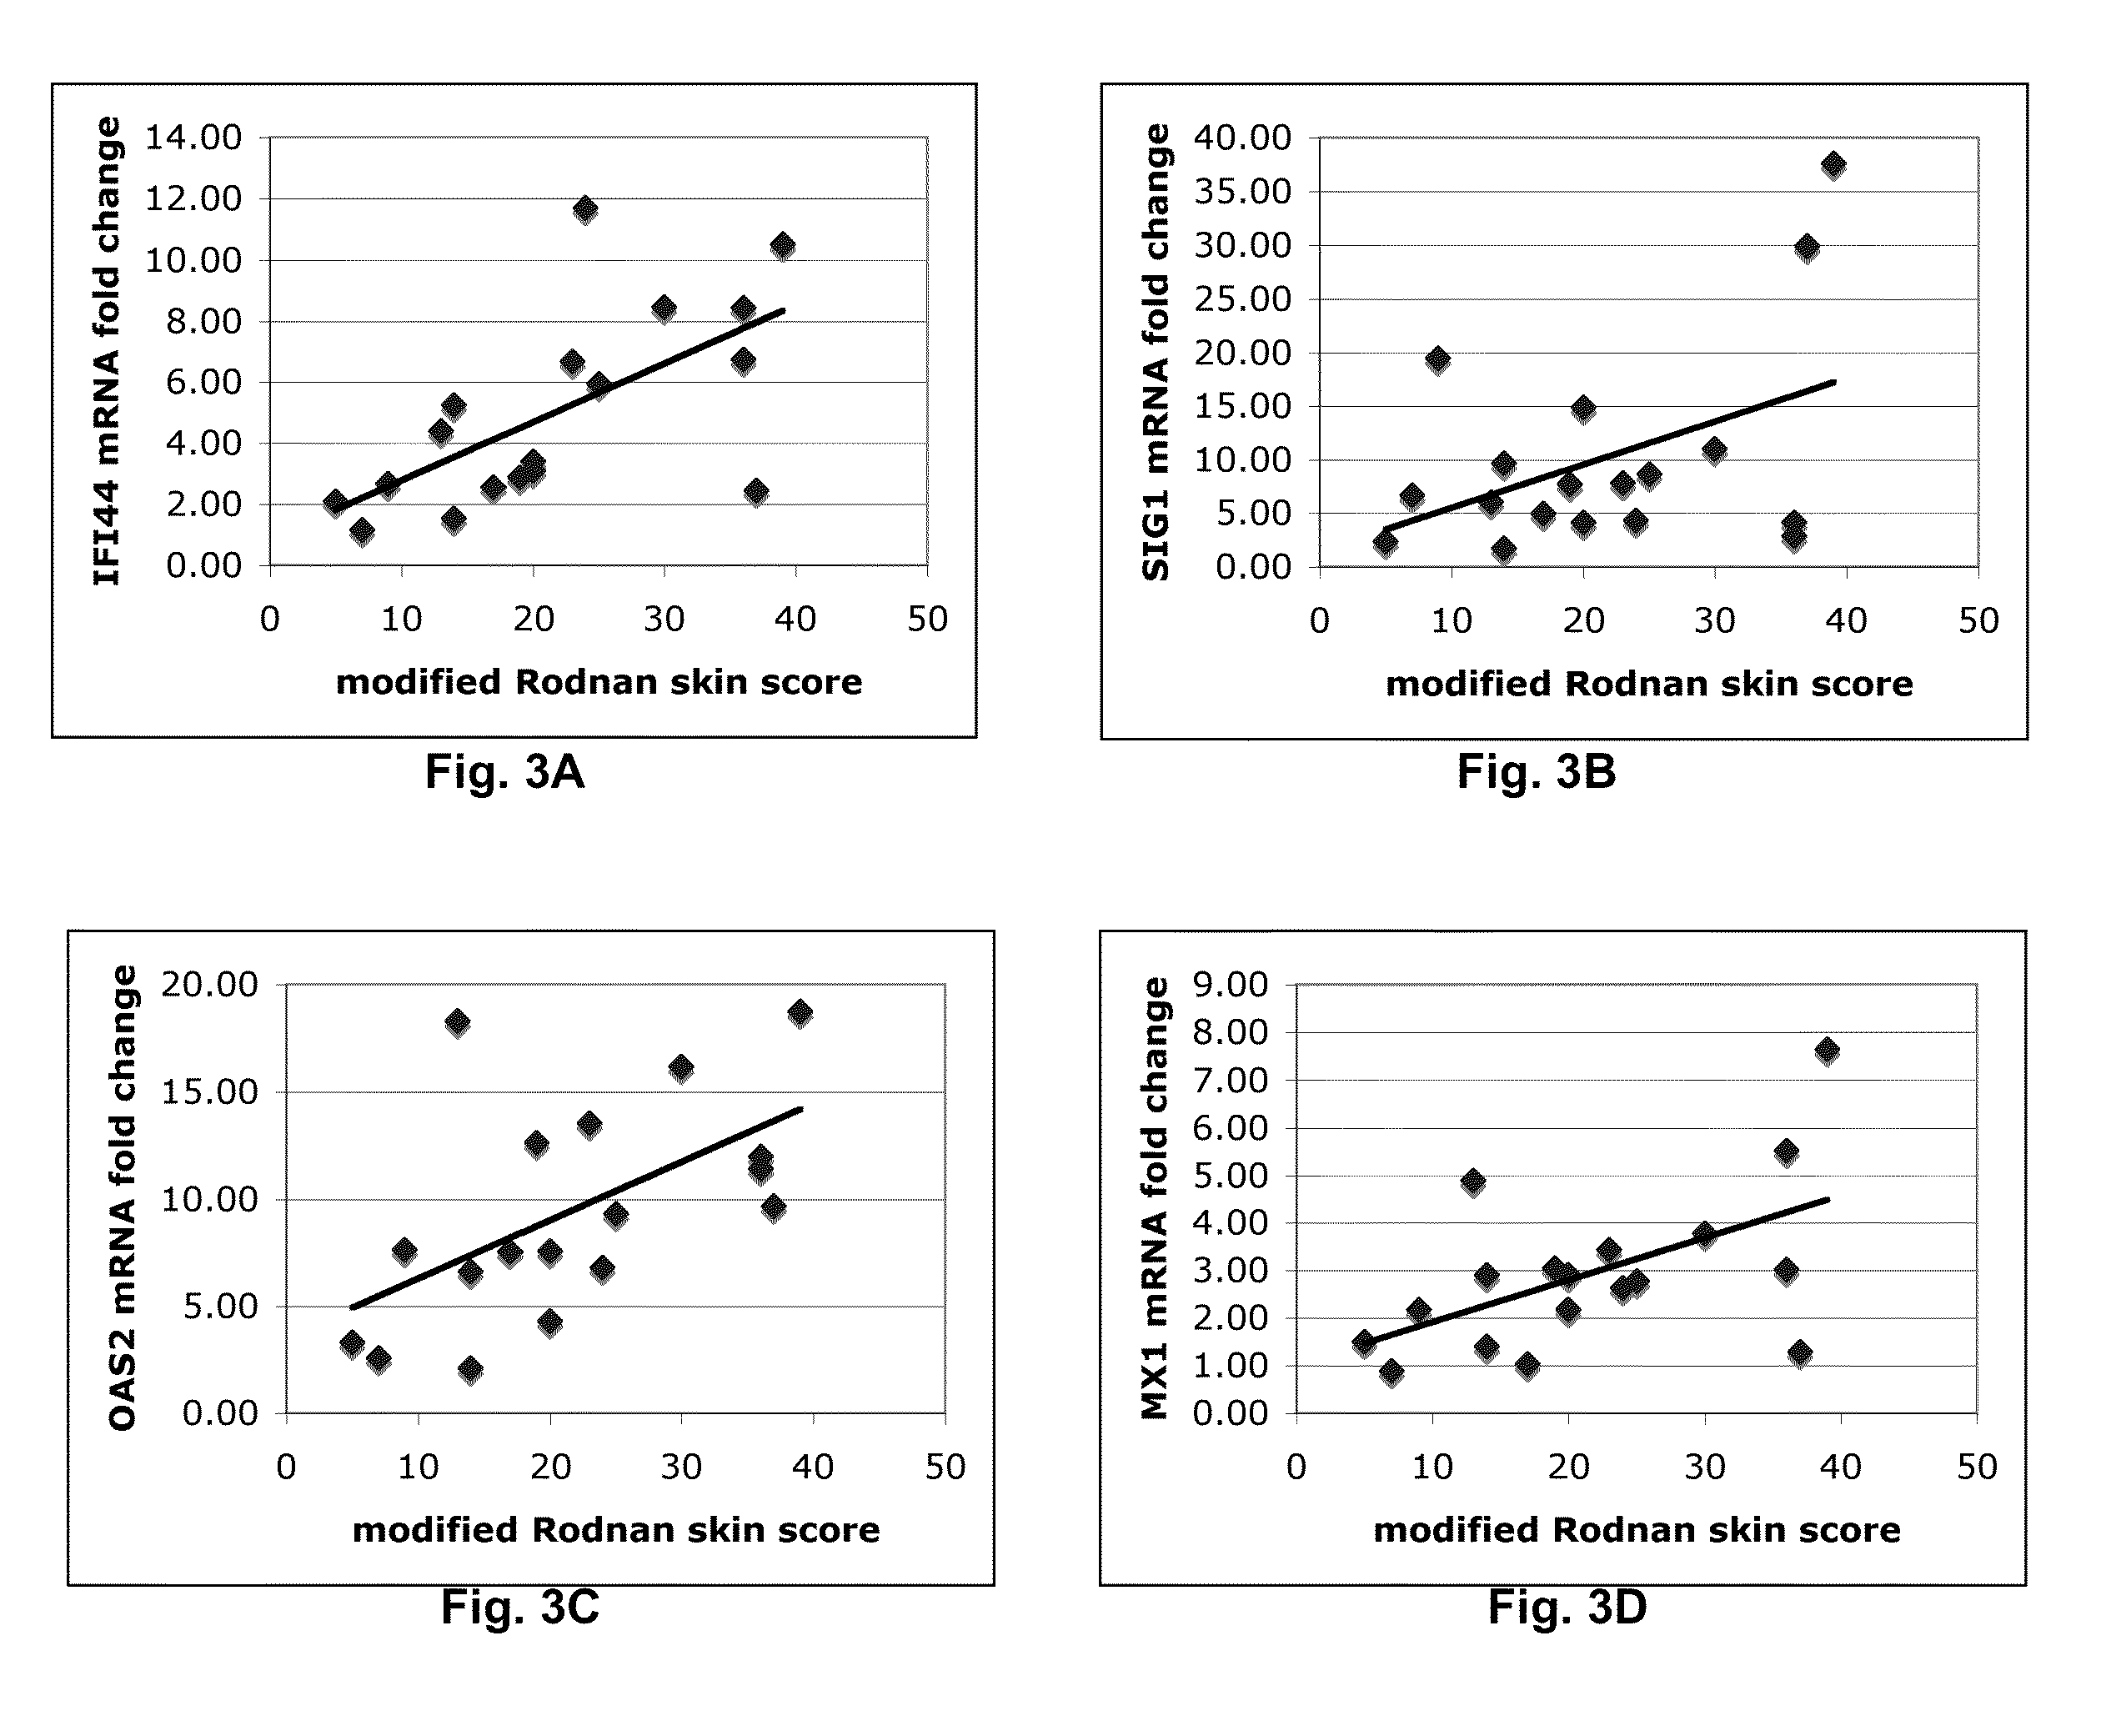
Figure 3
Abstract
Description
RELATED APPLICATION DATA
[0001] This application claims the benefit under 35 U.S.C. §119(e) of U.S. Provisional Application No. 61 / 336,361, filed Jan. 21, 2010, the content of which is hereby expressly incorporated herein by reference in its entirety.FIELD OF THE DISCLOSURE
[0002] Aspects of this disclosure relate to methods for determining the severity of systemic sclerosis. Other aspects relate to methods and tools for providing objective severity data and using the data for drug discovery trials, diagnostics, and therapeutics.DESCRIPTION OF BACKGROUND INFORMATION
[0003] Systemic sclerosis can be a debilitating disease. People suffering from systemic sclerosis are afflicted with fibrosis, degenerative changes, and vascular abnormalities in their skin, joints and various internal organs such as the esophagus, lower GI tract, lungs, heart, and kidneys. They often suffer from Raynaud's syndrome, polyarthralgia, dysphagia, and heartburn. Swelling and eventually skin tightening and contractu...
Examples
example 1
[0025]In the first example, any one identified gene can be useful for predicting and / or supplementing the mRSS. The correlation between each gene and the mRSS is expressed in the listed R2 values of the table:
GeneOne Gene (R2)COMP0.64THS10.32SIG10.17IFI440.41MX10.30OAS20.33
example 2
[0026]In the second example, pair combinations of each gene can be useful for predicting and / or supplementing the mRSS. The correlation between each gene pair and the mRSS is expressed in the listed R2 values of the table. Each gene listed in column A is paired with the genes listed in columns B, C, D, E, and F, and the R2 values for the respective combinations are listed where the row for each gene listed in column A intersects the column below each gene in the columns B-F. The R2 value for each combination is listed only once.
GeneTwo Gene Fits (R2)ABCDEFCOMPCOMPTHS1SIG1IFI44MX1THS10.71SIG10.660.47IFI440.710.760.53MX10.640.610.370.43OAS20.670.550.380.480.35
example 3
[0027]In the third example, three-gene combinations can be useful for predicting and / or supplementing the mRSS. The correlation between each three gene combination and the mRSS is expressed in the listed R2 values of the table. Each gene listed in column A is combined with the genes pairs listed in columns B-K, and the R2 values for the respective combinations are listed where the row for each gene listed in column A intersects the column below each gene pair in the columns B-K. The R2 value for each combination is listed only once.
Three Gene Fits (R2)BCDEFGHIJKGeneCOMP / COMP / COMP / COMP / THS1 / THS1 / THS1 / SIG1 / SIG1 / IFI44 / ATHS1SIG1IFI44MX1SIG1IFI44MX1IFI44MX1MX1SIG10.74IFI440.840.730.86MX10.730.660.750.710.780.53OAS20.690.680.720.700.610.770.650.540.400.48
The p-values for the three gene combinations with the highest R2 values are as follows:
p-valuep-valuep-valuep-valueR2COMP:0.012THS1:0.003IFI44:0.0030.84THS1:SIG1:IFI44:0.0040.86