
Device and method for analysing liquid samples
a liquid sample and device technology, applied in fluid controllers, laboratory glassware, laboratory apparatus, etc., can solve the problems of poor signal-to-noise ratio, low signal-to-noise ratio, and system lack of high signal-to-noise ratio and throughput of microarrays, and achieve high signal-to-noise ratio, increase the sensitivity of microarrays, and high throughput
Patent Information
- Authority / Receiving Office
- US · United States
- Patent Type
- Applications(United States)
- Current Assignee / Owner
- Publication Date
- 2018-09-06
Smart Images
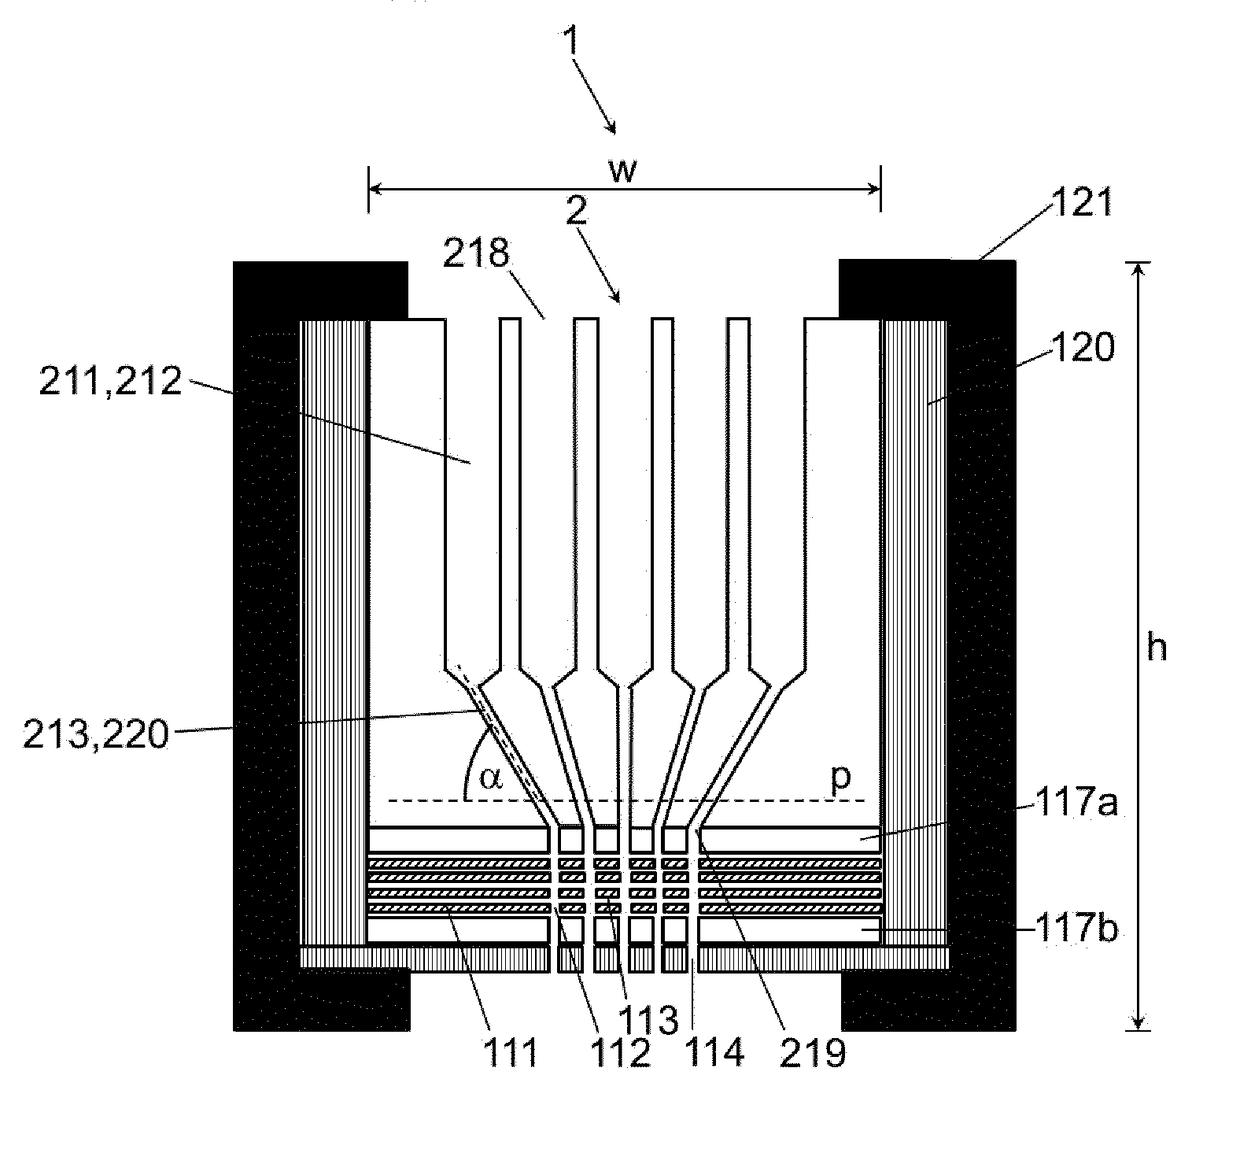
Figure 1 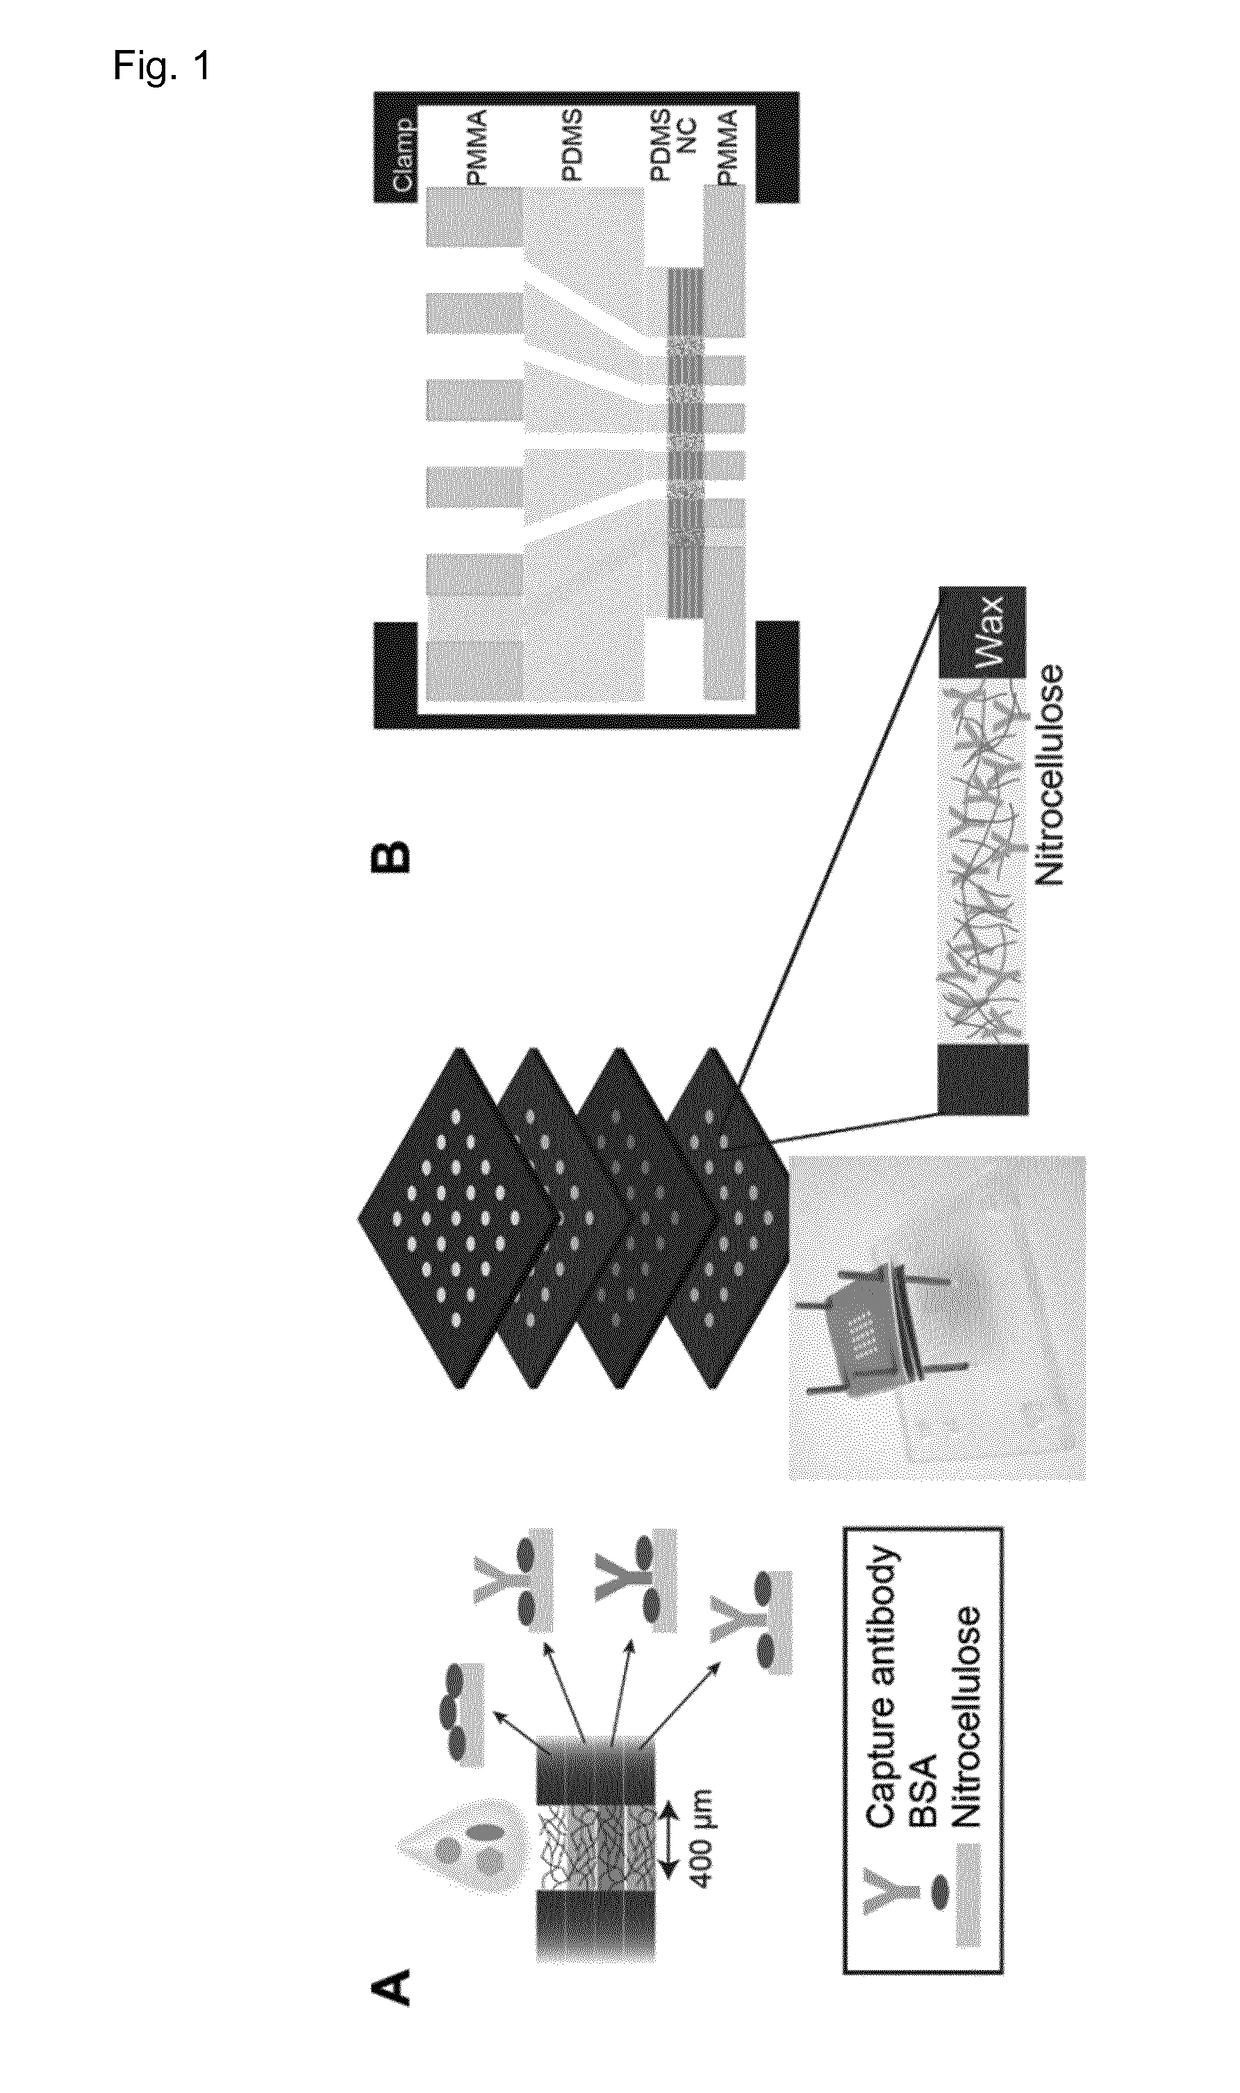
Figure 2 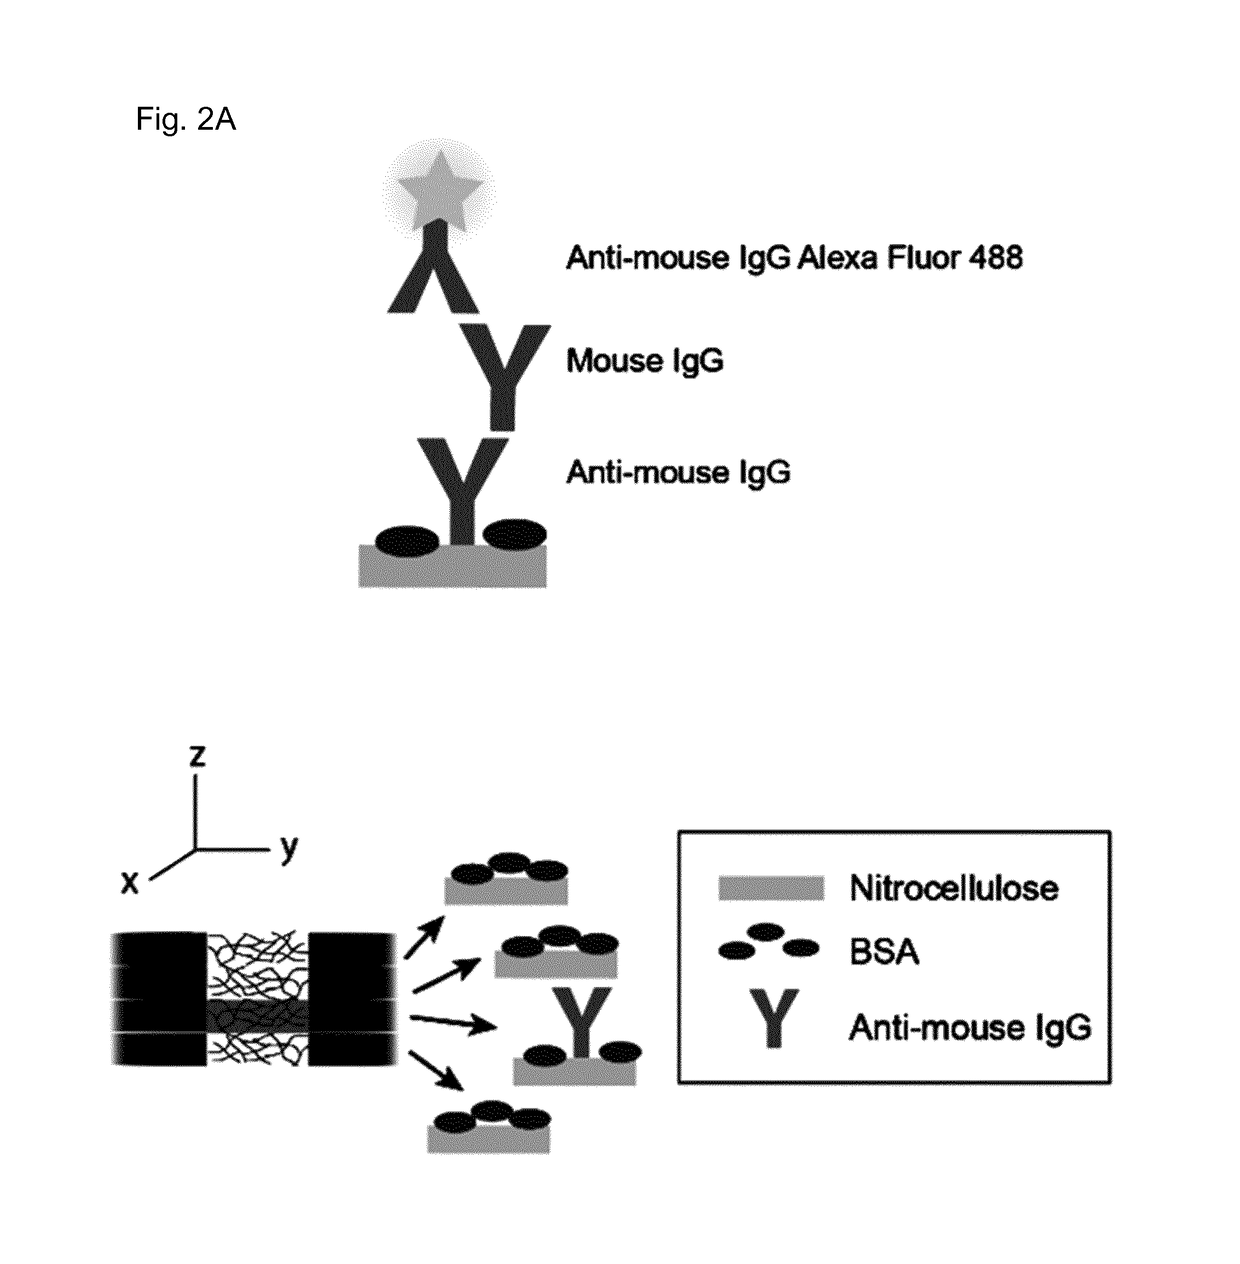
Figure 3
Abstract
Description
[0001] The invention relates to a device for analysing liquid samples, particularly for analysis of protein containing samples by immunofiltration.BACKGROUND OF THE INVENTION
[0002] Protein microarrays consist of spatially addressable test sites with micro to nano dimensions for highly multiplexed sensing. Miniature, planar test sites have several advantages (e.g. they are insensitive to sample volume errors, have high signal-to-noise ratios and high throughput), but are not well suited for analysing dilute samples because of the long incubation times needed to reach equilibrium (Ekins & Chu, 1991, Clin Chem 37(11), 1955-1967; Xu & Bao, 2003, Anal Chem 75(20), 5345-5351).
[0003] In contrast, immunofiltration assays can rapidly detect low amounts of analyte by flowing samples vertically through membranes dense with capture probes. However, relatively large spot diameters and issues isolating samples mean that these systems lack the high signal-to-noise ratio and throughput of microarrays ...
Examples
examples
[0288]Volume Dependency.
[0289]A sandwich assay using different sample volumes demonstrated that the FoRe array captures all the analyte as it flows through the layers. The stack was assembled as shown in FIG. 2A; the third layer was functionalised with anti-mouse IgG and the two layers above and one layer below were blocked with BSA. Three experiments were performed, each with a different concentration of mouse IgG (i.e. 5 pM, 25 pM, or 100 pM) spiked into 1 mg / ml of BSA to represent the high abundance serum proteins. For a given experiment, each volume (1 to 6 μl, in 1 μl increments) was injected in triplicate and the negative control consisted of six spots exposed to 6 μl of 1 mg / ml BSA (three for the 5 pM sample). These three concentrations were chosen because in a system sensitive to antigen amount the curves overlap in this volume range (i.e. 5 μl of 5 pM equals 1 μl of 25 pM and 4 μl of 25 pM equals 1 μl of 100 pM). After manually injecting the samples, the device was spun at ...