
Method for determining I-V characteristic fitting curve of crystalline silicon photovoltaic cell
A photovoltaic cell and characteristic fitting technology, applied in special data processing applications, complex mathematical operations, design optimization/simulation, etc., can solve problems such as inaccurate results and complex determination methods for output characteristic fitting curves, and achieve clear physical meaning. , save the cost of testing and avoid the tedious effect of calculation
Patent Information
- Authority / Receiving Office
- CN · China
- Patent Type
- Applications(China)
- Current Assignee / Owner
- Publication Date
- 2020-12-15
Smart Images
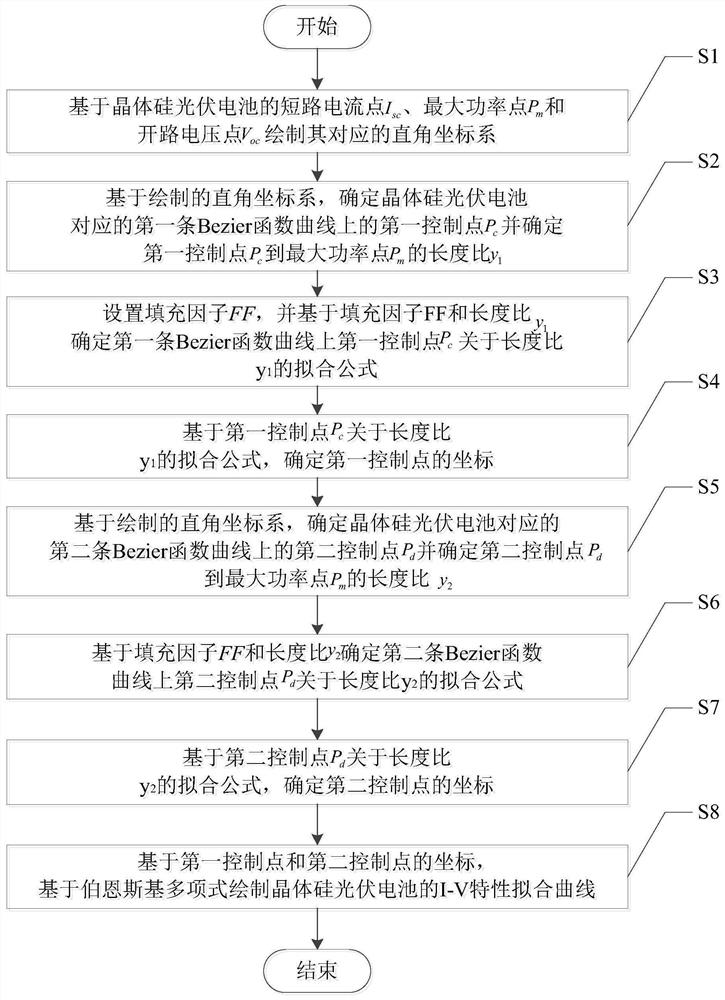
Figure 1 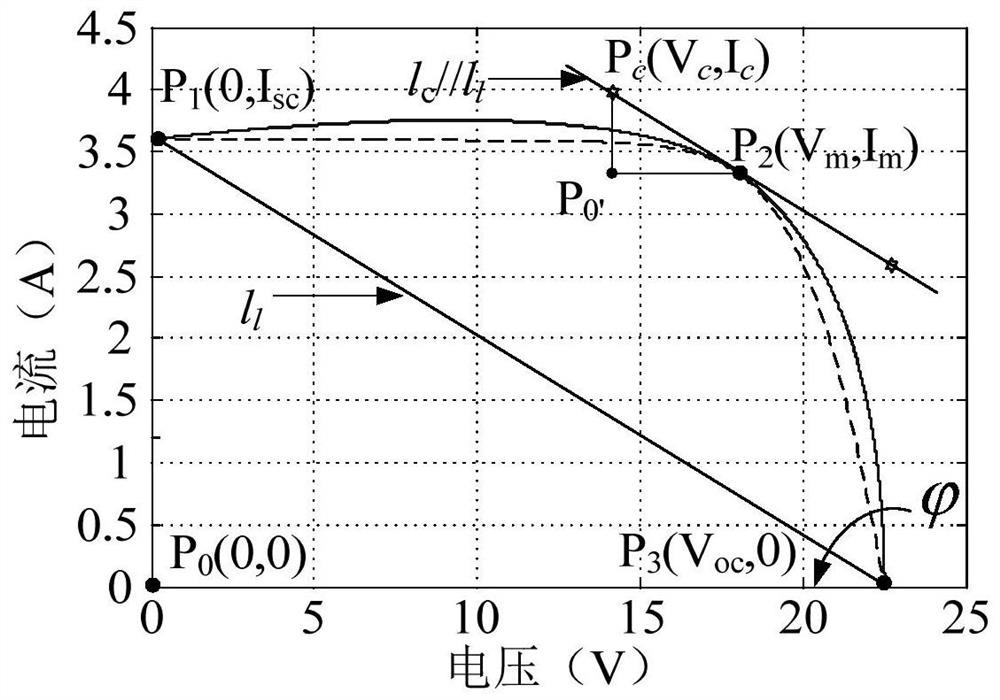
Figure 2 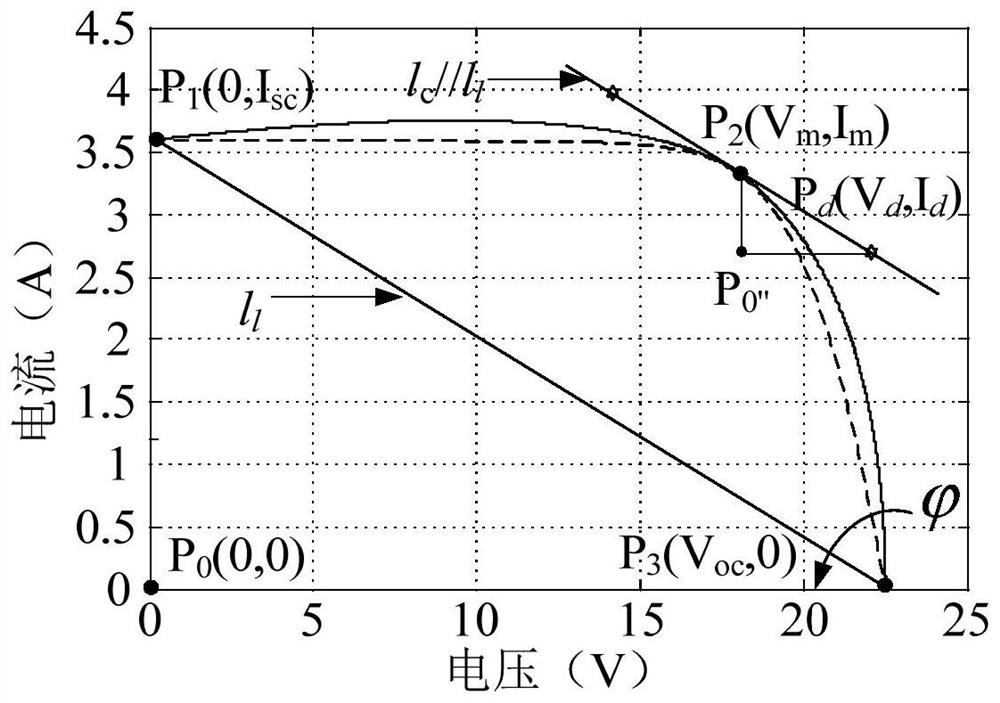
Figure 3
Abstract
Description
technical field
[0001] The invention belongs to the technical field of modeling output characteristic curves of photovoltaic cells, and in particular relates to a method for determining an I-V characteristic fitting curve of a crystalline silicon photovoltaic cell. Background technique
[0002] In 2020, the total domestic photovoltaic installed capacity will reach 730 million kilowatts. In 2035, the domestic photovoltaic power generation installed capacity will reach 3 billion kilowatts, ranking first among all power types, with huge development potential.
[0003] The current-voltage (I-V) curve of the photovoltaic cell output characteristics is a necessary prerequisite for maximum power tracking, efficiency evaluation, aging test and cost analysis. The I-V curve of the photovoltaic cell is described by the transcendental equation, which contains 5 unknown parameters such as series resistance, and according to The manufacturer's databook cannot solve the transcendental equa...
Examples
Embodiment 2
[0151] In this embodiment, taking monocrystalline silicon photovoltaic cells as an example, when determining the fitting equations of the control points on the two Bezier function curves, the fitting results of 12 kinds of monocrystalline silicon photovoltaic cells selected from different positions of the control points are compared. When the optimal control point corresponding to the minimum error is found, two Bezier functions are used to fit the entire I-V characteristic curve of 12 kinds of photovoltaic cells (the left and right parts of the maximum power point are combined), and the image of the fitting result is as follows Figure 4 as shown, Figure 4 The source of each curve in is: use a certain step increment to obtain the curves generated by several Bezier functions corresponding to different control points, and then use the least square error analysis technology to find one of the several curves that is consistent with the single crystal silicon The actual output ch...