Debug and trace on RISC-V: JTAG, OCD, and perf counters
AUG 25, 20259 MIN READ
Generate Your Research Report Instantly with AI Agent
PatSnap Eureka helps you evaluate technical feasibility & market potential.
RISC-V Debug & Trace Technology Evolution
The evolution of RISC-V debug and trace technologies represents a critical aspect of the architecture's maturation. Initially, RISC-V debug capabilities were rudimentary, with limited standardization across implementations. The first significant milestone came in 2017 with the ratification of the RISC-V External Debug Support specification (version 0.13), which established foundational debugging mechanisms compatible with the open-source nature of the architecture.
JTAG (Joint Test Action Group) integration marked an important early development, allowing RISC-V processors to leverage this industry-standard interface for boundary scan testing and debugging. This compatibility ensured that existing debug tools and methodologies could be adapted for RISC-V systems, facilitating adoption among developers familiar with established architectures.
On-Chip Debugging (OCD) capabilities evolved from basic run-control functionality to more sophisticated features. The introduction of hardware breakpoints, watchpoints, and program counters significantly enhanced debugging efficiency. By 2019, the Debug Specification 0.13.2 expanded these capabilities with trigger modules that could generate actions based on specific conditions during program execution.
Performance counters emerged as a critical component for system optimization around 2018-2019. Initially offering basic cycle counting and instruction retirement tracking, these counters evolved to support more granular metrics including cache hits/misses, branch prediction statistics, and memory access patterns. This evolution aligned with growing interest in RISC-V for performance-critical applications.
Trace capabilities represent the most recent significant advancement in RISC-V debug technology. The RISC-V Processor Trace Specification, initially proposed in 2018 and further developed through 2020-2022, enables non-intrusive monitoring of program execution. This specification defines mechanisms for capturing instruction execution flow, timing information, and data access patterns with minimal impact on system performance.
The integration of these debug and trace technologies with development environments has progressed substantially. Early tools required significant customization, but recent years have seen major IDE providers incorporating native RISC-V debug support. This integration has dramatically improved developer productivity and lowered barriers to RISC-V adoption.
Looking forward, the RISC-V debug ecosystem continues to evolve toward greater standardization and capability. Current efforts focus on enhancing trace compression techniques, improving multi-core debug coordination, and developing more sophisticated analysis tools that leverage the rich data provided by modern trace implementations.
Market Demand for RISC-V Debug Solutions
The RISC-V debug and trace market is experiencing significant growth driven by the broader adoption of RISC-V architecture across multiple industries. As RISC-V continues to gain traction in embedded systems, IoT devices, automotive applications, and even data centers, the demand for robust debugging solutions has become increasingly critical for developers and manufacturers.
Market research indicates that semiconductor companies, embedded system developers, and IoT device manufacturers represent the primary demand segments for RISC-V debug solutions. These stakeholders require comprehensive debugging capabilities to accelerate development cycles, improve product quality, and reduce time-to-market for RISC-V-based products.
The demand for JTAG-based debugging solutions remains strong due to its established ecosystem and widespread industry support. However, there is growing interest in more advanced On-Chip Debugging (OCD) capabilities that offer deeper visibility into system behavior without disrupting real-time operations. This shift reflects the increasing complexity of RISC-V implementations in performance-critical applications.
Performance counters have emerged as a particularly valuable feature in the RISC-V debug ecosystem, with market demand driven by applications requiring precise performance optimization. High-performance computing, automotive systems, and real-time applications represent key sectors where performance counter capabilities directly impact product competitiveness.
Regional analysis reveals that North America and Asia-Pacific currently lead in demand for RISC-V debug solutions, with Europe showing accelerated growth. China's strategic investment in RISC-V technology has created substantial market demand for domestically developed debug tools and solutions, partly driven by supply chain security considerations.
The market for RISC-V debug solutions is projected to grow at a compound annual rate exceeding the overall semiconductor tools market, reflecting the architecture's expanding footprint. Industry surveys indicate that approximately 70% of RISC-V adopters consider debug capabilities a critical factor in their technology selection process.
Emerging market trends include increasing demand for unified debug environments that support heterogeneous systems combining RISC-V with other architectures, cloud-based debug solutions enabling remote development workflows, and AI-assisted debugging tools that help identify complex system issues more efficiently. Security-focused debugging capabilities are also gaining importance as RISC-V expands into sensitive applications like automotive systems and industrial control.
RISC-V Debug Ecosystem Challenges
The RISC-V debug ecosystem faces several significant challenges that impede its widespread adoption and implementation efficiency. One primary challenge is the fragmentation of debug standards and implementations across different RISC-V implementations. While the RISC-V Debug Specification provides a framework, vendors often implement proprietary extensions or variations, creating compatibility issues between debug tools and hardware platforms.
Scalability presents another major hurdle, particularly in multi-core and heterogeneous RISC-V systems. Current debug mechanisms struggle to efficiently handle simultaneous debugging of multiple cores with different architectures or privilege levels, limiting their effectiveness in complex system-on-chip (SoC) designs that are increasingly common in modern applications.
The resource constraints in embedded RISC-V implementations create a significant tension between debug capabilities and silicon area. Many low-power or area-optimized RISC-V cores cannot afford comprehensive debug infrastructure, resulting in limited visibility into system behavior during development and troubleshooting phases.
Tool ecosystem maturity remains substantially behind that of established architectures like ARM or x86. The availability of professional-grade debug tools, integrated development environments with seamless debug support, and trace analysis solutions is limited. This gap particularly affects enterprise adoption where robust tooling is a prerequisite for production development.
Security considerations introduce additional complexity, as debug interfaces represent potential attack vectors. Implementing secure debug access while maintaining usability requires sophisticated authentication and authorization mechanisms that are not yet standardized across the ecosystem.
Performance monitoring capabilities vary widely across implementations, with inconsistent support for hardware performance counters and trace features. This inconsistency makes it difficult to profile and optimize applications across different RISC-V platforms, hampering performance-critical development.
Documentation and knowledge sharing present ongoing challenges, with fragmented information sources and varying levels of detail across different vendors and open-source implementations. Developers often struggle to find comprehensive guidance on debug methodologies specific to their RISC-V variant.
The integration with existing debug infrastructure and legacy systems poses compatibility challenges, particularly in environments where RISC-V must coexist with other architectures. Debug solutions that can seamlessly bridge these different domains remain limited, creating friction in heterogeneous system development.
Current RISC-V Debug Architecture
01 JTAG-based debugging interfaces
JTAG (Joint Test Action Group) interfaces provide a standardized method for debugging integrated circuits and systems. These interfaces allow for boundary scan testing, system-level debugging, and real-time monitoring of processor execution. JTAG-based debugging solutions enable engineers to access internal registers, memory, and control signals without disrupting normal operation, making them essential for hardware validation and software debugging in complex embedded systems.- JTAG-based debugging interfaces: JTAG (Joint Test Action Group) interfaces provide a standardized method for debugging embedded systems. These interfaces allow for boundary scan testing, system-level debugging, and programming of devices. JTAG-based debugging enables engineers to access internal components of integrated circuits, set breakpoints, examine memory contents, and control the execution of code, making it an essential tool for hardware and software development.
- On-Chip Debug (OCD) systems: On-Chip Debug systems integrate debugging capabilities directly into the processor or system-on-chip. These systems provide real-time visibility into the operation of the processor without significantly impacting performance. OCD features typically include hardware breakpoints, watchpoints, and memory access capabilities that allow developers to monitor and control program execution while the system is running in its target environment.
- Performance monitoring and counters: Performance counters are specialized registers that record various system events and metrics during program execution. These counters can track CPU cycles, cache misses, branch predictions, memory accesses, and other performance-related data. By analyzing this information, developers can identify bottlenecks, optimize code execution, and improve overall system performance. Performance monitoring tools provide insights into how software interacts with hardware in real-time applications.
- Trace functionality and data capture: Trace functionality captures detailed information about program execution, including instruction flow, memory accesses, and system events. This data can be stored in dedicated trace buffers or transmitted off-chip for analysis. Advanced trace systems support features like filtering, compression, and timestamping to manage the large volumes of data generated during debugging. Trace capabilities allow developers to reconstruct program execution history and diagnose complex, intermittent issues that might not be reproducible with traditional debugging methods.
- Debug communication protocols and interfaces: Various communication protocols and interfaces facilitate the connection between debug tools and target systems. These include not only JTAG but also Serial Wire Debug (SWD), Background Debug Mode (BDM), and custom debug interfaces. These protocols define how debug commands and data are exchanged, supporting features like hot-plugging, secure debugging, and multi-core debugging. The selection of appropriate debug interfaces impacts development efficiency, system security, and production testing capabilities.
02 On-Chip Debug (OCD) architectures
On-Chip Debug architectures integrate debugging capabilities directly into processor cores and system-on-chip designs. These architectures provide non-intrusive monitoring and control of program execution, register states, and memory contents. OCD implementations typically include breakpoint mechanisms, watchpoints, and execution control features that allow developers to halt execution, step through code, and analyze system behavior without external hardware probes, significantly improving debugging efficiency in complex embedded systems.Expand Specific Solutions03 Performance monitoring and counters
Performance counters provide mechanisms for measuring and analyzing system performance metrics during execution. These counters track events such as cache misses, branch predictions, instruction execution cycles, and memory access patterns. By collecting and analyzing this data, developers can identify performance bottlenecks, optimize code execution, and improve overall system efficiency. Performance monitoring infrastructure typically includes configurable counter registers, event selection logic, and data collection mechanisms that operate with minimal impact on the system being monitored.Expand Specific Solutions04 Trace functionality and data capture
Trace functionality enables the capture and analysis of program execution history and data flows. Trace systems record instruction sequences, memory accesses, register values, and other execution details that can be analyzed post-execution. Advanced trace implementations include compression techniques to manage large volumes of trace data, filtering mechanisms to focus on relevant events, and high-speed interfaces for data extraction. These capabilities allow developers to reconstruct execution paths, identify timing issues, and debug complex interactions that would be difficult to observe through traditional debugging methods.Expand Specific Solutions05 Secure debugging and authentication
Secure debugging technologies implement authentication and access control mechanisms to protect sensitive systems during the debugging process. These solutions ensure that only authorized users can access debug interfaces, preventing unauthorized access to internal system states and protected data. Secure debugging implementations typically include key-based authentication, encrypted communication channels, and configurable access levels that can be adjusted based on security requirements. These features are particularly important in systems handling sensitive data or implementing security-critical functions where debug interfaces could otherwise create security vulnerabilities.Expand Specific Solutions
Key RISC-V Debug Tool Providers
The RISC-V debug and trace ecosystem is currently in a growth phase, with market size expanding as RISC-V adoption increases globally. The technology maturity varies across different aspects, with JTAG debugging being well-established while more advanced trace capabilities are still evolving. Key players shaping this landscape include ARM Limited, which brings expertise from established debug architectures; Intel and IBM, contributing significant resources to RISC-V debug standardization; and specialized companies like NewAE Technology focusing on hardware security debugging. Chinese companies such as Huawei, ZTE, and Shanghai Tianshu Zhixin are increasingly investing in RISC-V debug capabilities, while semiconductor leaders like Texas Instruments, Renesas, and MediaTek are integrating these technologies into their development ecosystems to support growing commercial RISC-V implementations.
Texas Instruments Incorporated
Technical Solution: Texas Instruments has developed a robust debug and trace solution for RISC-V processors used in their microcontroller and embedded processor lines. Their implementation adheres to the RISC-V Debug Specification with TI-specific enhancements for embedded applications. TI's debug architecture includes a standard JTAG interface supporting IEEE 1149.1 with optimizations for their Code Composer Studio development environment. Their On-Chip Debugger (OCD) implementation provides comprehensive features including hardware breakpoints, data watchpoints, and complex trigger conditions based on address ranges and data values. For trace capabilities, TI has implemented a configurable trace subsystem that can capture both instruction execution flow and data accesses with filtering options to reduce trace bandwidth. Their performance monitoring solution includes the standard RISC-V hardware performance counters supplemented with additional counters specific to TI's microarchitectural implementations, allowing developers to monitor cache behavior, memory access patterns, and peripheral interactions. TI's debug solution also includes power debugging features that can correlate code execution with power consumption patterns, which is particularly valuable for low-power embedded applications[2][8].
Strengths: Excellent integration with TI's development ecosystem; specialized features for power-sensitive applications; robust support through established tools and documentation. Weaknesses: Some advanced features may be tied to TI's proprietary development environment; debug solutions optimized primarily for TI's specific RISC-V implementations rather than generic RISC-V cores.
ARM LIMITED
Technical Solution: ARM has developed comprehensive debug and trace solutions for RISC-V through their CoreSight technology, which they've adapted for the RISC-V architecture. Their approach includes a JTAG-based debug interface that supports both standard IEEE 1149.1 JTAG and compact cJTAG (IEEE 1149.7) protocols. ARM's CoreSight for RISC-V implements an On-Chip Debugger (OCD) system that provides non-intrusive debugging capabilities, including hardware breakpoints, watchpoints, and program trace functionality. Their solution includes embedded trace macrocells that can capture instruction and data traces with minimal impact on system performance. For performance monitoring, ARM has integrated configurable performance counters that track various microarchitectural events such as cache misses, branch predictions, and instruction execution metrics. ARM's debug solution also supports cross-triggering between debug and trace components, allowing sophisticated debug scenarios[1][3].
Strengths: Leverages extensive experience from ARM's established debug ecosystem; provides comprehensive integration with existing development tools; offers scalable solutions for different complexity levels of RISC-V implementations. Weaknesses: May have licensing complexities when applied to open-source RISC-V designs; potential vendor lock-in concerns for pure RISC-V implementations seeking full openness.
Performance Counter Innovations
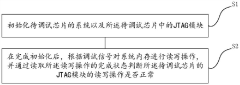
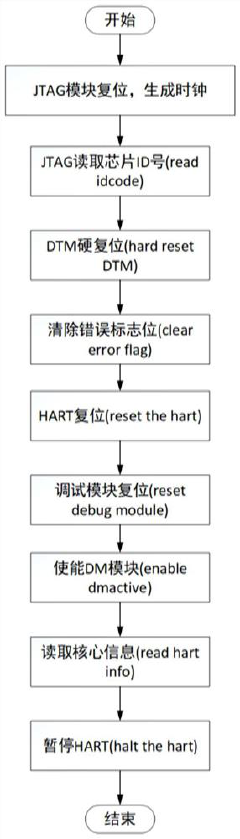
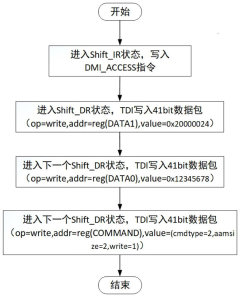
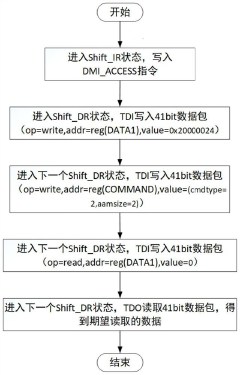
Simulation debugging method and device based on RISC-V chip
PatentActiveCN111881636A
Innovation
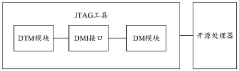
- By initializing the system and JTAG module of the chip to be debugged, the stability of the system clock is ensured, and the normality of the JTAG module is judged by the completion status of read and write operations, accurately finding design issues with incorrect logic processing, and improving debugging efficiency.
Open source processor, access method of internal cache, debugging system and electronic equipment
PatentPendingCN117472666A
Innovation
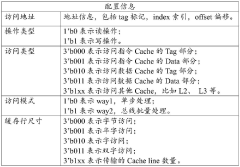
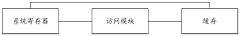
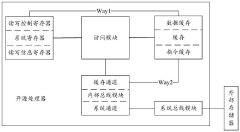
- Provides an open source processor and internal cache access method, configures access information through JTAG tools, uses the access module to parse configuration information, realizes read and write operations on the cache, supports single-step and batch processing modes, and enhances access to instruction and data caches flexibility.
RISC-V Debug Standards Compliance
Compliance with RISC-V debug standards represents a critical aspect of hardware development within the RISC-V ecosystem. The RISC-V Debug Specification 0.13.2 and subsequent revisions establish a comprehensive framework for debugging capabilities that manufacturers must adhere to for interoperability. This specification defines multiple compliance levels, ranging from basic to advanced debugging features, allowing implementers to select appropriate capabilities based on their application requirements.
The core compliance requirements encompass several key areas. First, the Debug Transport Module (DTM) must conform to either JTAG (IEEE 1149.1) or other approved transport mechanisms with precise timing and electrical characteristics. Second, the Debug Module (DM) must implement the standardized register set and command protocol, ensuring consistent behavior across different implementations. Third, the specification mandates specific trigger mechanisms that must be available for hardware breakpoints and watchpoints.
Compliance testing methodologies have evolved significantly since the initial debug specification release. The RISC-V Foundation's compliance working group has developed formal verification suites that validate debug implementations against the standard. These test suites examine both functional correctness and timing requirements, verifying that debug operations do not interfere with normal processor execution beyond specified parameters.
Market analysis indicates varying levels of compliance across vendors. Major silicon providers like SiFive, Andes Technology, and Microchip have achieved full compliance with the debug specification in their commercial offerings. However, many open-source implementations and smaller vendors demonstrate partial compliance, particularly lacking in advanced features like complex trigger systems or trace capabilities.
The compliance landscape faces several challenges. The evolving nature of the RISC-V debug specification creates a moving target for implementers. Additionally, the specification allows implementation flexibility, which can lead to interoperability issues between debug tools and hardware from different vendors despite technical compliance. The absence of a centralized certification authority also complicates verification of compliance claims.
Recent developments show progress toward stronger standardization. The RISC-V International organization has established a formal certification process for debug implementations, providing official recognition for compliant products. This certification includes rigorous testing of JTAG implementations, On-Chip Debugging (OCD) functionality, and performance counter accessibility, addressing previous gaps in compliance verification.
Security Implications of Debug Access
Debug interfaces in RISC-V architectures present significant security vulnerabilities that must be carefully evaluated. The JTAG (Joint Test Action Group) interface, while essential for hardware debugging, creates a potential backdoor into the system. When left enabled in production environments, JTAG ports can allow unauthorized access to internal registers, memory, and control functions. Attackers with physical access to these ports can potentially extract sensitive information, modify firmware, or completely bypass security mechanisms.
On-Chip Debugger (OCD) implementations introduce additional security concerns. The privileged access mechanisms that allow debuggers to halt processors, read/write memory, and manipulate register states can be exploited if not properly secured. Many RISC-V implementations include debug specification features that, while necessary for development, may remain accessible in deployed systems without proper protection measures.
Performance counters, though less obvious as security risks, can leak side-channel information. These counters track various microarchitectural events and can be exploited in timing attacks to extract cryptographic keys or other sensitive data. The granularity of information provided by these counters must be carefully controlled to prevent such attacks.
The security architecture surrounding debug access requires a multi-layered approach. Authentication mechanisms for debug interfaces, such as password protection or cryptographic challenges, form the first line of defense. However, these must be implemented carefully to avoid introducing their own vulnerabilities.
Hardware-enforced isolation between debug domains and secure execution environments is critical. Technologies like TrustZone or Physical Memory Protection (PMP) in RISC-V can establish boundaries that even debug interfaces cannot cross without proper authorization. This prevents debug tools from compromising secure enclaves.
Permanent disabling or fusing of debug interfaces in production devices represents another security strategy. Many RISC-V implementations support one-time programmable fuses that can permanently disable debug access, though this eliminates the possibility of field diagnostics.
Audit logging of debug access attempts provides an important security control. By maintaining records of when debug interfaces are accessed and what operations are performed, organizations can detect potential security breaches and understand attack patterns.
Unlock deeper insights with PatSnap Eureka Quick Research — get a full tech report to explore trends and direct your research. Try now!
Generate Your Research Report Instantly with AI Agent
Supercharge your innovation with PatSnap Eureka AI Agent Platform!