

Raman Spectroscopy vs Mass Spectrometry: Detection Limits
SEP 19, 20259 MIN READ
Generate Your Research Report Instantly with AI Agent
PatSnap Eureka helps you evaluate technical feasibility & market potential.
Spectroscopic Detection Background and Objectives
Spectroscopic detection techniques have evolved significantly over the past several decades, transforming from laboratory curiosities into essential analytical tools across numerous industries. Raman spectroscopy and mass spectrometry represent two distinct yet complementary approaches to molecular detection and identification, each with its own historical trajectory and technological evolution.
Raman spectroscopy, discovered by C.V. Raman in 1928, has progressed from a cumbersome technique requiring intense light sources and long acquisition times to a versatile analytical method enabled by laser technology advancements in the 1960s. The subsequent development of charge-coupled devices (CCDs) and sophisticated filtering systems in the 1980s and 1990s further enhanced its capabilities, leading to modern portable and even handheld Raman systems.
Mass spectrometry traces its origins to J.J. Thomson's work in the early 20th century, with significant advancements occurring during World War II. The technique has undergone revolutionary changes with the introduction of various ionization methods such as electrospray ionization (ESI) and matrix-assisted laser desorption/ionization (MALDI) in the 1980s, dramatically expanding its application range to include biomolecules and complex mixtures.
The detection limits of these technologies represent a critical frontier in analytical chemistry. While mass spectrometry traditionally offers superior sensitivity, often reaching parts-per-billion or even parts-per-trillion levels for many analytes, Raman spectroscopy has historically been limited by weak signal intensity, with detection limits typically in the parts-per-million range. However, enhanced techniques such as surface-enhanced Raman spectroscopy (SERS) have narrowed this gap considerably.
The primary objective of this technical research is to comprehensively evaluate and compare the detection limits of Raman spectroscopy and mass spectrometry across various application domains. We aim to identify the fundamental physical and technical constraints that determine these limits and explore emerging technologies that may push these boundaries further.
Additionally, this research seeks to map the complementary strengths of these techniques, identifying scenarios where one might be preferable to the other, or where their combined application might yield superior analytical outcomes. Understanding these comparative advantages is crucial for guiding future instrument development and application strategies.
The ultimate goal is to provide a forward-looking assessment of how detection limits for both technologies may evolve in the coming decade, considering emerging innovations such as tip-enhanced Raman spectroscopy (TERS), ambient ionization mass spectrometry, and machine learning-enhanced data analysis approaches that promise to extract meaningful signals from increasingly complex backgrounds.
Market Analysis for Analytical Detection Technologies
The analytical detection technologies market is experiencing robust growth, driven by increasing demand across pharmaceutical, environmental monitoring, food safety, and clinical diagnostics sectors. Currently valued at approximately $29.4 billion globally, this market is projected to reach $41.7 billion by 2027, representing a compound annual growth rate of 7.2%. Within this landscape, spectroscopy and mass spectrometry collectively account for over 40% of the total market share.
Raman spectroscopy and mass spectrometry occupy distinct market positions based on their detection capabilities. Mass spectrometry dominates high-sensitivity applications with a market size of $4.9 billion, growing at 8.1% annually, while Raman spectroscopy represents a smaller but rapidly expanding segment at $1.2 billion with 9.3% growth, driven by its non-destructive analysis advantages.
Detection limits significantly influence market adoption patterns. Mass spectrometry's superior sensitivity (reaching parts-per-trillion levels) has established its dominance in pharmaceutical quality control, forensic toxicology, and environmental contaminant monitoring. Conversely, Raman spectroscopy, despite higher detection limits (typically parts-per-million), has found growing application in material identification, counterfeit detection, and biological sample analysis where sample preservation is critical.
Regional market distribution reveals North America leading with 38% market share, followed by Europe (29%) and Asia-Pacific (24%). The Asia-Pacific region demonstrates the fastest growth rate at 9.7%, driven by expanding pharmaceutical manufacturing and increasing environmental regulations in China and India.
End-user segmentation shows pharmaceuticals and biotechnology as the largest consumers (34%), followed by academic and research institutions (22%), environmental testing (18%), and food safety (14%). The pharmaceutical sector particularly values mass spectrometry's detection capabilities for impurity profiling and metabolite identification.
Market trends indicate growing demand for portable and field-deployable instruments, with handheld Raman devices experiencing 12.3% annual growth. Integration of artificial intelligence for automated spectral analysis is creating new market opportunities, with AI-enhanced systems commanding premium pricing and expanding the addressable market by making advanced analytical techniques accessible to less specialized personnel.
Cost considerations remain a significant market factor, with high-end mass spectrometers ($300,000-$1,000,000) creating barriers to entry for smaller laboratories, while mid-range Raman systems ($50,000-$150,000) offer more accessible alternatives with acceptable detection capabilities for many applications.
Technical Limitations and Challenges in Detection Methods
Both Raman spectroscopy and mass spectrometry face significant technical limitations that impact their detection capabilities. Raman spectroscopy struggles with inherent sensitivity issues, typically achieving detection limits in the range of 0.1-1% concentration or parts per thousand. This limitation stems from the fundamental physics of Raman scattering, where only approximately 1 in 10 million photons undergoes Raman scattering, resulting in weak signal intensity that can be easily overwhelmed by background fluorescence or ambient light interference.
Surface-Enhanced Raman Spectroscopy (SERS) has emerged as a potential solution, offering enhancement factors of 10^6 to 10^14, which can push detection limits down to single-molecule levels under optimal conditions. However, SERS faces reproducibility challenges due to the difficulty in creating consistent enhancement substrates and maintaining stable enhancement factors across different samples and experimental conditions.
Mass spectrometry, while generally more sensitive with detection limits reaching parts per billion or trillion levels, confronts challenges in ionization efficiency. Many compounds ionize poorly under standard conditions, leading to significant variations in detection sensitivity across different analytes. This creates a compound-dependent detection bias that can complicate quantitative analysis, particularly in complex mixtures where matrix effects become prominent.
Sample preparation represents another critical challenge for both technologies. Mass spectrometry often requires extensive sample preparation to remove interfering compounds and concentrate analytes, which can introduce contamination or analyte loss. Raman spectroscopy, while requiring minimal sample preparation in many cases, suffers from sampling heterogeneity issues where the small laser spot size may not adequately represent the entire sample.
Instrumentation limitations further constrain both technologies. High-end mass spectrometers capable of achieving ultra-low detection limits are expensive, bulky, and require specialized infrastructure including vacuum systems and high-voltage power supplies. Similarly, advanced Raman systems with enhanced sensitivity features like cooled detectors or specialized lasers significantly increase system complexity and cost, limiting widespread adoption.
Data analysis presents additional challenges, particularly for complex samples. Mass spectrometry generates enormous datasets requiring sophisticated algorithms and databases for compound identification. Raman spectroscopy faces difficulties in spectral deconvolution when multiple compounds are present, especially at low concentrations where peak overlap becomes problematic and signal-to-noise ratios deteriorate.
Current Detection Limit Solutions Comparison
01 Detection limits enhancement in Raman spectroscopy
Various techniques have been developed to enhance the detection limits of Raman spectroscopy, including surface-enhanced Raman spectroscopy (SERS), resonance Raman spectroscopy, and tip-enhanced Raman spectroscopy (TERS). These methods can significantly lower detection limits by amplifying the Raman signal through mechanisms such as electromagnetic field enhancement or chemical enhancement. Advanced signal processing algorithms and improved optical configurations also contribute to pushing detection limits to lower concentrations, enabling the detection of trace amounts of analytes.- Detection limit improvements in Raman spectroscopy: Various techniques have been developed to improve the detection limits of Raman spectroscopy, including surface-enhanced Raman spectroscopy (SERS), resonance Raman spectroscopy, and tip-enhanced Raman spectroscopy (TERS). These methods enhance the Raman signal intensity, allowing for detection of analytes at lower concentrations. Signal processing algorithms and advanced optical configurations are also employed to reduce background noise and increase sensitivity, pushing detection limits down to single-molecule levels in some applications.
- Mass spectrometry detection limit optimization: Mass spectrometry detection limits can be optimized through various ionization techniques, such as electrospray ionization (ESI), matrix-assisted laser desorption/ionization (MALDI), and atmospheric pressure chemical ionization (APCI). Improvements in mass analyzer technology, including time-of-flight (TOF), quadrupole, and orbitrap analyzers, have significantly enhanced sensitivity. Sample preparation methods, pre-concentration techniques, and chromatographic separation prior to mass spectrometry analysis also contribute to achieving lower detection limits for complex samples.
- Combined Raman and mass spectrometry approaches: Integrating Raman spectroscopy with mass spectrometry creates powerful analytical platforms that leverage the complementary strengths of both techniques. These hybrid approaches allow for both molecular structural information (from Raman) and precise molecular identification and quantification (from mass spectrometry) in a single analytical workflow. The combination improves detection limits by providing orthogonal confirmation of analytes and reducing false positives, particularly valuable for complex sample matrices in environmental monitoring, pharmaceutical analysis, and biomedical applications.
- Nanomaterial-enhanced detection methods: Nanomaterials such as gold and silver nanoparticles, carbon nanotubes, and quantum dots are increasingly used to enhance detection limits in both Raman spectroscopy and mass spectrometry. In Raman applications, these materials create localized surface plasmon resonance effects that amplify signals by several orders of magnitude. For mass spectrometry, nanomaterials serve as novel matrices, ionization enhancers, or selective capture agents that improve ionization efficiency and reduce matrix effects, resulting in significantly lower detection limits for challenging analytes.
- Portable and field-deployable detection systems: Advances in miniaturization have led to the development of portable Raman and mass spectrometry systems with improved detection limits suitable for field applications. These systems incorporate innovative optical designs, microfluidics, and specialized sample preparation techniques to achieve laboratory-quality detection limits in compact formats. Machine learning algorithms and automated data processing enhance the performance of these portable systems by filtering noise and identifying target analytes even at low concentrations, enabling real-time monitoring and rapid decision-making in environmental, security, and clinical applications.
02 Mass spectrometry detection limit improvements
Innovations in mass spectrometry have led to significant improvements in detection limits through enhanced ionization techniques, better ion transmission, and more sensitive detectors. Methods such as electrospray ionization (ESI), matrix-assisted laser desorption/ionization (MALDI), and ambient ionization techniques have expanded the range of detectable compounds. Advanced mass analyzers like time-of-flight (TOF), quadrupole, and Orbitrap systems, combined with improved vacuum systems and detector technologies, have pushed detection limits down to femtogram or even attogram levels for certain compounds.Expand Specific Solutions03 Combined Raman and mass spectrometry approaches
Integrating Raman spectroscopy with mass spectrometry creates powerful hybrid analytical platforms that leverage the complementary strengths of both techniques. These combined approaches provide both molecular structural information from Raman and precise molecular identification from mass spectrometry. The integration can be achieved through various configurations, including sequential analysis of the same sample or simultaneous analysis using specialized interfaces. This combination enhances detection capabilities, reduces false positives, and provides more comprehensive chemical characterization with improved detection limits.Expand Specific Solutions04 Sample preparation techniques for improved detection limits
Advanced sample preparation methods play a crucial role in improving detection limits for both Raman spectroscopy and mass spectrometry. Techniques such as solid-phase extraction, liquid-liquid extraction, and various concentration methods help to isolate and concentrate analytes of interest. Specialized substrates for Raman analysis and derivatization methods for mass spectrometry can enhance signal intensity. Removal of interfering compounds and matrix effects through purification steps further improves the ability to detect trace amounts of target compounds.Expand Specific Solutions05 Quantification methods and calibration for low concentration detection
Accurate quantification at low concentrations requires sophisticated calibration methods and data analysis techniques. Internal standardization, isotope dilution, standard addition methods, and matrix-matched calibration are employed to achieve reliable quantification near detection limits. Advanced statistical approaches, including multivariate analysis, machine learning algorithms, and chemometric methods, help extract meaningful signals from noise and compensate for matrix effects. These quantification strategies are essential for validating detection limits and ensuring reproducibility in both Raman spectroscopy and mass spectrometry applications.Expand Specific Solutions
Leading Manufacturers and Research Institutions Analysis
Raman Spectroscopy and Mass Spectrometry detection limits present a competitive landscape in an evolving analytical instrumentation market. The industry is in a mature growth phase with specialized innovation, valued at approximately $5-7 billion annually. Leading companies like Shimadzu, FUJIFILM, and Bruker Optik have established strong technological foundations in mass spectrometry, while ChemImage and Photothermal Spectroscopy Corp. are advancing Raman spectroscopy capabilities. Academic institutions including MIT, Harvard, and Zhejiang University collaborate with industry players like IBM and Intel to enhance detection sensitivity and application range. The technology continues to mature with recent breakthroughs reducing detection limits to parts-per-billion levels, though mass spectrometry generally maintains superior sensitivity for trace analysis in complex matrices.
NUCTECH Co., Ltd.
Technical Solution: NUCTECH has developed specialized security and inspection systems that leverage both Raman spectroscopy and mass spectrometry technologies for threat detection. Their RT1003 Raman identifier can detect and identify substances through containers with detection limits in the milligram range, while their HEMS-IMS (High-Efficiency Mass Spectrometry - Ion Mobility Spectrometry) technology achieves detection limits in the nanogram to picogram range for explosives and narcotics. NUCTECH's comparative analysis shows that their mass spectrometry-based systems are approximately 1000 times more sensitive than their Raman-based detectors, but the latter offer advantages in through-barrier detection, field portability, and non-destructive analysis. Their integrated security screening solutions strategically deploy both technologies based on specific threat detection requirements, with Raman systems serving as rapid first-line screening tools and mass spectrometry providing confirmatory analysis when lower detection limits are required.
Strengths: Specialized security and inspection applications; through-barrier detection capabilities with Raman technology; field-deployable solutions; strategic integration of both technologies in security workflows. Weaknesses: Raman systems have significantly higher detection limits than mass spectrometry options; specialized focus on security applications rather than general analytical capabilities; higher false positive rates with Raman compared to mass spectrometry.
ChemImage Corp.
Technical Solution: ChemImage has developed proprietary Molecular Chemical Imaging (MCI) technology that combines Raman spectroscopy with advanced computational algorithms to enhance detection capabilities. Their VeroVision™ platform utilizes hyperspectral imaging with Raman technology to achieve detection limits in the nanogram range for surface contaminants and chemical residues. For applications requiring lower detection limits, ChemImage has created a hybrid approach that integrates their Raman systems with third-party mass spectrometry technologies. Their comparative studies show that while their enhanced Raman systems typically have detection limits 100-1000 times higher than mass spectrometry, they offer significant advantages in speed, portability, and non-destructive analysis. ChemImage's proprietary algorithms can improve signal-to-noise ratios by up to 40% compared to conventional Raman systems, narrowing the detection limit gap with mass spectrometry for specific applications like pharmaceutical contaminant detection and explosive trace analysis.
Strengths: Innovative hyperspectral Raman imaging technology; excellent spatial resolution capabilities; non-destructive analysis with minimal sample preparation; portable solutions for field deployment. Weaknesses: Still cannot match the absolute detection limits of mass spectrometry; specialized applications rather than general analytical use; requires significant computational resources for image processing.
Key Innovations in Sensitivity Enhancement
Measurement device, measurement apparatus, and method
PatentInactiveUS20160027631A1
Innovation
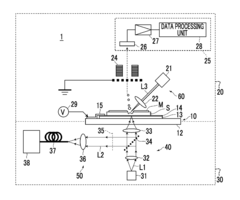
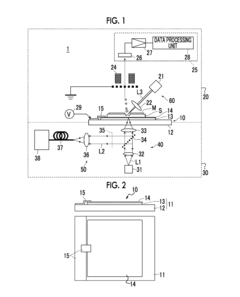
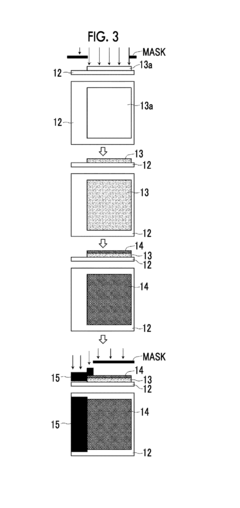
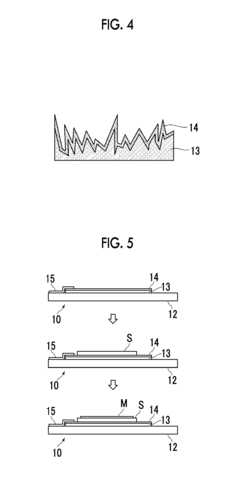
- A measurement device with a transparent dielectric substrate and a metal fine concavo-convex structure layer, capable of generating localized plasmon resonance, allows for both mass spectrometry and SERS measurements using the same specimen by applying voltage and irradiating with different lights, enabling simultaneous analysis of total and surface substance information.
Methods, algorithms and systems for sub-nanosecond digital signal processing of photomultiplier tube response to enable multi-photon counting in raman spectroscopy
PatentPendingUS20240093404A1
Innovation
- A multi-photon counting approach using a high-speed data acquisition system and multi-threshold Digital Signal Processing (DSP) algorithm to differentiate photon arrival events by amplitude and time, enabling the detection of multiple photons and improving sensitivity and noise rejection.
Instrumentation Cost-Benefit Analysis
When evaluating Raman spectroscopy versus mass spectrometry technologies, cost-benefit analysis of instrumentation reveals significant differences in initial investment, operational expenses, and long-term value proposition.
The initial acquisition costs present a stark contrast between these analytical techniques. Entry-level Raman spectrometers typically range from $20,000 to $50,000, while basic mass spectrometry systems start at approximately $100,000 and can exceed $500,000 for high-resolution instruments. This substantial difference in capital expenditure makes Raman spectroscopy more accessible for smaller laboratories and educational institutions with limited budgets.
Operational costs further differentiate these technologies. Mass spectrometry requires continuous investment in consumables such as carrier gases, vacuum pump maintenance, and specialized sample preparation materials, averaging $15,000-$30,000 annually. Raman systems, conversely, have minimal consumable requirements, with annual operational costs typically under $5,000, primarily for calibration standards and occasional laser maintenance.
Facility requirements also impact the total cost of ownership. Mass spectrometers demand controlled environments, dedicated power supplies, and often specialized ventilation systems. The spatial footprint ranges from 10-30 square meters for a complete MS setup. Raman instruments are considerably more compact, requiring only 1-2 square meters and standard laboratory conditions, translating to lower infrastructure costs.
Personnel expenses represent another significant consideration. Mass spectrometry typically requires specialized technicians with advanced training, commanding salaries 20-30% higher than general laboratory staff. Raman spectroscopy's more straightforward operation reduces the need for dedicated specialists, allowing existing laboratory personnel to operate the equipment after minimal training.
Return on investment calculations must consider throughput capabilities. While mass spectrometry offers superior detection limits (often in the parts-per-trillion range versus parts-per-million for Raman), this advantage must be weighed against higher per-sample analysis costs. Mass spectrometry sample analysis averages $50-150 per sample, while Raman spectroscopy typically costs $10-30 per sample, making the latter more economical for routine analyses where ultra-trace detection is unnecessary.
Maintenance contracts and service agreements constitute a substantial portion of long-term ownership costs. Annual service contracts for mass spectrometers typically range from 10-15% of the initial purchase price, while Raman systems average 5-8%. The expected operational lifespan also differs, with properly maintained mass spectrometers functioning effectively for 7-10 years before major upgrades are required, compared to 10-15 years for Raman systems.
Sample Preparation Requirements and Workflow Optimization
Sample preparation represents a critical determinant in the analytical performance of both Raman spectroscopy and mass spectrometry, significantly influencing their respective detection limits. The optimization of sample preparation workflows can substantially enhance sensitivity, specificity, and reproducibility of analytical results.
For Raman spectroscopy, minimal sample preparation is typically required for solid samples, offering a distinct advantage in terms of workflow efficiency. However, when dealing with complex matrices or trace analytes, concentration steps become necessary. Surface-enhanced Raman spectroscopy (SERS) substrates can dramatically improve detection limits by factors of 10^6 to 10^10, though this requires additional preparation steps including nanoparticle synthesis or substrate conditioning.
Mass spectrometry, conversely, demands more extensive sample preparation protocols. Liquid chromatography-mass spectrometry (LC-MS) applications typically require extraction, purification, and often derivatization steps. These procedures, while time-consuming, are essential for removing matrix interferences that could otherwise suppress ionization and compromise detection limits.
The extraction efficiency in mass spectrometry sample preparation directly correlates with achievable detection limits. Techniques such as solid-phase extraction (SPE), liquid-liquid extraction (LLE), and QuEChERS (Quick, Easy, Cheap, Effective, Rugged, and Safe) methodology have been optimized specifically to maximize analyte recovery while minimizing matrix effects.
Automation represents a significant advancement in sample preparation for both techniques. Automated sample preparation systems for mass spectrometry can improve reproducibility by reducing human error and standardizing extraction procedures. For Raman spectroscopy, automated sampling interfaces are increasingly being developed to enable high-throughput analysis while maintaining consistent measurement conditions.
Workflow integration considerations differ substantially between the techniques. Mass spectrometry workflows often incorporate internal standards and quality control samples to compensate for variations in extraction efficiency and instrument response. Raman spectroscopy workflows may include background subtraction algorithms and reference standards to account for substrate variability in SERS applications.
The time factor presents another important distinction. Raman spectroscopy sample preparation can often be completed in minutes, enabling rapid analysis. Mass spectrometry sample preparation may require hours, particularly for complex biological matrices requiring protein precipitation, enzymatic digestion, or extensive clean-up procedures.
Recent innovations focus on miniaturization and simplification of sample preparation for both techniques. Microextraction techniques for mass spectrometry and microfluidic sample handling for Raman spectroscopy represent emerging approaches that reduce sample volume requirements while potentially improving detection limits through more efficient analyte concentration.
Unlock deeper insights with PatSnap Eureka Quick Research — get a full tech report to explore trends and direct your research. Try now!
Generate Your Research Report Instantly with AI Agent
Supercharge your innovation with PatSnap Eureka AI Agent Platform!