
Method for fast and non-destructive differentiation of polyamide products
A polyamide and product technology, which is applied in the field of physical evidence identification, can solve the problems of small peak strength of fingerprint spectrum, insufficient crystallinity of polyamide products, poor response, etc., and achieve the effect of simple operation and rich fiber identification methods
Patent Information
- Authority / Receiving Office
- CN · China
- Patent Type
- Patents(China)
- Current Assignee / Owner
- Publication Date
- 2021-04-06
- Estimated Expiration
- Not applicable · inactive patent
Smart Images
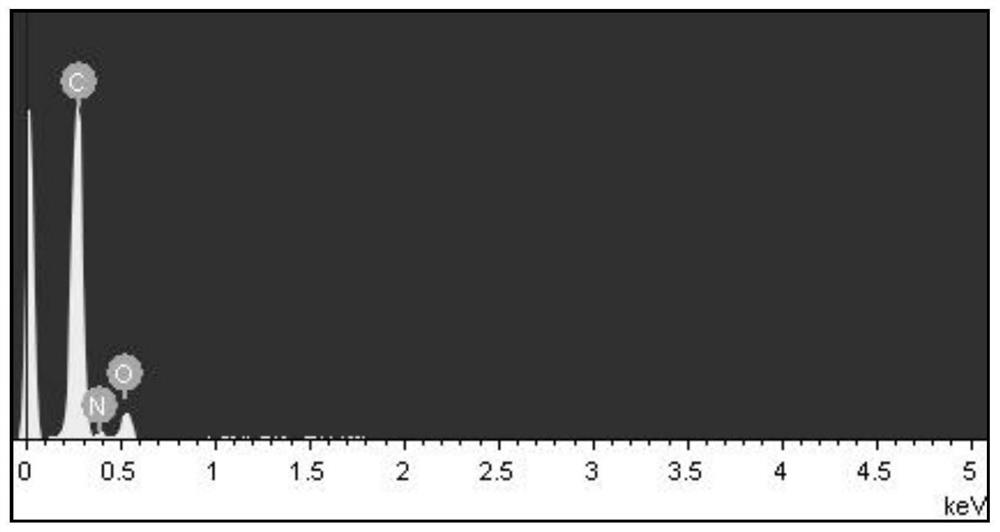
Figure 1 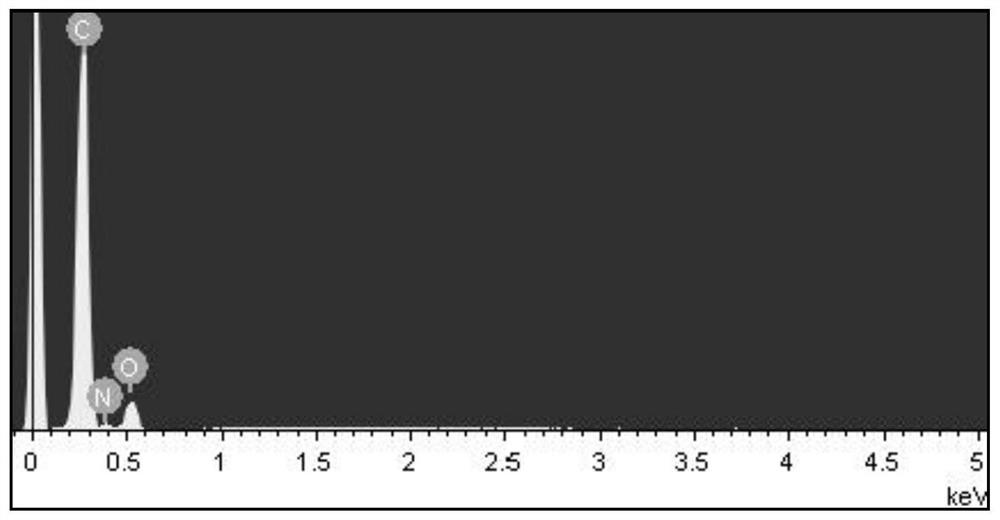
Figure 2 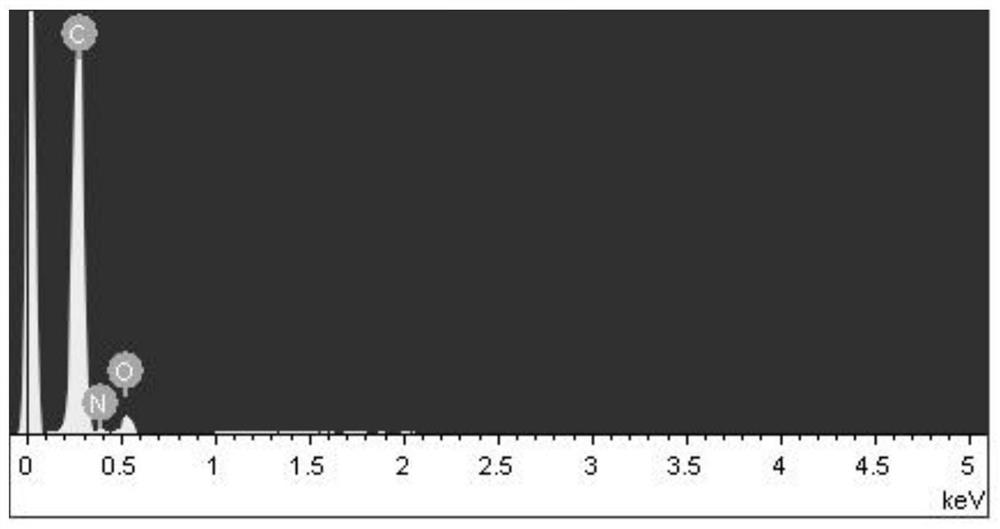
Figure 3
Abstract
Description
technical field
[0001] The invention relates to a method for identifying physical evidence such as fibers, in particular to a method for quickly and non-destructively distinguishing polyamide products. Background technique
[0002] Polyamide is also called nylon (Nylon), nylon, English name Polyamide, referred to as PA, which is the general term for polymers containing amide groups in the repeating unit of the macromolecular main chain. Polyamides can be prepared by ring-opening polymerization of lactams, or by polycondensation of diamines and dibasic acids. PA has good comprehensive properties, including mechanical properties, heat resistance, wear resistance, chemical resistance and self-lubricating properties, low friction coefficient, certain flame retardancy, easy processing, suitable for glass fiber and Other fillers are filled and modified to improve performance and expand application range. There are many varieties of PA, including PA6, PA66, PA11, PA12, PA46, PA61...
Examples
Embodiment 1
[0062] Place the sample 1 on the sample stage of the electron microscope, wait for the electron microscope to be vacuumed, apply a voltage of 20KV, and work at a distance of 10mm. Select a point with a flat surface and magnify it by 30 times for analysis. Record the elemental composition of the sample, the results are as figure 1 and as shown in Table 2, figure 1 Among them, the ordinate is the intensity of the peak, and the more the element content, the higher the peak. Table 2 shows the weight percentage and atomic percentage of C, N, and O elements quantitatively analyzed by the energy spectrometer.
[0063] Table 2 Elemental composition of sample 1
[0064] element weight percentage atomic percent C 64.25 69.32 N 14.94 13.82 O 20.81 16.85 Total 100.00
[0065] The same method was used to analyze and repeat the test five times, and the specific elemental composition of the samples was averaged to calculate the average percentage...
Embodiment 2
[0067] Place sample 2 on the electron microscope sample stage, wait for the electron microscope to be evacuated, apply a voltage of 20KV, and work at a distance of 10mm. Select a point with a flat surface and magnify it by 100 times for analysis. Record the elemental composition of the sample, the results are as figure 2 and as shown in Table 3, figure 2 Among them, the ordinate is the intensity of the peak, and the more the element content, the higher the peak. Table 3 shows the weight percentage and atomic percentage of C, N, and O elements quantitatively analyzed by the energy spectrometer. .
[0068] Table 3 Elemental composition of sample 2
[0069] element weight percentage atomic percent C 65.53 70.53 N 14.13 13.04 O 20.34 16.44 Total 100.00
[0070] The same method was used to analyze and repeat the test five times, and the specific elemental composition of the samples was averaged to calculate the average percentage of ...
Embodiment 3
[0072] Place the sample 3 on the sample stage of the electron microscope, wait for the electron microscope to be evacuated, apply a voltage of 20KV, and have a working distance of 10mm. Select a point with a flat surface and magnify it by 100 times for analysis. Record the elemental composition of the sample, the results are as image 3 and as shown in Table 4, image 3 Among them, the ordinate is the intensity of the peak, and the more element content, the higher the peak. Table 4 shows the weight percentage and atomic percentage of C, N, and O elements quantitatively analyzed by energy spectrometer.
[0073] Table 4 Elemental composition of sample 3
[0074] element weight percentage atomic percent C 71.28 75.58 N 13.76 12.51 O 14.96 11.91 Total 100.00
[0075] The same method was used to analyze and repeat the test five times, and the specific elemental composition of the samples was averaged to calculate the average percentage ...