
User interface for efficiently displaying relevant OCT imaging data
a user interface and imaging data technology, applied in the field of optical medical imaging, can solve the problems of time-consuming and laborious selection of images, loss of vision, and inability to efficiently display and achieve the effect of efficient display of relevant oct imaging data
Patent Information
- Authority / Receiving Office
- US · United States
- Patent Type
- Patents(United States)
- Current Assignee / Owner
- Publication Date
- 2012-07-17
Smart Images
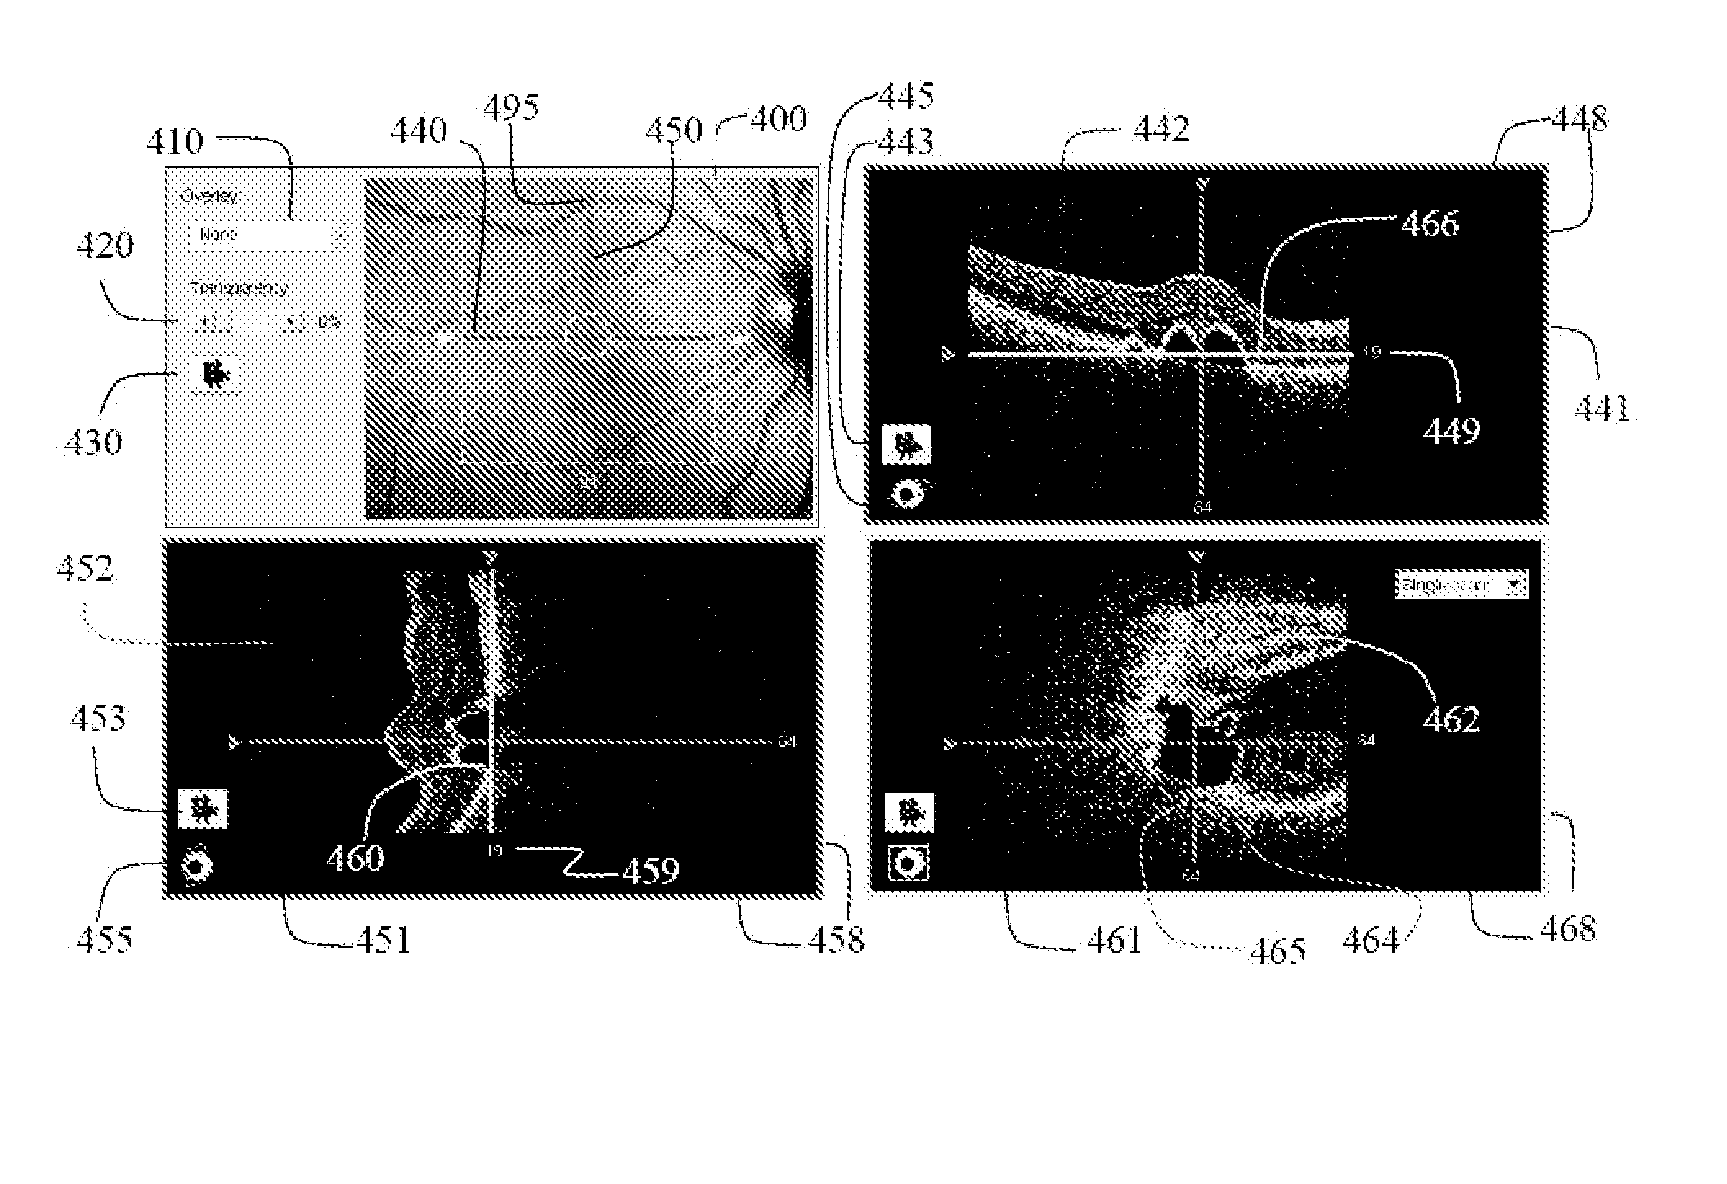
Figure 1 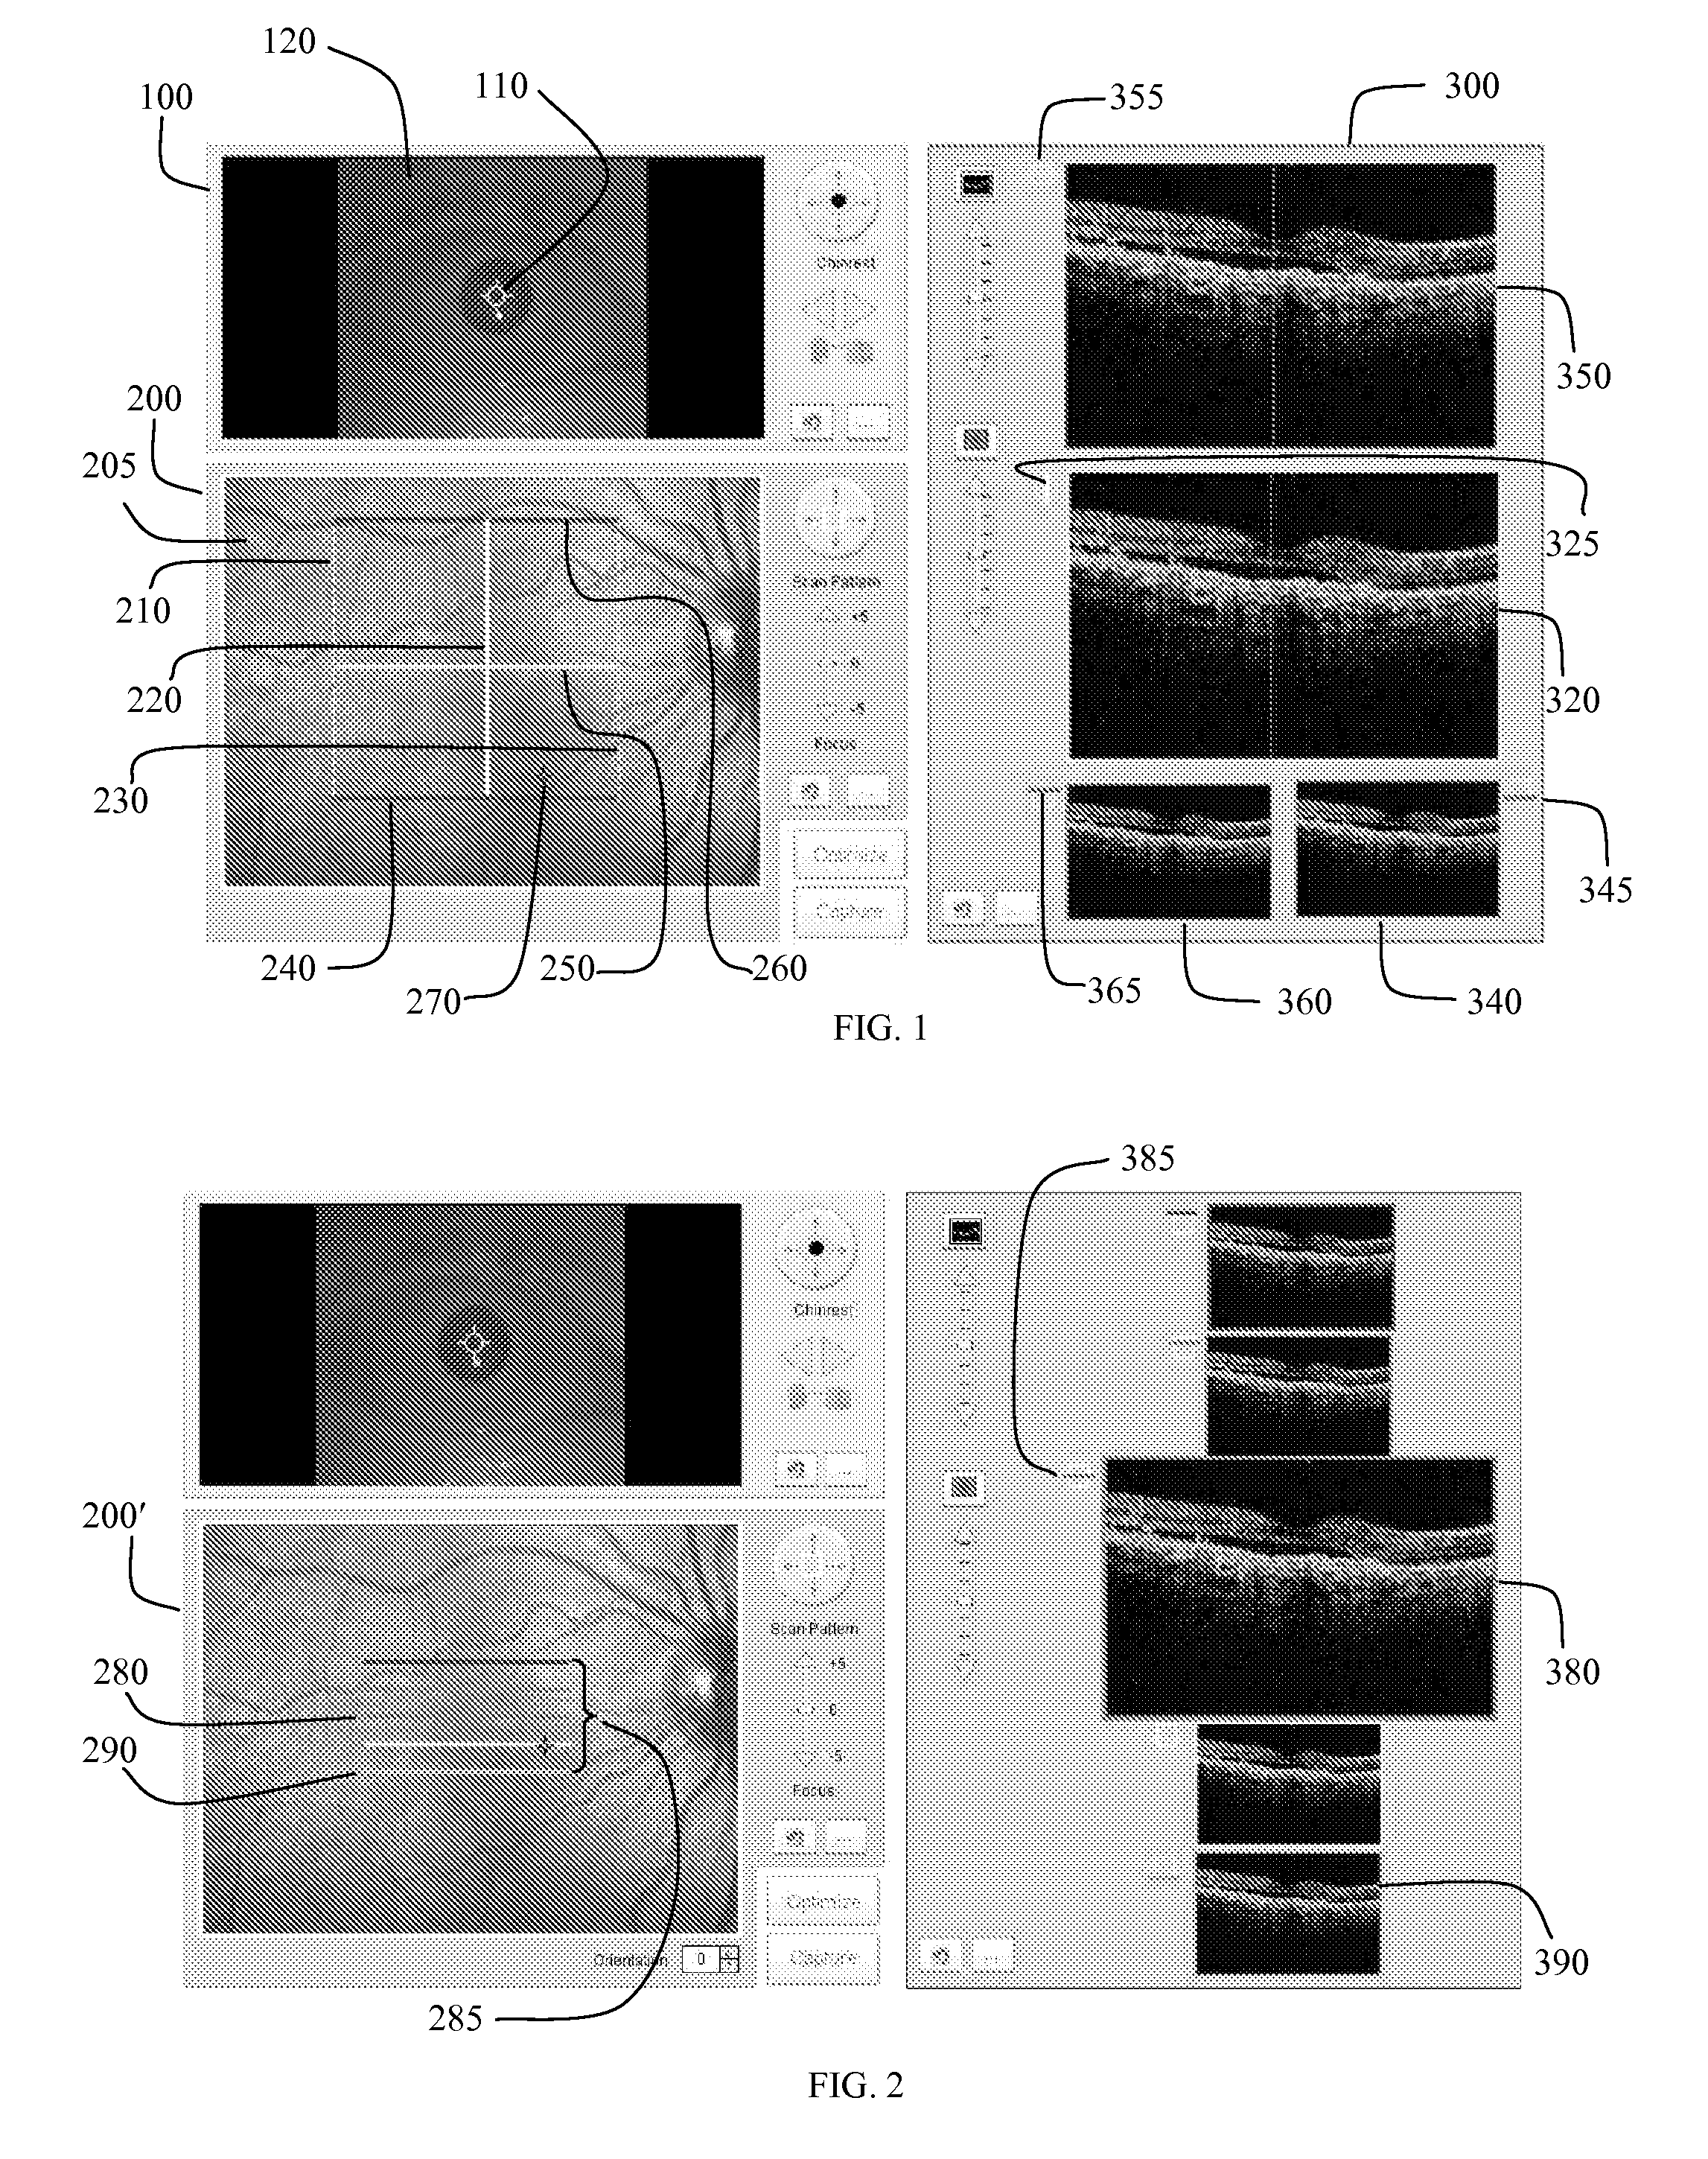
Figure 2 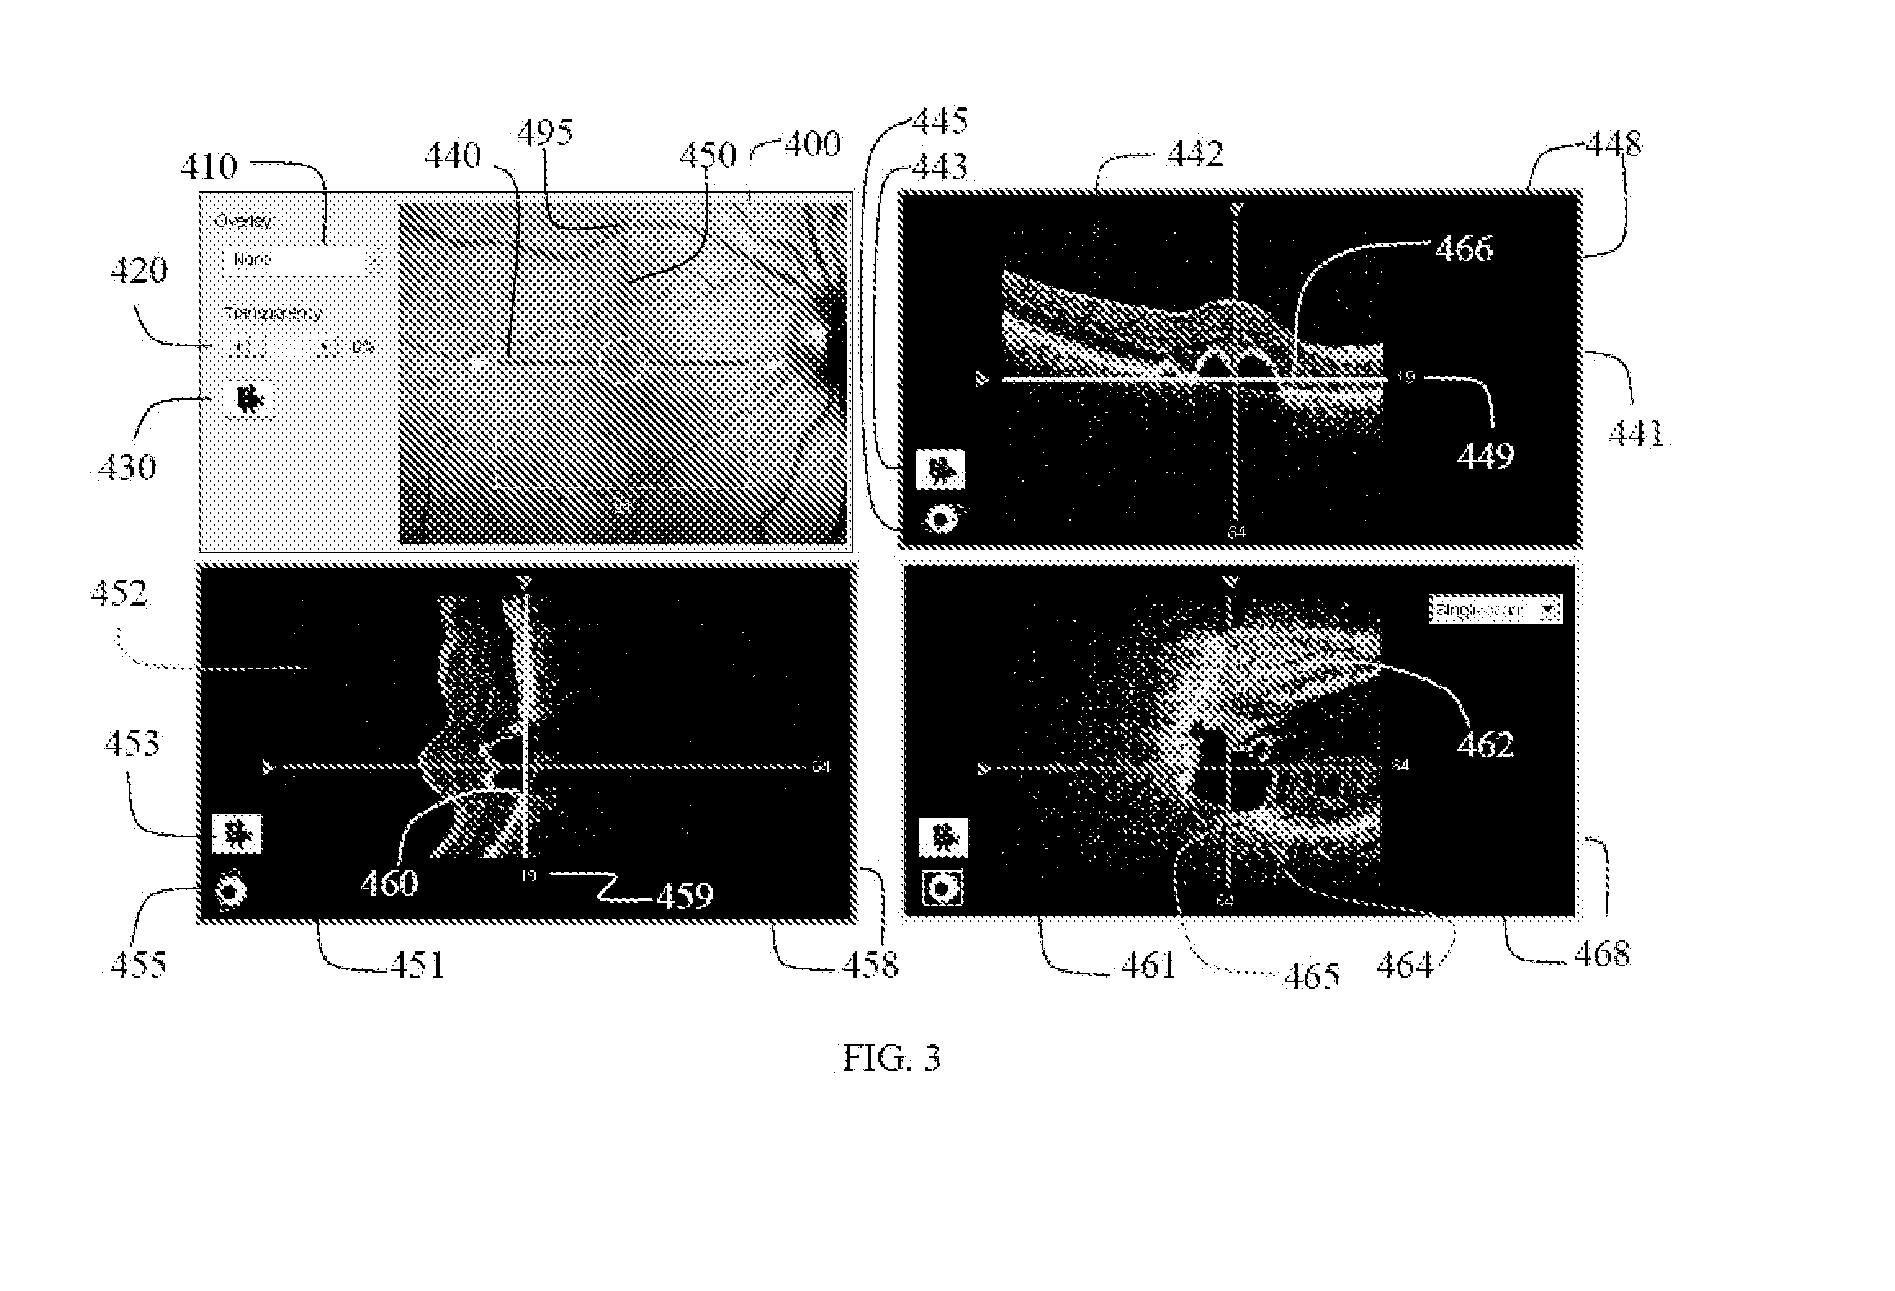
Figure 3
Abstract
Description
PRIORITY
[0001] This application claims the benefit of the filing date under 35 U.S.C. §119(e) of Provisional U.S. Patent Application Ser. No. 60 / 854,872, filed on Oct. 27, 2006, and Provisional U.S. Patent Application Ser. No. 60 / 857,451, filed on Nov. 7, 2006, which are hereby incorporated by reference in their entirety.ACKNOWLEDGEMENT OF GOVERNMENT SUPPORT
[0002] Portions of this disclosure were developed with Government support under Grant No. 6 R44EY014099-0, awarded by the National Institute of Health. The Government may have certain rights in the claimed inventions.TECHNICAL FIELD OF THE INVENTION
[0003] The present invention relates to optical medical imaging, and in particular to systems that are adapted to perform Optical Coherence Tomography (“OCT”) for use in diagnosis and monitoring of tissue health.BACKGROUND OF THE INVENTION
[0004] Optical Coherence Tomography (OCT) is a technology for performing high-resolution real time optical imaging in situ. OCT herein refers to any of t...
Examples
Embodiment Construction
[0045]The present invention is a User Interface (UI) efficiently providing the user with relevant OCT image displays. In one instance, the UI simultaneously displays images of the same region acquired during examinations performed at separate visits. Such displays enable the service provider to monitor changes in the patient's condition over time. The User Interface disclosed is useful for acquiring data, reviewing acquired data, simultaneously viewing multiple images, and manipulating analysis displays. The User Interface provides access to analysis applications that identify regions of interest, reduce the data, and display relevant information in an efficient manner. The User Interface uses image overlays to increase information density in a display area with minimal impact to the underlying display. Overlays help the user find, understand the location of, and visualize relevant data. Image thumbnails and composite image thumbnails are used to readily recognize (and optionally re...