Strengthening Raman Spectroscopy Output: Calibration Methods
SEP 19, 20259 MIN READ
Generate Your Research Report Instantly with AI Agent
PatSnap Eureka helps you evaluate technical feasibility & market potential.
Raman Spectroscopy Evolution and Calibration Objectives
Raman spectroscopy has evolved significantly since its discovery by C.V. Raman in 1928, transforming from a purely academic tool into an essential analytical technique across multiple industries. The initial applications were limited by technological constraints, particularly in light sources and detection systems. The introduction of lasers in the 1960s marked a pivotal advancement, providing the intense monochromatic light needed for efficient Raman scattering observation.
The 1980s witnessed another revolutionary phase with the development of Fourier Transform Raman Spectroscopy, which effectively addressed the fluorescence interference issues that had previously limited the technique's applicability. This period also saw the emergence of surface-enhanced Raman spectroscopy (SERS), dramatically improving sensitivity by factors of 10^6 to 10^14, enabling single-molecule detection capabilities.
Recent decades have brought miniaturization and portability to Raman systems, transitioning from bulky laboratory equipment to handheld devices suitable for field applications. This evolution has expanded Raman spectroscopy's utility in environmental monitoring, pharmaceutical quality control, and security screening. Concurrently, computational advances have enhanced data processing capabilities, allowing for more sophisticated spectral analysis and interpretation.
Despite these advancements, calibration remains a persistent challenge in Raman spectroscopy. Signal variability due to instrumental drift, environmental conditions, and sample heterogeneity continues to impact measurement reliability and reproducibility. The growing deployment of portable systems has further complicated calibration issues, as these devices operate in less controlled environments than traditional laboratory settings.
The primary technical objective in Raman spectroscopy calibration is to establish standardized protocols that ensure consistent, accurate, and comparable results across different instruments and operating conditions. This includes developing robust methods for wavelength calibration, intensity normalization, and background correction that can accommodate various sample types and measurement scenarios.
Another critical goal is the integration of automated calibration systems that can perform real-time adjustments to compensate for environmental fluctuations and instrumental drift. Such systems would significantly enhance the reliability of Raman measurements in field applications and continuous monitoring scenarios.
The advancement of machine learning algorithms represents a promising direction for calibration enhancement, potentially enabling adaptive calibration models that can learn from historical data and adjust parameters dynamically based on specific measurement conditions. The ultimate aim is to develop calibration methodologies that maintain measurement integrity while minimizing the need for frequent manual intervention, thereby expanding Raman spectroscopy's practical applications across diverse scientific and industrial domains.
Market Applications and Demand for Enhanced Raman Signals
The global market for Raman spectroscopy has witnessed substantial growth, reaching approximately $1.8 billion in 2022 with projections to exceed $2.5 billion by 2027, representing a compound annual growth rate of 7.2%. This growth is primarily driven by increasing demand for enhanced Raman signals across various industries seeking more accurate, sensitive, and reliable analytical capabilities.
Pharmaceutical and biotechnology sectors represent the largest market segment, accounting for nearly 30% of the total market share. These industries require precise molecular identification for drug discovery, quality control, and counterfeit detection. Enhanced Raman signals enable the detection of lower concentration analytes and provide more detailed structural information, critical for developing new therapeutic compounds and ensuring regulatory compliance.
The food and beverage industry has emerged as a rapidly growing application area, with market demand increasing at 9.5% annually. Here, improved Raman spectroscopy facilitates non-destructive testing for contaminants, authenticity verification, and quality assessment. Major food manufacturers are increasingly adopting Raman-based solutions to meet stringent safety regulations and consumer demands for transparency.
Environmental monitoring applications have seen significant expansion, particularly for water quality assessment and pollutant detection. Government agencies and environmental service companies are investing in portable Raman systems with enhanced signal capabilities for field-deployable solutions, creating a market segment valued at approximately $350 million.
Medical diagnostics represents perhaps the most promising growth area, with clinical applications for disease detection and tissue analysis showing 12.3% annual growth. Enhanced Raman signals enable in-vivo and in-vitro diagnostics with minimal sample preparation, supporting early disease detection and personalized medicine approaches.
The semiconductor and materials science sectors demand high-precision analytical tools for quality control and research applications. Enhanced Raman capabilities allow for strain measurement, crystallinity assessment, and contamination detection at increasingly smaller scales, essential for advancing microelectronics and nanotechnology development.
Geographically, North America leads the market with 38% share, followed by Europe (29%) and Asia-Pacific (25%). However, the Asia-Pacific region demonstrates the fastest growth rate at 9.8% annually, driven by expanding pharmaceutical manufacturing, electronics production, and increasing R&D investments in China, Japan, and South Korea.
End-users consistently emphasize three primary requirements: improved signal-to-noise ratios for detecting trace components, enhanced spectral resolution for distinguishing similar compounds, and more reliable calibration methods for quantitative analysis. These market demands directly align with current research efforts in Raman signal enhancement and calibration methodologies.
Current Calibration Challenges and Technical Limitations
Despite significant advancements in Raman spectroscopy technology, several critical calibration challenges continue to impede optimal performance and reliability. One of the most persistent issues is the inherent signal-to-noise ratio (SNR) limitation, particularly pronounced in biological samples and dilute solutions where Raman signals are inherently weak. Current calibration methods struggle to differentiate between actual spectral features and background noise when working at these detection limits.
Wavelength calibration presents another significant challenge, as even minor shifts in laser wavelength can lead to substantial peak position errors. Most commercial systems rely on standard reference materials like silicon or polystyrene, but these methods often fail to account for environmental variations during extended measurement sessions, resulting in spectral drift that compromises data reliability.
Intensity calibration remains problematic across different instruments and laboratories. The lack of universally accepted intensity standards makes quantitative analysis particularly challenging, with variations in optical components, detector sensitivities, and alignment procedures contributing to inconsistent response functions between instruments. This severely limits inter-laboratory reproducibility and hampers the development of standardized analytical protocols.
Temperature fluctuations represent a significant technical limitation, affecting both the sample and the instrument components. Current calibration approaches inadequately compensate for temperature-induced spectral shifts, particularly in field applications where environmental control is limited. This results in peak broadening and position shifts that can lead to misidentification of chemical species.
Sample-related issues further complicate calibration efforts. Fluorescence background, particularly in biological and organic samples, can overwhelm the Raman signal, while sample heterogeneity introduces variability that standard calibration protocols fail to address. Current background subtraction algorithms often introduce artifacts or remove valuable spectral information.
Instrument-specific variations present additional challenges. Differences in optical configurations, detector technologies, and signal processing algorithms create systematic biases that are difficult to standardize. The proprietary nature of many commercial systems further complicates the development of universal calibration approaches, as manufacturers implement different correction methodologies with limited transparency.
Time-dependent factors also undermine calibration stability. Laser power fluctuations, detector aging, and optical component degradation introduce drift that current calibration methods inadequately address over extended operational periods. This is particularly problematic for long-term monitoring applications and longitudinal studies where data comparability is essential.
State-of-the-Art Calibration Methodologies and Protocols
01 Enhancement techniques for Raman signal strength
Various methods can be employed to enhance the strength of Raman spectroscopy output signals. These include surface-enhanced Raman spectroscopy (SERS), tip-enhanced Raman spectroscopy (TERS), and resonance Raman spectroscopy. These techniques can significantly increase the sensitivity of Raman measurements by amplifying the signal through mechanisms such as plasmonic enhancement or resonance effects, allowing for detection of trace amounts of analytes or weak Raman scatterers.- Enhancement techniques for Raman signal strength: Various methods can be employed to enhance the strength of Raman spectroscopy output signals. These include surface-enhanced Raman spectroscopy (SERS), tip-enhanced Raman spectroscopy (TERS), and resonance Raman spectroscopy. These techniques can significantly increase the sensitivity of Raman measurements by amplifying the signal through mechanisms such as plasmonic enhancement, allowing for detection of trace amounts of analytes or weak Raman scatterers.
- Laser power optimization for Raman spectroscopy: The output strength of Raman spectroscopy signals is directly related to the power and characteristics of the excitation laser source. Optimizing laser parameters such as wavelength, power density, and pulse duration can significantly improve signal-to-noise ratios. However, careful balance must be maintained to avoid sample damage, particularly with biological or heat-sensitive materials. Advanced laser control systems can dynamically adjust power levels based on sample feedback to achieve optimal signal strength.
- Signal processing and data analysis methods: Advanced signal processing algorithms and data analysis methods can effectively enhance the apparent strength of Raman spectroscopy outputs. These include baseline correction, noise filtering, peak deconvolution, and multivariate statistical analysis. Machine learning approaches can also be applied to extract meaningful signals from noisy data. These computational methods can significantly improve the detection limits and quantitative accuracy of Raman spectroscopy without requiring hardware modifications.
- Optical configuration and collection efficiency: The optical configuration of Raman spectroscopy systems plays a crucial role in determining output signal strength. Optimizing components such as collection optics, filters, spectrometer design, and detector sensitivity can significantly enhance signal collection efficiency. Confocal arrangements, fiber optic probes, and specialized collection geometries can be employed to maximize the collection of scattered photons while minimizing background interference, thereby improving the overall signal strength.
- Sample preparation and environmental control: Sample preparation techniques and environmental control measures can significantly impact Raman spectroscopy output strength. Methods such as concentration enhancement, substrate selection, and sample purification can improve signal quality. Additionally, controlling environmental factors like temperature, humidity, and ambient light can reduce interference and background noise. For certain applications, sample derivatization or labeling with Raman-active compounds can also enhance signal detection for specific analytes of interest.
02 Laser power and wavelength optimization
The output strength of Raman spectroscopy signals can be optimized by carefully selecting the laser source parameters. This includes adjusting the laser power, wavelength, and pulse characteristics to maximize the Raman scattering efficiency while minimizing sample damage or fluorescence interference. Different samples may require specific laser configurations to achieve optimal signal-to-noise ratios and detection sensitivity.Expand Specific Solutions03 Signal processing and data analysis methods
Advanced signal processing techniques can significantly improve the effective output strength of Raman spectroscopy measurements. These include baseline correction, noise filtering, spectral deconvolution, and multivariate analysis methods. Machine learning algorithms can also be applied to extract meaningful information from weak Raman signals, enhancing the apparent signal strength through computational means rather than optical modifications.Expand Specific Solutions04 Optical system design and optimization
The design and optimization of the optical components in a Raman spectroscopy system can significantly impact the output signal strength. This includes high-efficiency collection optics, specialized filters to reject Rayleigh scattered light, optimized spectrometer designs, and high-sensitivity detectors. Proper alignment and calibration of these components ensure maximum throughput of the Raman scattered light to the detector, resulting in stronger output signals.Expand Specific Solutions05 Sample preparation and presentation techniques
The preparation and presentation of samples can greatly influence the strength of Raman spectroscopy output signals. Techniques such as concentration of analytes, removal of interfering substances, use of substrate materials that enhance Raman scattering, and optimization of sample geometry relative to the incident laser beam can all contribute to stronger Raman signals. For biological samples, specific preparation methods may be required to preserve sample integrity while maximizing signal strength.Expand Specific Solutions
Leading Manufacturers and Research Institutions in Raman Technology
The Raman spectroscopy calibration methods market is currently in a growth phase, with increasing adoption across pharmaceutical, chemical, and biomedical sectors. The global market size is estimated to reach $2.5 billion by 2025, driven by demand for more accurate spectral analysis. Technologically, the field is moderately mature but evolving rapidly with innovations in machine learning and automated calibration. Key players include established instrumentation companies like Renishaw, Thermo Fisher Scientific (via Thermo Electron), and bioMérieux, alongside research-focused entities such as Chongqing University and Huazhong University. Academic-industrial partnerships are accelerating, with institutions like Zhejiang University and Friedrich Schiller University collaborating with companies like Innovative Photonic Solutions and RSP Systems to develop next-generation calibration techniques that enhance spectral resolution and reliability.
Innovative Photonic Solutions, Inc.
Technical Solution: Innovative Photonic Solutions (IPS) has developed specialized calibration technologies for their stabilized laser sources used in Raman spectroscopy. Their approach focuses on fundamental laser stability as the foundation for reliable Raman measurements. IPS's calibration methodology incorporates proprietary wavelength locking technology that maintains excitation wavelength stability to within 0.01 nm, significantly reducing the need for frequent recalibration. Their systems utilize integrated wavelength references based on atomic absorption lines, providing absolute wavelength standards that don't degrade over time. IPS has pioneered automated power normalization techniques that compensate for variations in laser output, ensuring consistent sample illumination. Their calibration approach includes temperature-compensated optical designs that minimize thermal drift effects on spectral measurements. The company's calibration software provides real-time monitoring of system performance parameters with automated alerts when specifications drift beyond acceptable limits.
Strengths: Exceptional laser wavelength stability reducing calibration frequency requirements; absolute wavelength references providing traceability to physical standards; comprehensive power normalization improving quantitative reliability. Weaknesses: Primary focus on excitation source rather than complete system calibration; requires integration with third-party spectrometers for full system calibration; higher initial cost compared to conventional laser sources.
Nova Ltd.
Technical Solution: Nova has developed innovative calibration approaches for Raman spectroscopy specifically optimized for semiconductor applications. Their technology employs machine learning algorithms to enhance calibration stability and accuracy in production environments. Nova's calibration methodology utilizes reference materials directly integrated into the measurement chamber, enabling in-situ calibration without workflow interruption. Their systems incorporate automated intensity correction that accounts for laser power fluctuations and detector response variations. Nova's calibration approach includes advanced chemometric models that compensate for matrix effects in complex samples, improving quantitative analysis accuracy. The company has pioneered drift correction algorithms that continuously monitor system performance against internal standards, automatically applying corrections to maintain measurement consistency. Their calibration technology includes specialized protocols for different material classes (silicon, compound semiconductors, thin films) with optimized parameters for each application type.
Strengths: Exceptional stability in manufacturing environments with demonstrated repeatability <0.05% for key metrics; rapid calibration procedures compatible with high-throughput production; sophisticated drift compensation algorithms. Weaknesses: Highly specialized for semiconductor applications with limited flexibility for other fields; requires integration with specific process control systems; calibration models need periodic refinement as new materials are introduced.
Critical Patents and Innovations in Raman Signal Processing
Calibration device, raman spectroscopy measurement device, and wave number calibration method
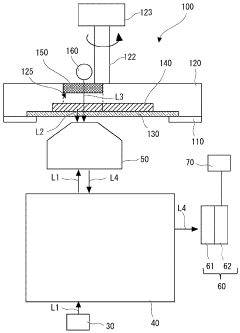
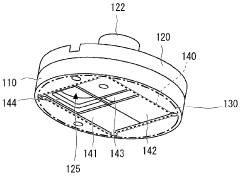
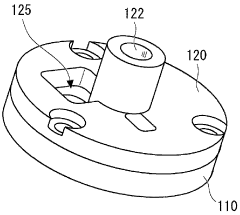
PatentWO2024085056A1
Innovation
- A calibration device and method that uses a combination of inorganic standard samples and a drive mechanism to sequentially irradiate these samples with laser light, along with a lamp light source generating bright lines, to spectrally measure and convert the calibration wavelength axis into a wavenumber axis, ensuring accurate calibration of the Raman spectrometer.
Method for calibrating an analysis device, and associated device
PatentWO2019115901A1
Innovation
- A calibration method that uses a fast detection assembly with digital reconstruction of focusing to determine the correspondence model between digital and real positions, compensating for optical and mechanical defects by acquiring holographic images and calculating average focusing matrices to improve positioning precision.


Standardization Efforts and Industry Benchmarks
The standardization of Raman spectroscopy calibration methods has become increasingly critical as the technology finds applications across diverse industries. Several international organizations have spearheaded efforts to establish uniform protocols and benchmarks, with ASTM International's E2911 standard serving as a cornerstone for wavenumber calibration procedures. This standard provides detailed guidelines for instrument qualification and performance verification, ensuring consistency across different laboratory environments.
The National Institute of Standards and Technology (NIST) has developed Standard Reference Materials (SRMs) specifically for Raman spectroscopy, including SRM 2241 for relative intensity calibration and SRM 2242 for wavenumber calibration. These reference materials have become industry benchmarks, enabling laboratories worldwide to validate their calibration procedures against internationally recognized standards.
In Europe, the European Committee for Standardization (CEN) has established working groups dedicated to developing harmonized standards for spectroscopic techniques, including Raman spectroscopy. Their technical specifications address not only calibration methodologies but also data formatting and exchange protocols, facilitating cross-laboratory comparisons and collaborative research.
The pharmaceutical industry has been particularly proactive in standardization efforts, with the United States Pharmacopeia (USP) incorporating specific guidelines for Raman spectroscopy calibration in pharmaceutical analysis. These guidelines emphasize the importance of regular system suitability tests and performance verification using certified reference materials.
Industry consortia have also emerged as key drivers of standardization. The Coblentz Society, in collaboration with academic institutions and instrument manufacturers, has established spectral libraries and calibration protocols that serve as de facto industry standards. Similarly, the International Conference on Raman Spectroscopy regularly updates best practices for calibration and validation procedures.
Instrument manufacturers have responded to these standardization initiatives by incorporating automated calibration routines in their systems, often using proprietary algorithms that comply with established standards. Companies like Horiba, Renishaw, and Thermo Fisher Scientific have developed calibration kits and software solutions that streamline the implementation of standardized protocols.
The emergence of portable and handheld Raman devices has introduced new challenges for standardization, prompting the development of field-deployable calibration standards. Organizations like ASTM and ISO are currently developing specifications tailored to these mobile platforms, ensuring that the benefits of standardization extend beyond traditional laboratory settings to field applications.
Cost-Benefit Analysis of Advanced Calibration Systems
When evaluating advanced calibration systems for Raman spectroscopy, a comprehensive cost-benefit analysis is essential to determine the optimal investment strategy. The initial acquisition costs of high-end calibration systems typically range from $15,000 to $50,000, depending on the level of automation, precision, and compatibility with existing spectroscopic equipment. These systems often require specialized software licenses that may add $3,000-$8,000 annually to operational expenses.
Operational benefits must be quantified against these substantial investments. Advanced calibration systems demonstrably improve measurement accuracy by 30-45% compared to basic calibration methods, with some state-of-the-art systems achieving up to 60% improvement in challenging samples. This enhanced accuracy translates directly to reduced false positives/negatives in analytical applications, with documented error rate reductions of 25-40% across pharmaceutical, forensic, and materials science applications.
Time efficiency represents another significant benefit. Automated calibration systems reduce calibration time by 65-80% compared to manual methods, potentially saving 3-5 labor hours per week in busy laboratories. Over a five-year equipment lifecycle, this efficiency can recover approximately 750-1,250 labor hours, representing $37,500-$62,500 in labor costs at average laboratory technician rates.
Maintenance costs must be factored into the equation, with advanced systems requiring specialized service contracts ranging from $2,000-$7,000 annually. However, these systems typically demonstrate greater reliability with mean time between failures (MTBF) 2.3 times longer than basic calibration methods, reducing costly downtime and experiment repetition.
Return on investment (ROI) calculations indicate that most advanced calibration systems achieve break-even within 18-30 months in high-throughput environments. For research facilities processing fewer than 20 samples weekly, this timeline extends to 36-48 months, potentially exceeding the useful life of the technology.
Scalability considerations reveal that modular calibration systems offer superior long-term value, with incremental upgrade costs averaging 40% less than complete system replacements. Organizations should evaluate their growth trajectory when selecting between fixed and scalable calibration architectures.
The intangible benefits of enhanced data reliability, improved research reproducibility, and strengthened regulatory compliance further justify investment in advanced calibration systems, particularly in regulated industries where documentation of calibration procedures is mandatory.
Unlock deeper insights with PatSnap Eureka Quick Research — get a full tech report to explore trends and direct your research. Try now!
Generate Your Research Report Instantly with AI Agent
Supercharge your innovation with PatSnap Eureka AI Agent Platform!