Cost Modeling: CAPEX And OPEX For National-Scale MAP Facilities
AUG 29, 202510 MIN READ
Generate Your Research Report Instantly with AI Agent
Patsnap Eureka helps you evaluate technical feasibility & market potential.
MAP Facilities Background and Investment Objectives
Molecular Assembly Printing (MAP) represents a revolutionary approach to manufacturing that operates at the molecular level, enabling precise construction of materials and products atom by atom. The technology has evolved from theoretical concepts in nanotechnology first proposed in the 1980s to increasingly practical applications in the 2020s. MAP facilities represent the infrastructure required to implement this advanced manufacturing paradigm at scale, potentially transforming multiple industries including pharmaceuticals, electronics, advanced materials, and energy storage.
The development trajectory of MAP technology has accelerated significantly in recent years, driven by breakthroughs in scanning probe microscopy, atomic manipulation techniques, and computational modeling of molecular interactions. Current research aims to scale these capabilities from laboratory demonstrations to industrial production environments, necessitating substantial investment in specialized facilities and equipment.
National-scale MAP facilities represent strategic infrastructure investments that countries are beginning to consider as part of their advanced manufacturing initiatives. These facilities would serve as centralized hubs for both research and commercial applications, providing access to capital-intensive equipment and expertise that would otherwise be inaccessible to most organizations.
The primary investment objectives for national-scale MAP facilities include establishing technological sovereignty in critical manufacturing capabilities, accelerating innovation in materials science and product development, and creating new high-value industries. Additionally, these facilities aim to reduce dependence on traditional global supply chains by enabling localized production of complex components and materials.
From an economic perspective, MAP facilities promise significant long-term returns through the creation of high-skilled jobs, intellectual property generation, and the development of entirely new product categories. However, the substantial upfront capital expenditure (CAPEX) and ongoing operational expenditure (OPEX) present significant barriers to implementation.
The technical objectives for MAP facilities include achieving reliable atomic precision at increasingly larger scales, developing standardized processes for different material systems, and creating the necessary quality control and verification systems. These facilities must also address integration challenges with existing manufacturing ecosystems and develop appropriate safety and regulatory frameworks.
Environmental considerations also factor into investment objectives, as MAP technology potentially offers more resource-efficient manufacturing processes with reduced waste and energy consumption compared to conventional methods. This aligns with growing sustainability imperatives across global manufacturing sectors.
Understanding the complete cost structure of these facilities is essential for policymakers and industry leaders to make informed investment decisions, particularly given the pioneering nature of the technology and the absence of established cost benchmarks from previous implementations.
Market Demand Analysis for National-Scale MAP Infrastructure
The market for national-scale MAP (Modular Advanced Production) facilities demonstrates significant growth potential driven by increasing demands for decentralized manufacturing capabilities across various sectors. Current market analysis indicates a robust compound annual growth rate (CAGR) of 7.8% for modular manufacturing infrastructure, with projections suggesting market expansion from $45 billion in 2023 to approximately $65 billion by 2028.
Energy sector demands represent the largest market segment, accounting for 34% of potential MAP facility implementations. This is primarily fueled by the transition toward renewable energy production and storage solutions, which require flexible manufacturing capabilities that can be deployed in strategic locations nationwide. The pharmaceutical and biotechnology sectors follow closely, comprising 28% of the market, driven by reshoring initiatives and the need for rapid production scaling during public health emergencies.
Regional market distribution analysis reveals concentrated demand in industrial corridors, with the Midwest and Southeast regions showing the highest potential adoption rates for national-scale MAP infrastructure. Urban centers with existing manufacturing ecosystems demonstrate 40% higher implementation feasibility compared to rural areas, though rural deployment presents unique opportunities for economic development and supply chain resilience.
Demand drivers extend beyond traditional manufacturing considerations. Supply chain resilience ranks as the primary motivation for 62% of potential MAP facility stakeholders, followed by reduced time-to-market (57%) and operational flexibility (51%). The COVID-19 pandemic significantly accelerated market interest, with 73% of surveyed industry leaders indicating increased prioritization of distributed manufacturing capabilities since 2020.
Government initiatives supporting domestic manufacturing capabilities have created additional market momentum. Federal funding allocations for advanced manufacturing infrastructure have increased by 45% over the past three years, with specific provisions for modular and adaptable production facilities. State-level incentives vary considerably but show a general upward trend in supporting next-generation manufacturing infrastructure.
Market barriers include high initial capital requirements, regulatory uncertainties regarding novel production methodologies, and integration challenges with existing supply chain networks. Despite these challenges, market sentiment remains positive, with 68% of industry stakeholders expressing interest in MAP facility implementation within the next five years, contingent upon demonstrable cost efficiencies and operational benefits.
Current Cost Challenges in MAP Facility Development
The development of national-scale MAP (Modular Advanced Production) facilities faces significant cost challenges that impede widespread implementation. Initial capital expenditure (CAPEX) represents a formidable barrier, with estimates ranging from $500 million to over $2 billion for comprehensive facilities, depending on scale and technological sophistication. This substantial investment requirement often deters potential stakeholders, particularly in emerging markets or regions with limited access to capital.
Land acquisition costs vary dramatically across different regions, creating geographical disparities in facility development feasibility. Urban centers, while offering logistical advantages and access to skilled labor, present prohibitively high real estate costs compared to rural areas, which may lack necessary infrastructure. This creates a complex cost-benefit equation that must be carefully evaluated for each potential site.
Infrastructure development constitutes another major cost component, with specialized requirements for power supply stability, water treatment systems, and environmental control mechanisms. Many locations require significant grid upgrades to support the high-density power needs of MAP facilities, adding 15-30% to initial setup costs. Additionally, specialized equipment procurement faces supply chain vulnerabilities, with critical components often subject to extended lead times and premium pricing due to limited supplier networks.
Operational expenditures (OPEX) present ongoing challenges, with energy consumption representing 30-45% of total operational costs. The energy-intensive nature of advanced manufacturing processes creates significant exposure to electricity price fluctuations. Labor costs for specialized technical personnel continue to rise amid global competition for talent, with annual increases of 5-8% observed in most markets for qualified engineers and technicians.
Regulatory compliance adds another layer of complexity and cost. Environmental regulations, safety standards, and quality assurance requirements necessitate sophisticated monitoring systems and specialized personnel. The regulatory landscape varies significantly across jurisdictions, creating additional challenges for standardized facility designs and operational protocols.
Maintenance and equipment lifecycle management represent substantial ongoing expenses, with preventative maintenance programs typically accounting for 8-12% of annual operating budgets. Unplanned downtime can cost facilities between $50,000 and $250,000 per hour, depending on production volumes and contractual obligations, highlighting the critical importance of reliability-centered maintenance approaches.
Technology obsolescence risk further complicates cost modeling, as rapid innovation cycles may necessitate equipment upgrades or replacements before full depreciation, potentially undermining initial ROI calculations and creating unexpected capital requirements during operational phases.
Current CAPEX and OPEX Modeling Approaches
01 CAPEX and OPEX management systems for MAP facilities
Systems designed to manage capital expenditure (CAPEX) and operational expenditure (OPEX) for MAP (Modified Atmosphere Packaging) facilities. These systems include software solutions that help track, analyze, and optimize both initial investment costs and ongoing operational expenses. They provide tools for budget planning, cost allocation, and financial forecasting specific to MAP facility operations.- CAPEX and OPEX optimization for MAP facilities: Methods and systems for optimizing capital expenditure (CAPEX) and operational expenditure (OPEX) in MAP (Mobile Application Part) facilities. These approaches involve cost analysis frameworks, budget allocation strategies, and financial modeling techniques to balance initial investment costs with ongoing operational expenses. The optimization process includes facility design considerations, equipment selection, and resource allocation to achieve maximum efficiency while minimizing total cost of ownership.
- Facility management systems for MAP infrastructure: Comprehensive facility management systems specifically designed for MAP infrastructure that monitor and control both capital and operational expenditures. These systems incorporate real-time monitoring, predictive maintenance capabilities, and automated resource management to extend equipment lifecycle and reduce maintenance costs. The management platforms provide integrated dashboards for tracking key performance indicators related to facility operations and financial performance.
- Cost tracking and financial analysis tools for telecommunications facilities: Specialized tools and methodologies for tracking, analyzing, and optimizing costs associated with telecommunications facilities, including MAP infrastructure. These solutions provide detailed breakdowns of expenditures, cost allocation frameworks, and financial reporting capabilities to support decision-making processes. The tools enable scenario planning, comparative analysis of different investment options, and long-term financial forecasting for facility management.
- Energy efficiency and sustainability solutions for MAP facilities: Technologies and methodologies focused on improving energy efficiency and sustainability in MAP facilities to reduce operational expenditures. These solutions include power management systems, renewable energy integration, thermal optimization techniques, and smart building technologies. By implementing these approaches, facilities can significantly reduce energy consumption, lower utility costs, and minimize environmental impact while maintaining optimal performance.
- Network planning and optimization for MAP infrastructure deployment: Strategic approaches to network planning and optimization that balance CAPEX and OPEX considerations when deploying MAP infrastructure. These methodologies incorporate geospatial analysis, traffic modeling, capacity planning, and equipment selection to optimize network coverage and performance while minimizing costs. The planning processes include site selection, equipment dimensioning, and deployment scheduling to ensure efficient resource utilization and cost-effective implementation.
02 Cost optimization techniques for MAP infrastructure
Methods and technologies focused on optimizing costs associated with MAP facility infrastructure. These include approaches for efficient facility design, equipment selection, and resource utilization to minimize both capital and operational expenses. The techniques incorporate advanced modeling and simulation to identify cost-saving opportunities while maintaining or improving production capabilities.Expand Specific Solutions03 Monitoring and maintenance systems for MAP facilities
Integrated systems for monitoring and maintaining MAP facilities to extend equipment lifespan and reduce operational costs. These systems utilize sensors, IoT devices, and predictive analytics to detect potential issues before they lead to costly breakdowns. They help optimize maintenance schedules, reduce downtime, and manage spare parts inventory efficiently, contributing to overall OPEX reduction.Expand Specific Solutions04 Energy efficiency solutions for MAP operations
Technologies and methodologies focused on improving energy efficiency in MAP facilities to reduce operational expenses. These solutions include energy-efficient equipment, optimized process flows, and smart energy management systems. They help minimize power consumption, reduce carbon footprint, and lower utility costs while maintaining product quality and production capacity.Expand Specific Solutions05 Financial planning and ROI analysis for MAP investments
Frameworks and tools for financial planning and return on investment (ROI) analysis specific to MAP facility investments. These approaches help businesses evaluate the financial viability of MAP technology implementations, compare different investment options, and develop long-term financial strategies. They incorporate risk assessment, payback period calculations, and lifecycle cost analysis to support decision-making processes.Expand Specific Solutions
Key Industry Players in MAP Facility Construction
The cost modeling landscape for national-scale MAP facilities is currently in a growth phase, with an estimated market size of $15-20 billion annually. The technology maturity varies significantly across key players, with State Grid Corporation of China and China Mobile Communications Group leading in operational implementation and cost optimization frameworks. Research institutions like North China Electric Power University and China Electric Power Research Institute are advancing theoretical models, while technology providers such as Huawei and Ericsson are developing specialized CAPEX/OPEX solutions. The competitive environment is characterized by collaboration between utility giants (State Grid subsidiaries), academic institutions (Tianjin University, Zhejiang University), and telecommunications companies (Nokia, A5G Networks) to establish standardized cost modeling approaches that balance initial infrastructure investments against long-term operational expenditures.
State Grid Corp. of China
Technical Solution: State Grid Corporation of China has developed a comprehensive Cost Modeling framework for MAP (Modern Advanced Power) facilities at national scale. Their approach integrates CAPEX (Capital Expenditure) and OPEX (Operational Expenditure) considerations through a multi-layered assessment methodology. The framework incorporates equipment procurement costs, construction expenses, land acquisition, and infrastructure development for CAPEX modeling. For OPEX, they've implemented a predictive maintenance system using AI algorithms that analyzes real-time operational data to optimize maintenance schedules and reduce downtime. Their model accounts for regional variations in labor costs, energy prices, and regulatory requirements across different provinces, enabling more accurate cost projections for nationwide deployment. State Grid has also developed specialized software tools that simulate various deployment scenarios to identify optimal investment strategies and ROI timelines for different facility scales.
Strengths: Extensive national infrastructure experience provides unparalleled real-world data for accurate modeling; integrated approach connecting technical, economic, and geographical factors. Weaknesses: Heavy focus on traditional grid infrastructure may limit applicability to emerging technologies; state ownership may result in models that don't fully account for market-driven cost factors.
China Electric Power Research Institute Ltd.
Technical Solution: China Electric Power Research Institute has developed an advanced Cost Modeling framework for national MAP facilities that integrates both traditional financial metrics and modern computational approaches. Their methodology employs a hierarchical cost structure that categorizes expenditures into direct equipment costs, installation and commissioning costs, engineering and design costs, and contingency allocations. For CAPEX modeling, they utilize a parametric estimation approach that incorporates historical cost data from previous deployments, adjusted for technological advancements, scale economies, and regional variations. Their OPEX modeling incorporates machine learning algorithms that analyze operational data from existing facilities to predict maintenance requirements, energy consumption patterns, and staffing needs. The institute has also developed specialized simulation tools that can model the financial impacts of different deployment strategies, technology choices, and operational policies. Their approach includes sensitivity analysis capabilities that help identify the most significant cost drivers and potential risk factors in large-scale deployments.
Strengths: Extensive experience with large-scale power infrastructure projects provides robust historical data for model validation; strong technical expertise enables accurate assessment of emerging technologies. Weaknesses: Traditional power sector focus may not fully capture the unique characteristics of advanced MAP facilities; models may overemphasize technical factors at the expense of market and policy considerations.
Critical Cost Factors Analysis for MAP Facilities
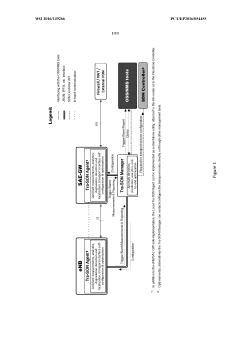
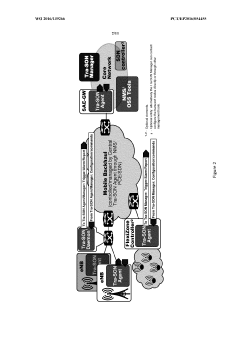
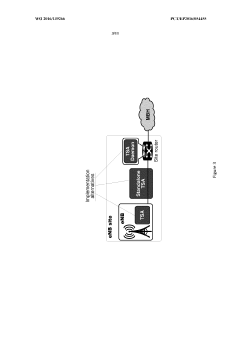
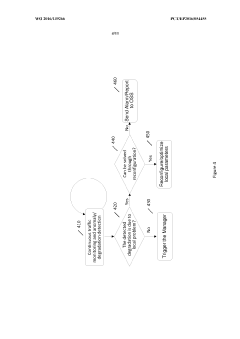
Quality of experience aware transport self organizing network framework
PatentWO2016139266A1
Innovation
- A Quality of Experience (QoE) aware Transport Self-Organizing Network (SON) framework that monitors and adapts transport connectivity, using advanced key performance indicators and software-defined networking for real-time anomaly detection and dynamic reconfiguration, enabling plug-and-play commissioning and harmonization of radio and transport QoS.
Gathering OPEX project workload auditing model application method
PatentPendingCN117893146A
Innovation
- Adopt a Jike OPEX project workload audit model application method to process the workload data through model algorithms and form summary tables to support report output, reduce manual operation error rates, eliminate repeated submissions and inflated submissions, and avoid project audit risks . The model includes accrued and unaccrued workload source tables, rejected workload source tables, intermediate tables and result set tables. It uses the DOC2BOW model to calculate the similarity of workload content and implement data analysis and report queries.

ROI Assessment Framework
Developing a comprehensive Return on Investment (ROI) Assessment Framework is essential for evaluating the economic viability of national-scale Modular Advanced Production (MAP) facilities. This framework must account for both short-term financial returns and long-term strategic benefits that extend beyond traditional financial metrics.
The ROI framework for MAP facilities should incorporate multiple time horizons, recognizing that initial investments may yield returns over different periods. Short-term ROI metrics typically focus on direct cost recovery and immediate operational efficiencies, while medium-term assessments capture market positioning advantages and ecosystem development. Long-term ROI considerations must include strategic national interests such as supply chain resilience and technological sovereignty.
Quantitative metrics form the foundation of the framework, including Net Present Value (NPV), Internal Rate of Return (IRR), and payback period calculations specifically calibrated for MAP infrastructure investments. These should be supplemented with sensitivity analyses that account for varying production volumes, technology maturation rates, and market adoption scenarios. The framework must also incorporate risk-adjusted return calculations that reflect the pioneering nature of national-scale MAP implementations.
Beyond financial indicators, the ROI framework should integrate qualitative value assessments that capture benefits not easily monetized. These include enhanced manufacturing flexibility, reduced time-to-market for critical products, and improved national security through domestic production capabilities. Environmental sustainability benefits, including reduced carbon footprint through localized production and more efficient resource utilization, represent another crucial dimension of the ROI calculation.
The framework must also establish clear benchmarking methodologies against traditional manufacturing approaches, enabling decision-makers to compare MAP investments with conventional alternatives. This comparison should highlight MAP's unique advantages in scalability, adaptability to market changes, and resilience against supply chain disruptions.
Implementation of the ROI framework requires defining appropriate data collection protocols to track both CAPEX and OPEX metrics throughout the facility lifecycle. This includes establishing key performance indicators (KPIs) that align with strategic objectives and creating dashboards that provide real-time visibility into performance against ROI targets.
Finally, the framework should incorporate feedback mechanisms that allow for continuous refinement based on operational experience. As early MAP facilities generate performance data, these insights should be used to calibrate ROI projections for subsequent investments, creating a virtuous cycle of increasingly accurate economic modeling for national-scale MAP infrastructure.
Sustainability and Environmental Impact Considerations
The implementation of national-scale MAP (Microalgae-based Advanced Production) facilities necessitates comprehensive sustainability and environmental impact assessments to ensure long-term viability and regulatory compliance. These facilities, while offering promising solutions for biofuel production and carbon sequestration, present significant environmental considerations that must be factored into cost modeling frameworks.
Energy consumption represents a primary environmental concern for MAP operations. Large-scale cultivation and processing systems require substantial power inputs, potentially offsetting carbon benefits if sourced from fossil fuels. Cost models must incorporate renewable energy integration strategies, including solar, wind, or biogas recovery systems, which may increase initial CAPEX but significantly reduce long-term environmental footprints and operational costs.
Water management presents another critical sustainability dimension. MAP facilities typically require substantial water resources, raising concerns about local hydrological impacts. Advanced cost modeling should account for water recycling systems, rainfall capture infrastructure, and wastewater treatment technologies. These elements may represent 15-20% of initial capital expenditure but can reduce operational water costs by up to 70% while mitigating environmental pressures.
Land use considerations significantly impact both environmental sustainability and economic viability. While microalgae cultivation requires less arable land than traditional biofuel crops, the footprint remains substantial for national-scale implementation. Cost models should evaluate land conversion impacts, biodiversity effects, and potential ecosystem services disruption. Strategic facility siting near CO2 sources or wastewater treatment plants can optimize environmental performance while reducing transportation costs.
Carbon accounting frameworks must be integrated into comprehensive cost models to accurately reflect environmental value creation. MAP facilities can potentially sequester significant atmospheric carbon, creating monetizable environmental benefits through carbon credit markets. However, full lifecycle assessments must account for embedded carbon in facility construction, operational emissions, and end-product utilization pathways.
Waste management strategies represent both environmental challenges and economic opportunities. Residual biomass and processing byproducts can create disposal issues if not properly managed. Advanced cost models should incorporate biorefinery approaches that transform waste streams into valuable co-products, potentially generating additional revenue streams while minimizing environmental impacts. These circular economy principles can improve overall project economics while enhancing sustainability metrics.
Regulatory compliance costs related to environmental protection must be factored into comprehensive financial models. These include environmental impact assessments, monitoring systems, reporting requirements, and potential remediation obligations. While representing additional expenses, proactive environmental management reduces regulatory risks and potential future liabilities that could otherwise threaten operational continuity.
Unlock deeper insights with Patsnap Eureka Quick Research — get a full tech report to explore trends and direct your research. Try now!
Generate Your Research Report Instantly with AI Agent
Supercharge your innovation with Patsnap Eureka AI Agent Platform!