
Data display method and system based on sap platform
A data display and platform technology, applied in the field of data display methods and systems based on the SAP platform, can solve the problems of single report and chart styles, poor real-time data, and insufficient aesthetics, etc., to achieve effective data analysis and synchronization Update and interact with real-time effects
Patent Information
- Authority / Receiving Office
- CN · China
- Patent Type
- Patents(China)
- Current Assignee / Owner
- Publication Date
- 2019-02-01
Smart Images
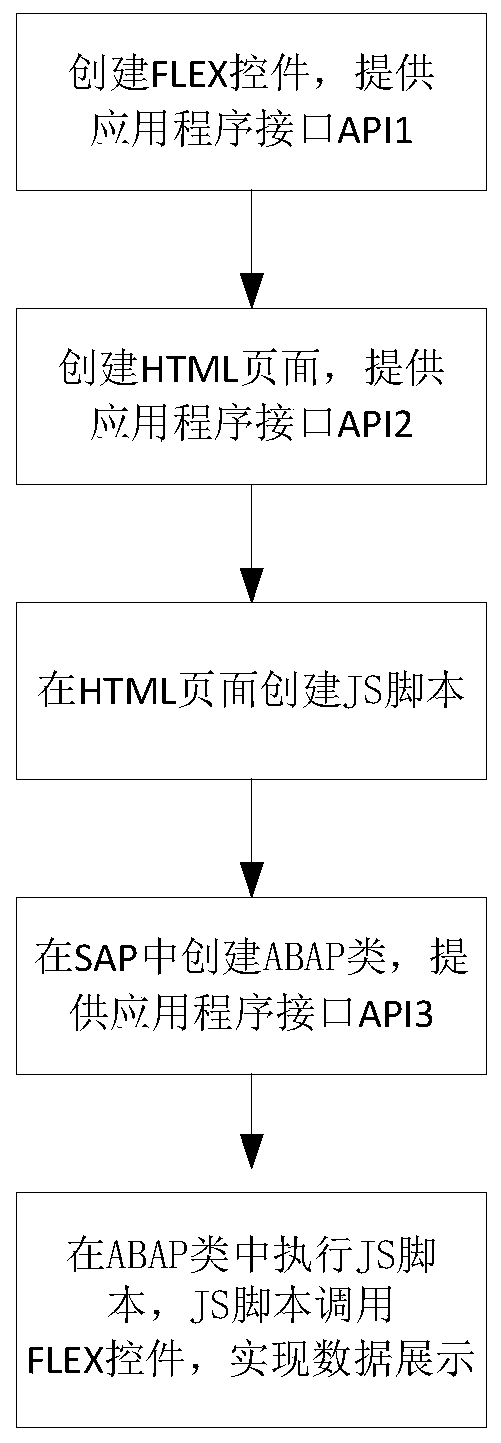
Figure 1 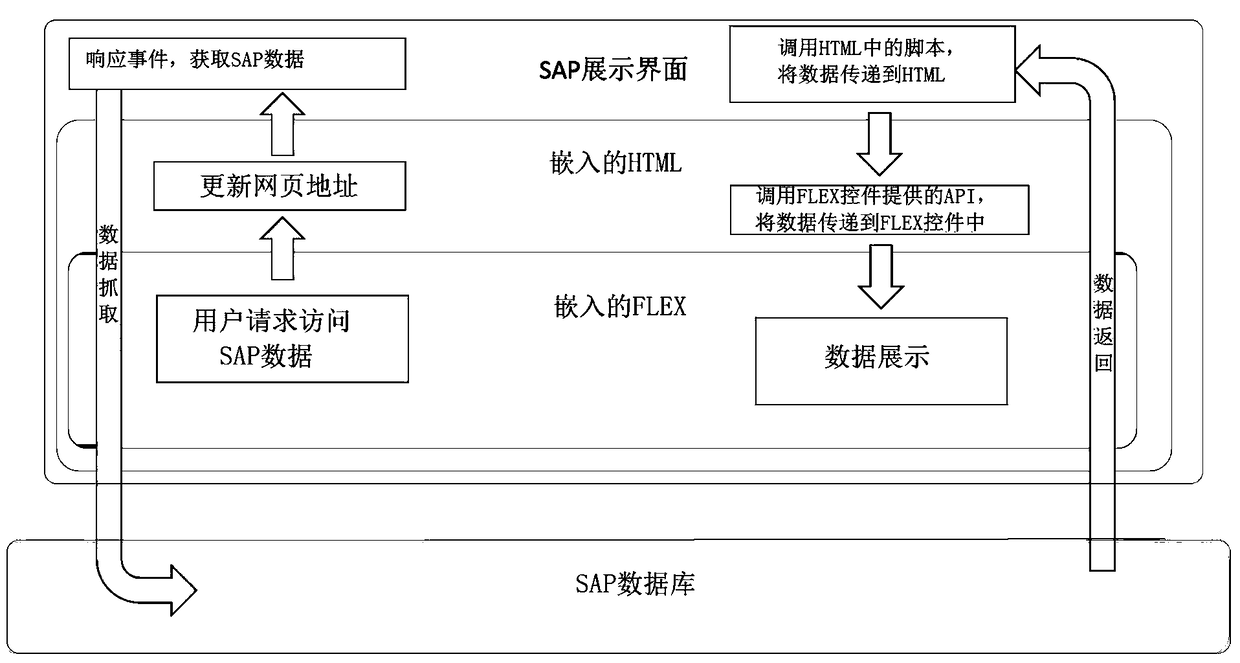
Figure 2
Abstract
Description
technical field
[0001] The invention relates to the display field of reports or graphs, in particular to a data display method and system based on an SAP platform. Background technique
[0002] SAP (systems applications and products in data processing) is a software for enterprise resource planning (ERP) (enterprise resource planning) management.
[0003] SAP provides the secondary development language ABAP / 4 (advanced business application programming), and users can use ABAP language for system development through SAP's internal development platform. These include the data transfer between the SAP system and external systems, the production of reports, and the import and export of data, etc.
[0004] When presenting reports or charts in the existing SAP system, the reports and charts supported are single in style, and the aesthetics are not good enough; although the reports and charts provided are displayed on the EP (enterprise portal) side through BI (business intelligen...
Examples
Embodiment Construction
[0034] Below in conjunction with accompanying drawing and embodiment the present invention will be further described:
[0035] API: Application Program Interface (API: Application Program Interface);
[0036] ABAP: Advanced Business Application Programming (Advanced Business Application Programming);
[0037] HTML: Hypertext Markup Language (Hypertext Markup Language);
[0038] FLEX controls are the basic elements of the user interface. Using these controls, users can easily realize the visual display of data reports or charts.
[0039] The data display method based on the SAP platform is as follows: figure 1 shown, including the following steps:
[0040] Step 1. Create various types of FLEX controls through FlashBuilder or other editors, such as pie charts, line charts, histograms, scatter plots, grid charts, etc., and provide APIs for data binding and interface control.
[0041] Step 2. According to the specific report or chart business requirements, create an HTML page,...