
Chemotherapy regimen selection
a chemotherapy regimen and chemotherapy technology, applied in the field of cancer therapy, can solve the problems of high probability of pcr, low pcr, and inability to detect pcr, and achieve the effects of improving the current rate of pcr, reducing the probability of pcr, and improving the rate of pcr
Patent Information
- Authority / Receiving Office
- US · United States
- Patent Type
- Applications(United States)
- Current Assignee / Owner
- Publication Date
- 2017-03-16
Smart Images
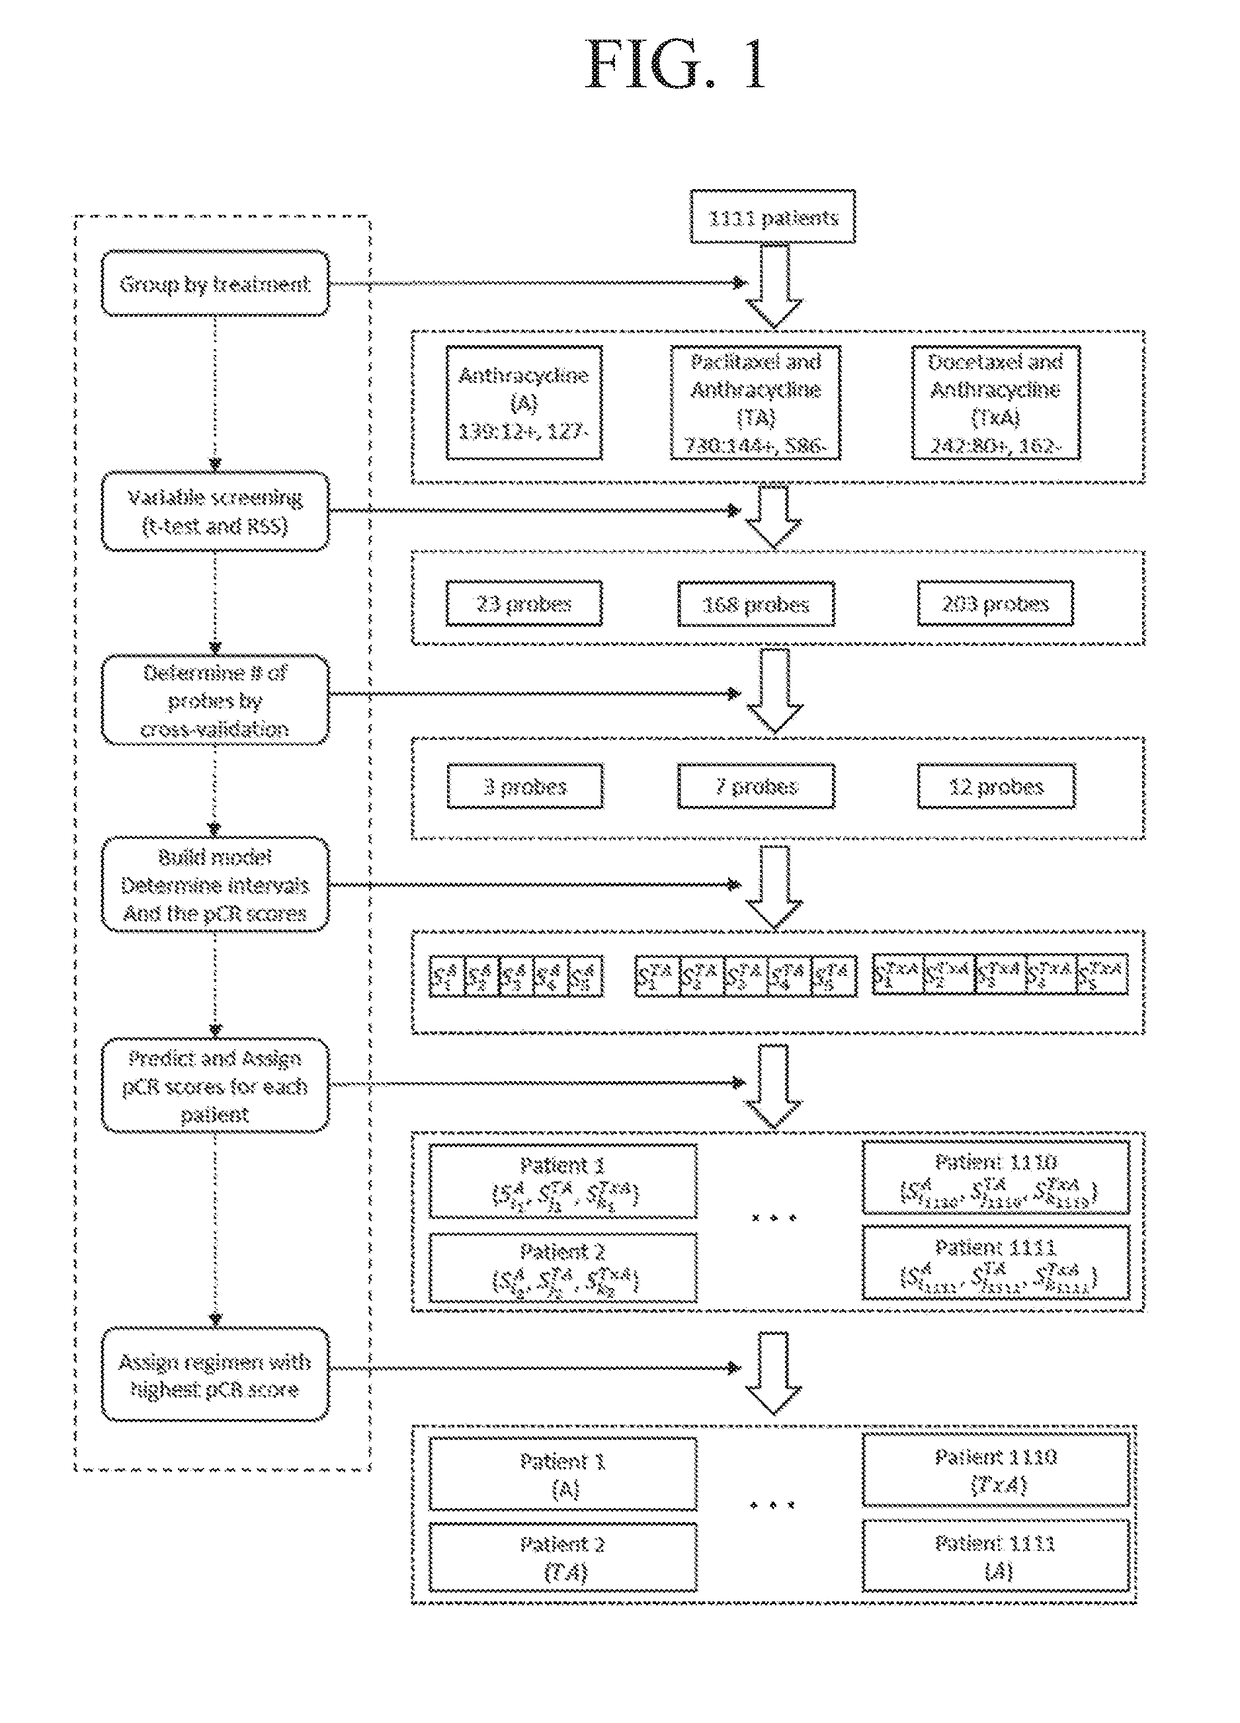
Figure 1 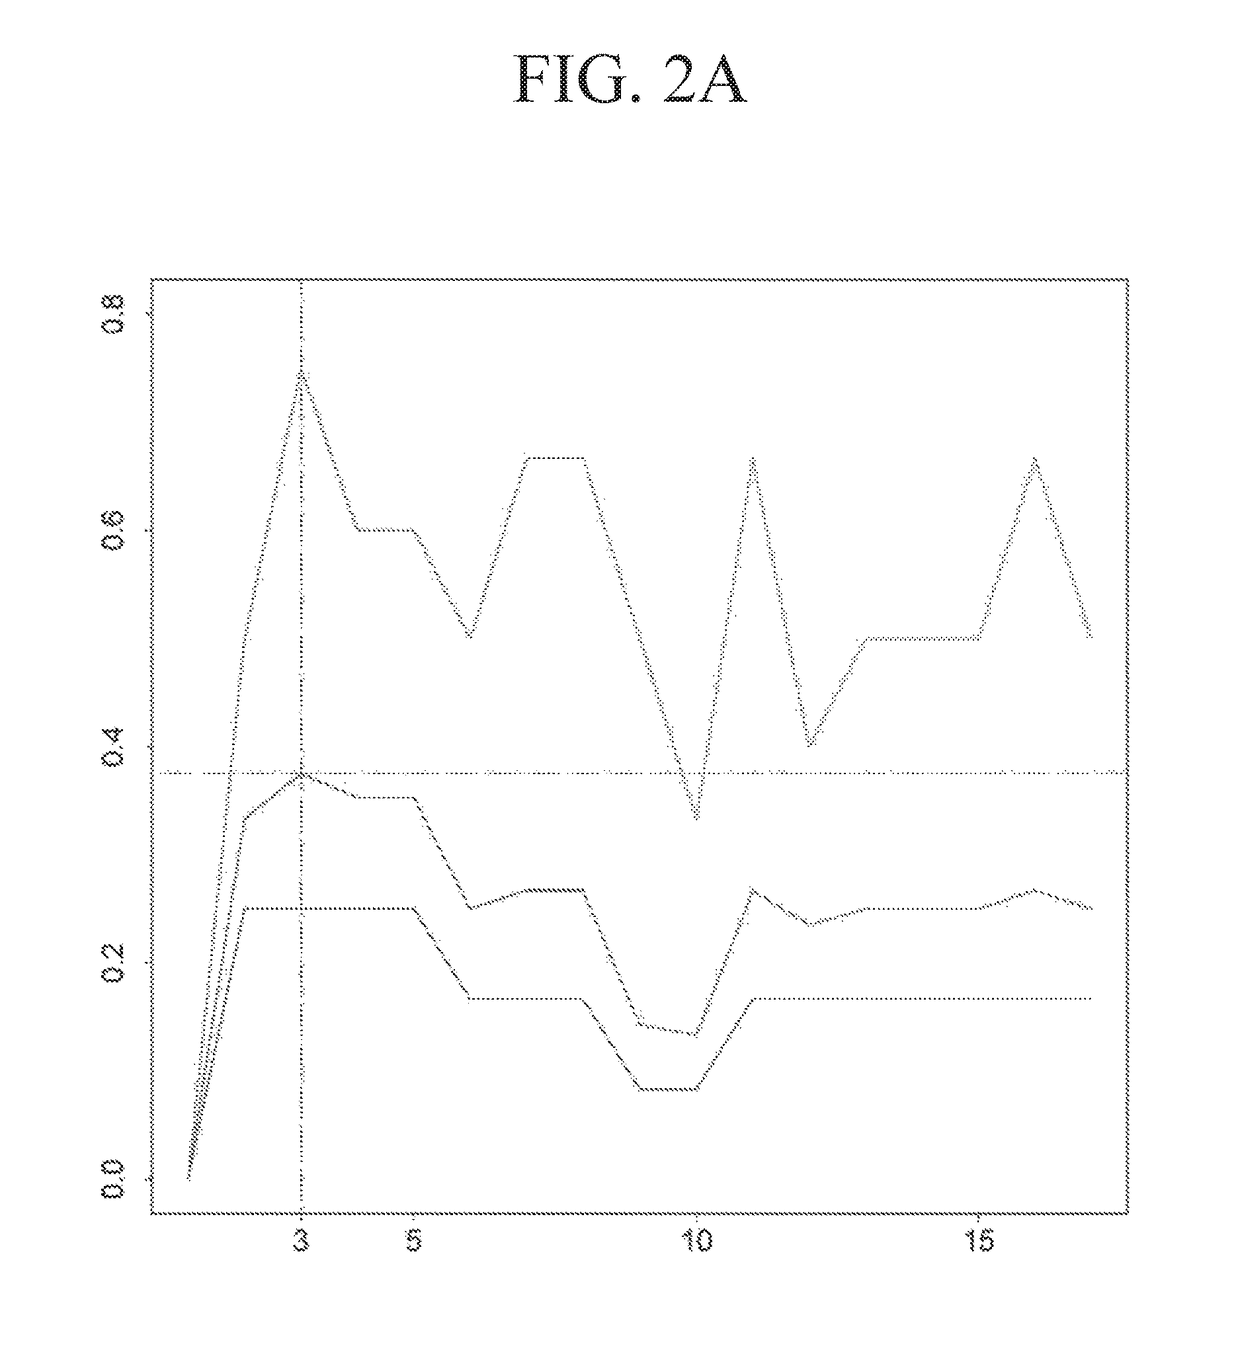
Figure 2 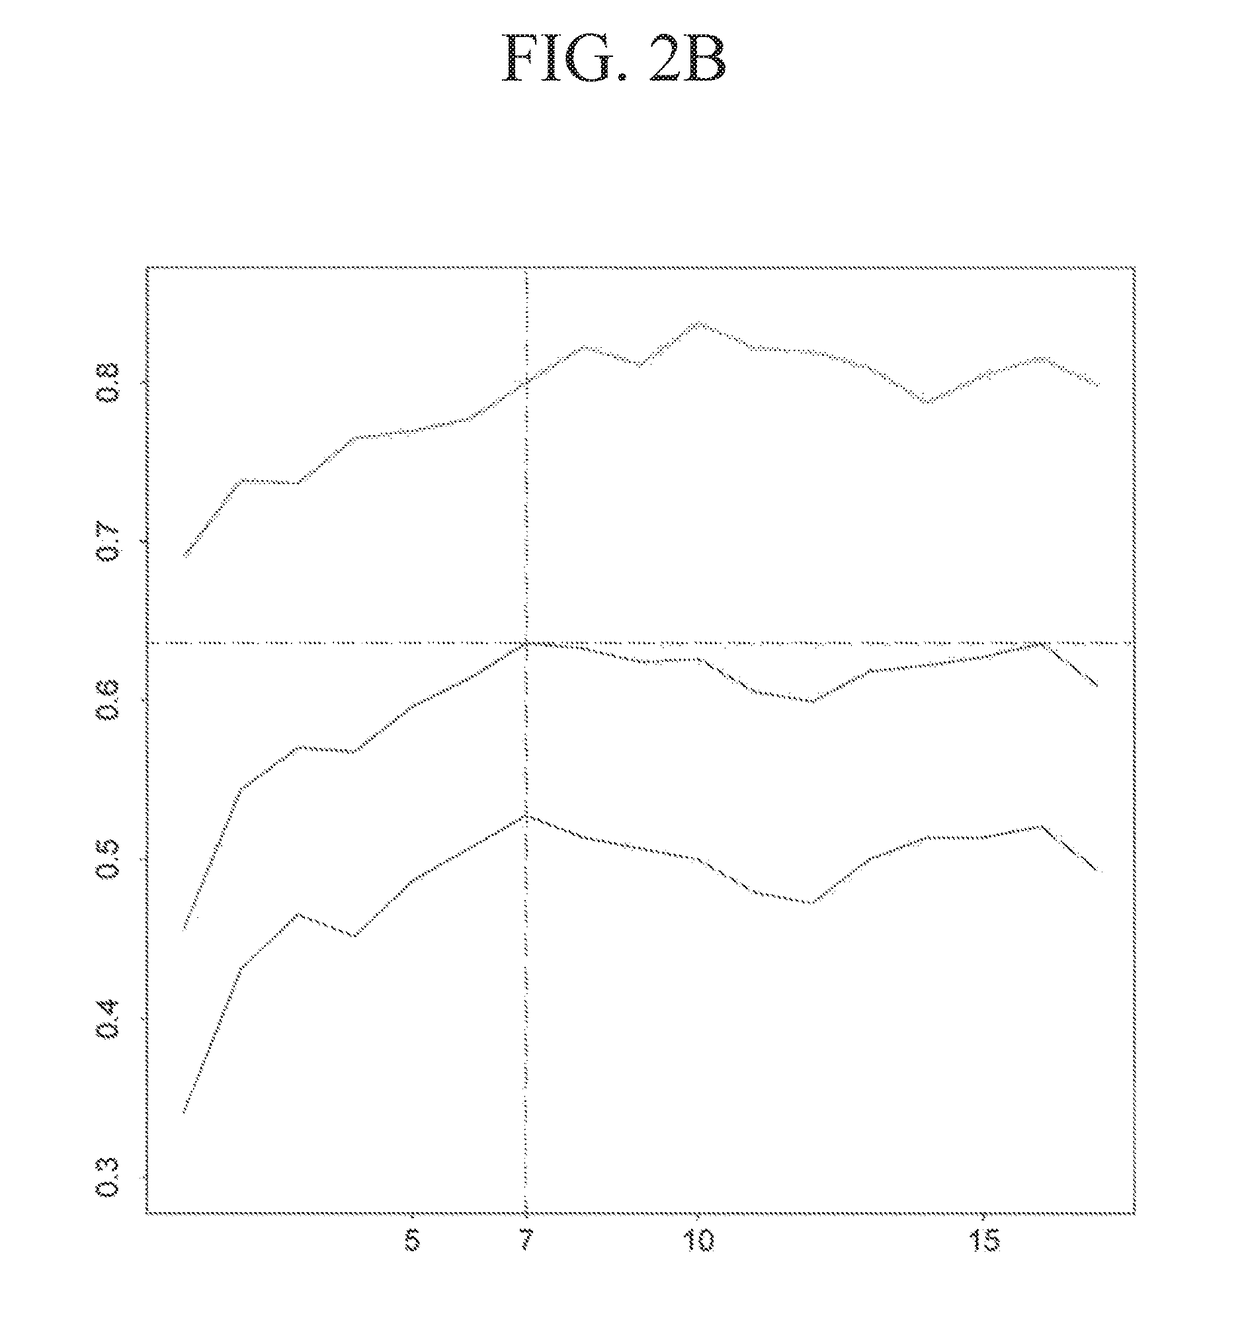
Figure 3
Abstract
Description
FIELD OF INVENTION
[0001] The present invention relates generally to cancer therapy. In one embodiment, there are provided methods and systems for selecting a chemotherapy regimen for a subject, as well as methods and systems for predicting the efficacy of a chemotherapy regimen for a subject. Kits for selecting a chemotherapy regimen for a subject are also provided.BACKGROUND OF THE INVENTION
[0002] Breast cancer is a very heterogeneous disease (The Cancer Genome Atlas Network, et al., 2012). In the past, validated clinicopathologic prognostic factors, such as tumor size, lymph node involvement, histologic grade, and age have been widely used by clinicians to guide treatment decisions. This approach resulted in significant numbers of over-treated and undertreated patients. It is well known that patients with similar pathological characteristics can have very different responses toward certain therapies, although the mechanisms of such responses have been poorly understood. More recentl...
Examples
example 1
Materials and Methods
[0293]1111 breast cancer tumor samples were collected from 7 data series in GEO database (Gene Expression Omnibus (Takada, et al., 2012, Albain, et al., 2010)) (Table 2). Samples were grouped into 3 treatment groups: A group (anthracycline only), TA group (paclitaxel and anthracycline), and TxA group (docetaxel and anthracycline). R (Liu, et al., 2012) package Affyio (Edgar, et al., 2002) was used to read and normalize the Affymetrix® data. The responses for all samples were coded as pathological complete response (pCR) or Residual Disease (RD).
TABLE 2GEO Data Sets Used and Number of Patients in Each Data Set *TreatmentGEOPaclitaxel andDocetaxel andAccessionAnthracyclineAnthracyclineNumber acycline (A)(TA)(TxA)TotalGSE201944 (0) 257 (20.6%) 8 (12.5%)269 (20.1%) opovici, et al.,2010)GSE20271 85 (8.2%) 91 (20.9%)—176 (14.8%) Tabchy, et al.,2010)GSE22093 50 (10%)——50 (10%) wamoto, et al.,2011)GSE23988——61 (32.8%) 61 (32.8%) wamoto, et al.,2011)GSE25055—290 (18.3%...
example 2
Results for the Entire Population
Model Performance and Gene Signatures
[0309]The performance of the three types of models for the three types of regimens is shown in Table 3. Models with both clinical and genetic variables (clinical-gene models) generally perform better than models with only clinical variables (clinical models) and models with only genetic variables (gene models). Addition of genetic variables improved the performance for TA and TxA groups dramatically, while the three models did not show significant differences for A group. For TA and TxA groups, both gene models and clinical-gene models performed much better than clinical models, indicating genetic variables can be powerful predictors of chemotherapy responses. Based on this comparison, clinical-gene models were used in the rest of this study. The gene signatures that were responsible for the treatment responses of each regimen are shown in Table 4. The gene signatures consist of 3, 5, and 11 genes for A, TA, and T...
example 3
Results for the HER2-Negative Subpopulation
[0322]The performance of the three types of models for the three types of regimens is shown in Table 9. The predicted probabilities of each model were first sorted and then divided into 5 equally numerous intervals (Table 10). A manual approach to make the probabilities covered by each interval less skewed while at the same time keeping enough patients in each interval to make the estimated pCR scores reliable was used to investigate how division of intervals affects the expected pCR. The intervals are shown in Table 11. The patients were assigned based on these intervals and the results are shown in Table 12. The expected number of pCR was only slightly higher than that achieved using intervals based on quintiles.
TABLE 9Model Performance for the HER2-negative SubpopulationClinical variables s and clinical variablesGenes roup (# off1-f1-f1-probes)scorePrecisionrecallscorePrecisionrecallscorePrecisionrecall acycline (6)0.5560.8330.4170.510.3...