
Method for generating and displaying process variable graphical trend symbols and process variable panes
A process variable and display process technology, applied in the direction of electrical program control, instruments, test/monitoring control systems, etc., can solve problems such as incomplete and slow decision-making
Patent Information
- Authority / Receiving Office
- CN · China
- Patent Type
- Patents(China)
- Current Assignee / Owner
- Publication Date
- 2022-01-14
Smart Images
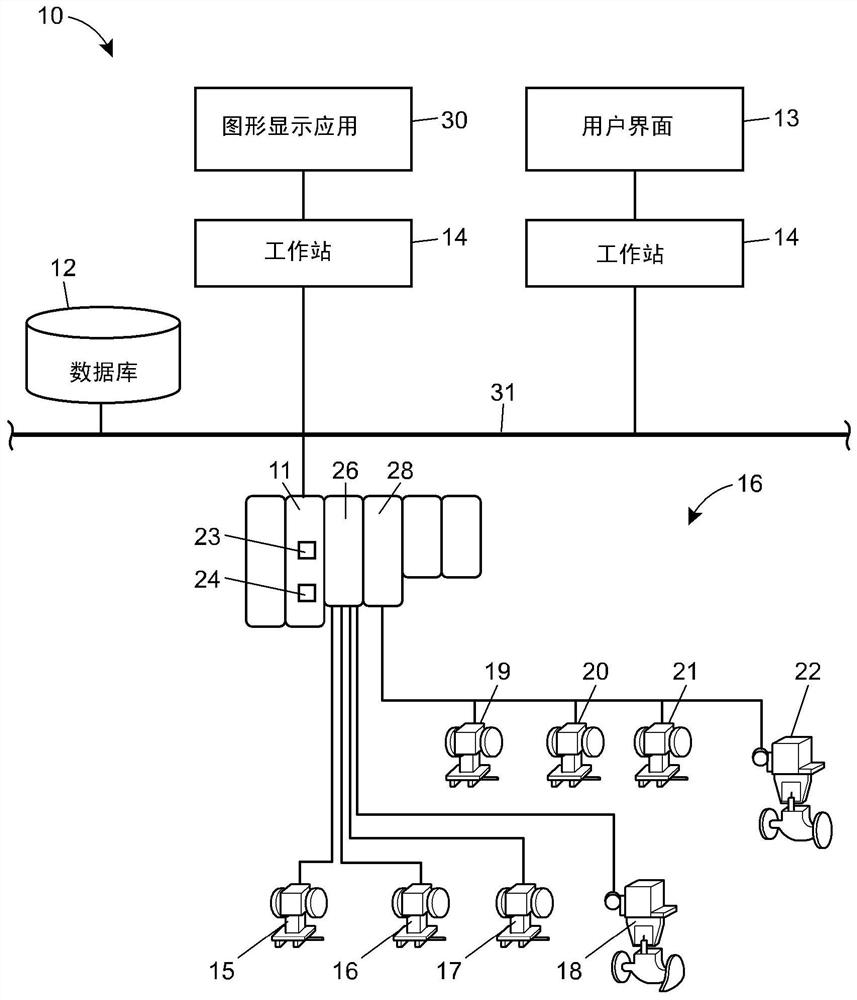
Figure 1 
Figure 2 
Figure 3
Abstract
Description
technical field
[0001] In general terms, the present disclosure relates generally to process control systems and, more particularly, to monitoring trends of process variables and hierarchical, graphical navigation of process control plants. Background technique
[0002] Process plants, such as those employed in the chemical, petroleum, or other industries, typically include one or more centralized or decentralized process controllers that are communicatively coupled via analog, digital, or combined analog / digital busses to at least A host or operator workstation and one or more process control and instrumentation devices (such as field devices). Field devices can be, for example, valves, valve positioners, switches, transmitters, and sensors (eg, temperature, pressure, and flow rate sensors) that perform functions in a process (such as increasing or decreasing flow and measuring process parameters). The process controller receives process measurements or process variables o...
Examples
Embodiment Construction
[0040] figure 1 A process control monitoring system 10 shown in that can be used to implement and display the graphical trend symbols described herein includes a controller 11 connected to a database 12 via a network bus 31 such as an Ethernet communication network and a or a plurality of host workstations or computers 14 (computers 14 may be any type of personal computer, workstation, etc.). Each workstation 14 may include memory for storing a plurality of applications including, for example, graphics display application 30 , and may be communicatively coupled to user interface 13 . Controller 11 may also be connected to field devices 15 - 22 via input / output (I / O) cards 26 and 28 . The database 12 may be any desired type of data collection unit for storing data, having any desired type of memory and any desired or known software, hardware or firmware. System 10 may also store process variable values or process variable data within database 12 for use in generating and su...