Map data display method and apparatus

A map data and map technology, applied in the field of data processing, can solve problems such as poor results and overlapping data display areas, and achieve the effect of reducing the data display area and solving the overlap of data display areas

Active Publication Date: 2017-06-27
BEIJING GRIDSUM TECH CO LTD
View PDF6 Cites 9 Cited by
  • Summary
  • Abstract
  • Description
  • Claims
  • Application Information

AI Technical Summary

Problems solved by technology

However, this display mode also has certain defects while bringing convenience to users: when there are many geographical graphics in a small range, multiple data display areas of different sizes will be concentrated in this small range Inner display, so that each data display area overlaps with each other
It can be seen from the above that the existing methods of narrowing the data display area are not effective in improving the area overlap

Method used


Image

  • Map data display method and apparatus
  • Map data display method and apparatus
  • Map data display method and apparatus

Examples


Embodiment Construction

[0026] Exemplary embodiments of the present disclosure will be described in more detail below with reference to the accompanying drawings. Although exemplary embodiments of the present disclosure are shown in the drawings, it should be understood that the present disclosure may be embodied in various forms and should not be limited by the embodiments set forth herein. Rather, these embodiments are provided for more thorough understanding of the present disclosure and to fully convey the scope of the present disclosure to those skilled in the art.

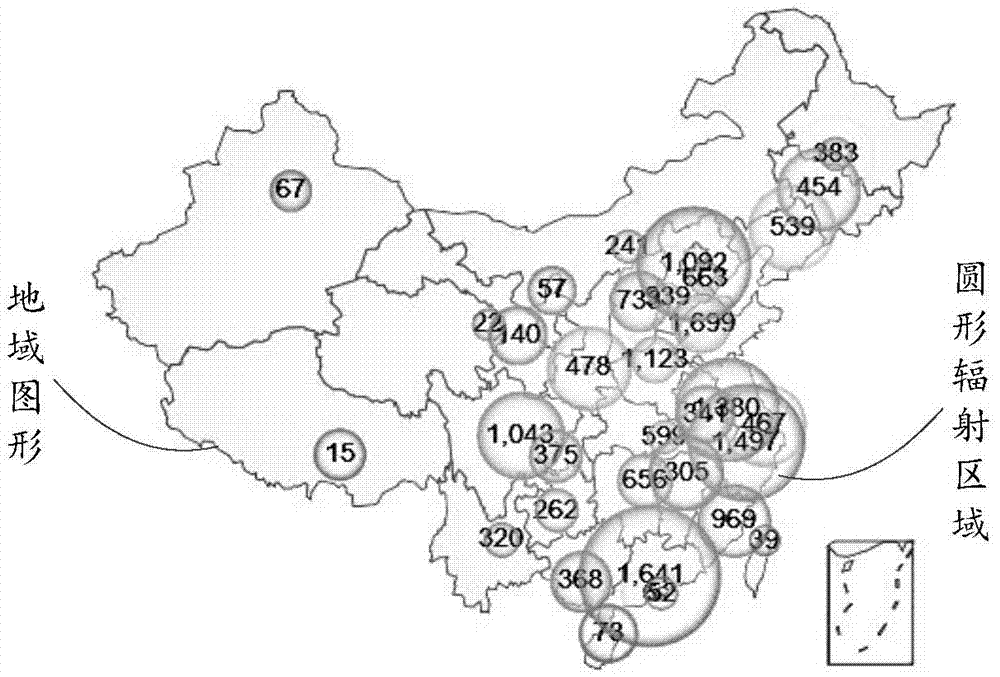
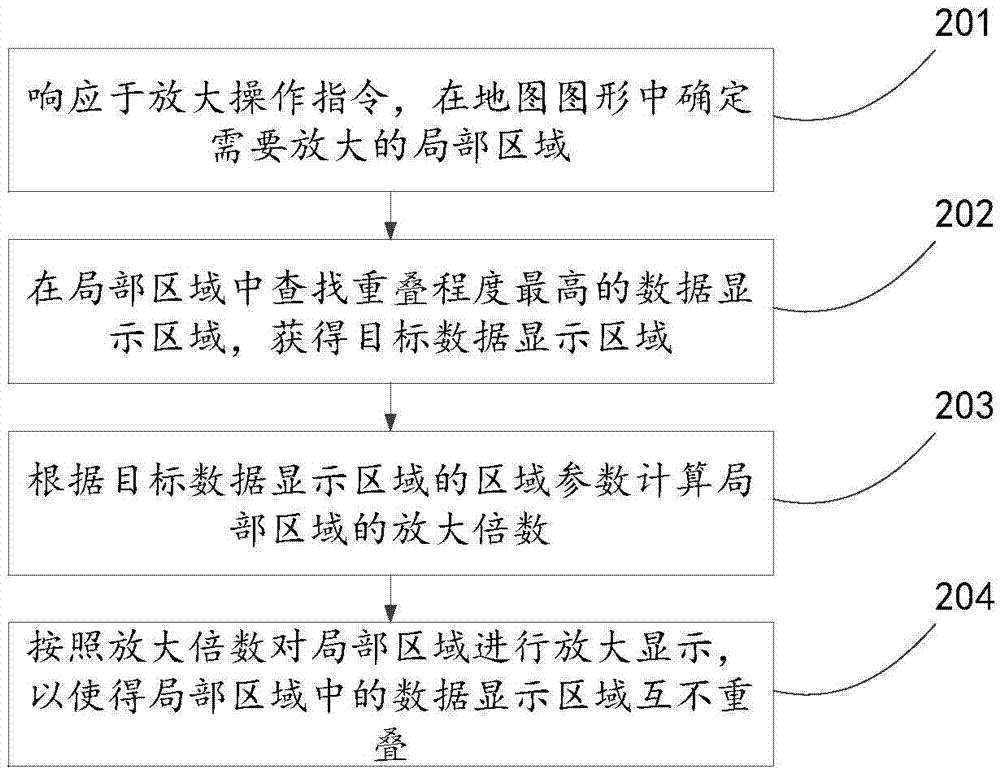
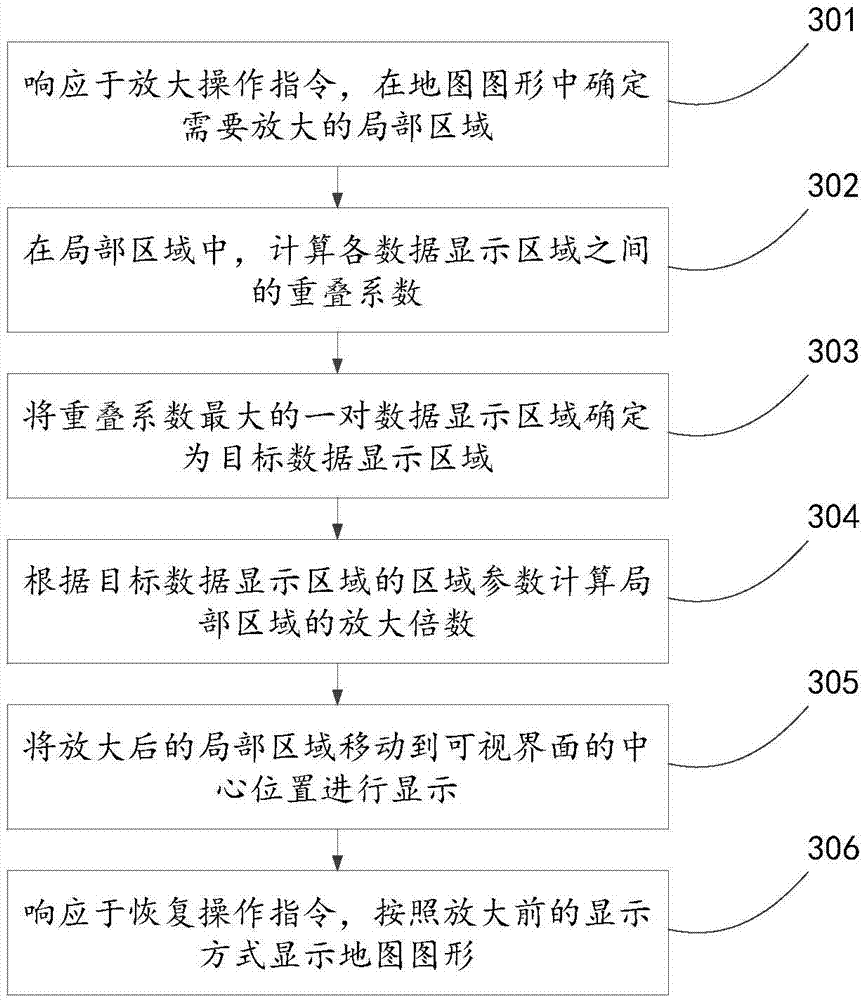
[0027] An embodiment of the present invention provides a method for displaying map data, such as figure 2 As shown, the method includes:

[0028] 201. In response to a zoom-in operation instruction, determine a local area that needs to be zoomed-in in a map graphic.

[0029] This embodiment is mainly applied to the client side, and the client may be, but not limited to, installed on a mobile phone, a personal computer (Personal C...


PUM


Abstract

The invention discloses a map data display method and apparatus, which relates to the field of data processing and is invented for radically solving the problem of overlapping of data display regions. The method comprises the steps of determining a local region needed to be amplified in a map graph in response to an amplification operation instruction, wherein the map graph consists of a plurality of terrain graphs, a data display region is correspondingly displayed on each terrain graph, and the local region at least covers the data display regions of the two terrain graphs; searching for the data display region with the highest overlapping degree in the local region to obtain the target data display region; calculating an amplification multiple of the local region according to region parameters of the target data display region; and performing amplification display on the local region according to the amplification multiple, thereby enabling the data display regions in the local region not to be overlapped mutually. The method and the apparatus are mainly applied to a client side.

Description

technical field [0001] The invention relates to the field of data processing, in particular to a method and device for displaying map data. Background technique [0002] When displaying regional data, in order to facilitate users to visually view the correlation between data and regions, the prior art provides a data display method based on map graphics. exist figure 1 In , the map of China is composed of different regions such as provinces, municipalities, and autonomous regions, and the data about the region is displayed on each region graph. Compared with the data display method in the form of a list, the data display method based on map graphics is easier to be accepted by users because of its intuitive and vivid features. [0003] In order to enable users to obtain more useful information from map graphics, the prior art displays data in different shapes of data display areas such as circles or water droplets in the map graphics. exist figure 1 In , each geographica...

Claims


Application Information

Patent Timeline
Patent Type & Authority Applications(China)
IPC IPC(8): G06F17/30
CPCG06F16/29
Inventor 高全胜
Owner BEIJING GRIDSUM TECH CO LTD
Why Eureka
Try Eureka