
Visualization method of component analysis result
A component analysis and technology to be analyzed, applied in the field of smelting, can solve the problems of obscure data, high operation and maintenance costs of testing instruments, and restrictions on the popularization and application of instruments
Patent Information
- Authority / Receiving Office
- CN · China
- Patent Type
- Applications(China)
- Current Assignee / Owner
- Publication Date
- 2020-07-24
Smart Images
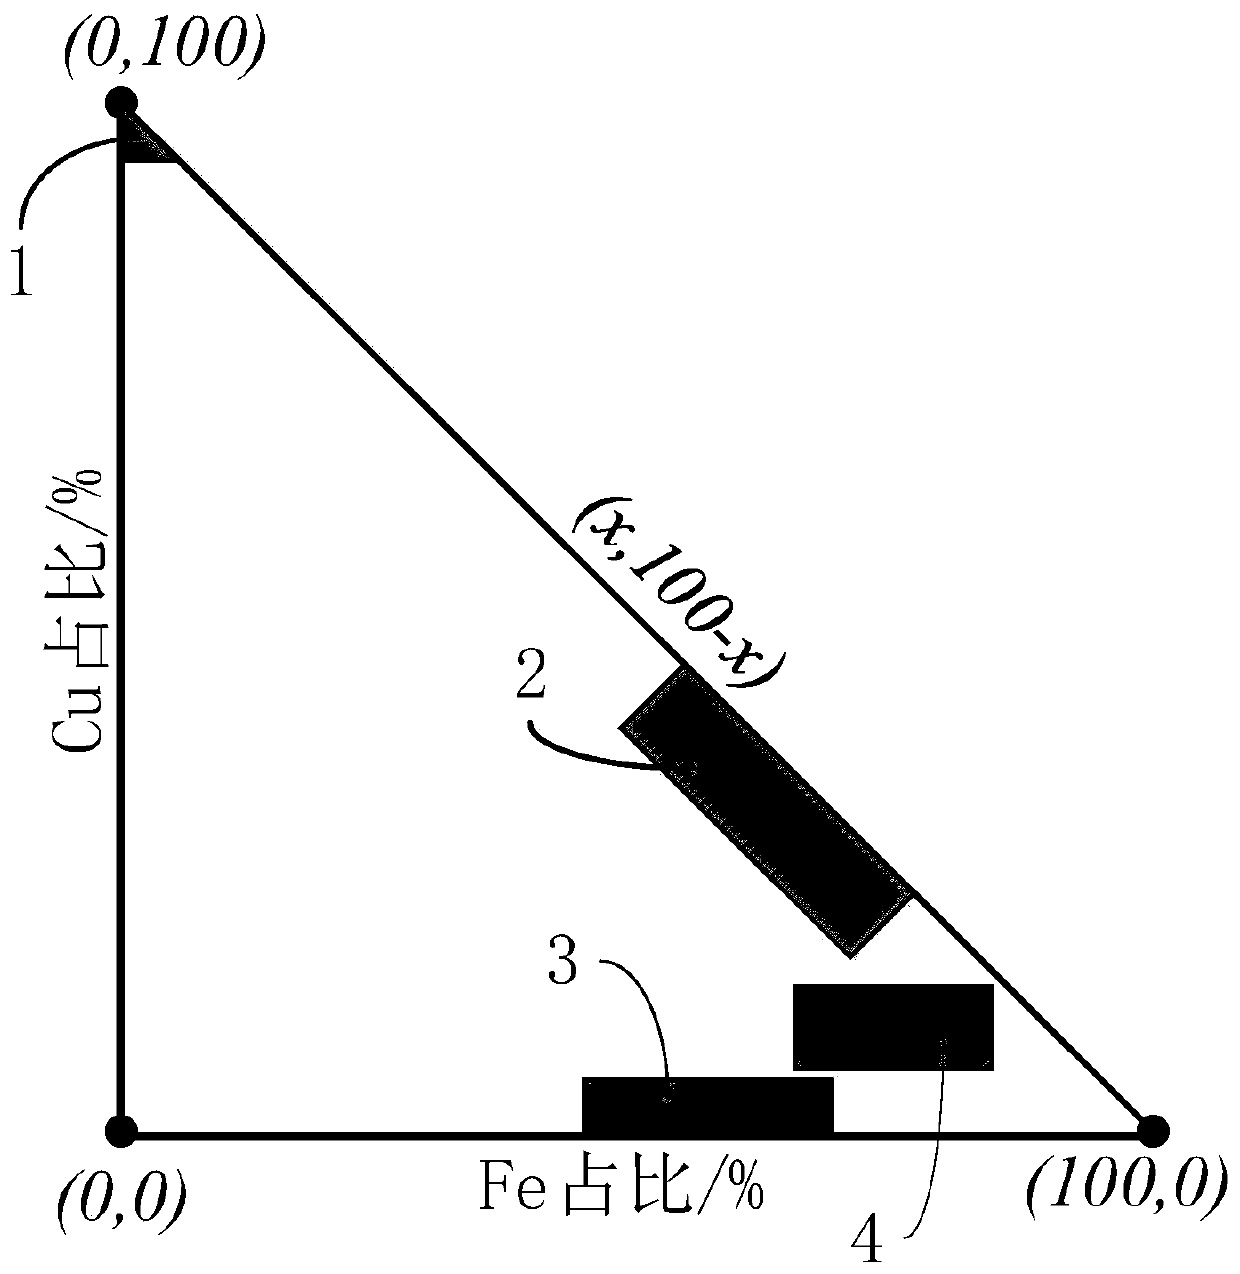
Figure 1 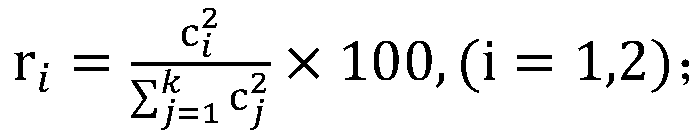
Figure 2 
Figure 3
Abstract
Description
technical field
[0001] The invention belongs to the technical field of smelting, in particular to a visualization method for component analysis results. Background technique
[0002] The metal smelting process usually involves raw ore materials, finished products and various process products. At present, when the laser-induced breakdown spectroscopy (LIBS) technology is used for qualitative analysis of various materials in the metal smelting process, due to the obscure and incomprehensible data of the analysis results, professional training is required for the application personnel, which makes the operation and maintenance cost of the detection instrument High, limiting the popularization and application of the instrument. Contents of the invention
[0003] The purpose of the present invention is to provide a visualization method for component analysis results.
[0004] For realizing above object, the technical scheme that the present invention adopts is:
[0005] Step...
Examples
Embodiment Construction
[0012] Below in conjunction with accompanying drawing, through the description of embodiment, the specific implementation mode of the present invention is described in further detail.
[0013] A visualization method for component analysis results, including the following steps:
[0014] Step A: The materials to be analyzed include raw mineral materials, process products and finished products in the metal smelting process. Target elements and impurity elements are selected according to the materials to be analyzed. Each material to be analyzed contains at least one of the target elements and impurity elements ;
[0015] Step B: The proportion of the selected element in the material to be analyzed or the variable positively related to the proportion is the representative value r of the element content.
[0016] In this embodiment, the content representative value r is selected as the spectral energy ratio of the element,
[0017]
[0018] Among them, c i is the content wei...