
Method and apparatus for identifying and classifying query intent
Patent Information
- Authority / Receiving Office
- US · United States
- Current Assignee / Owner
- Publication Date
- 2009-03-19
Smart Images
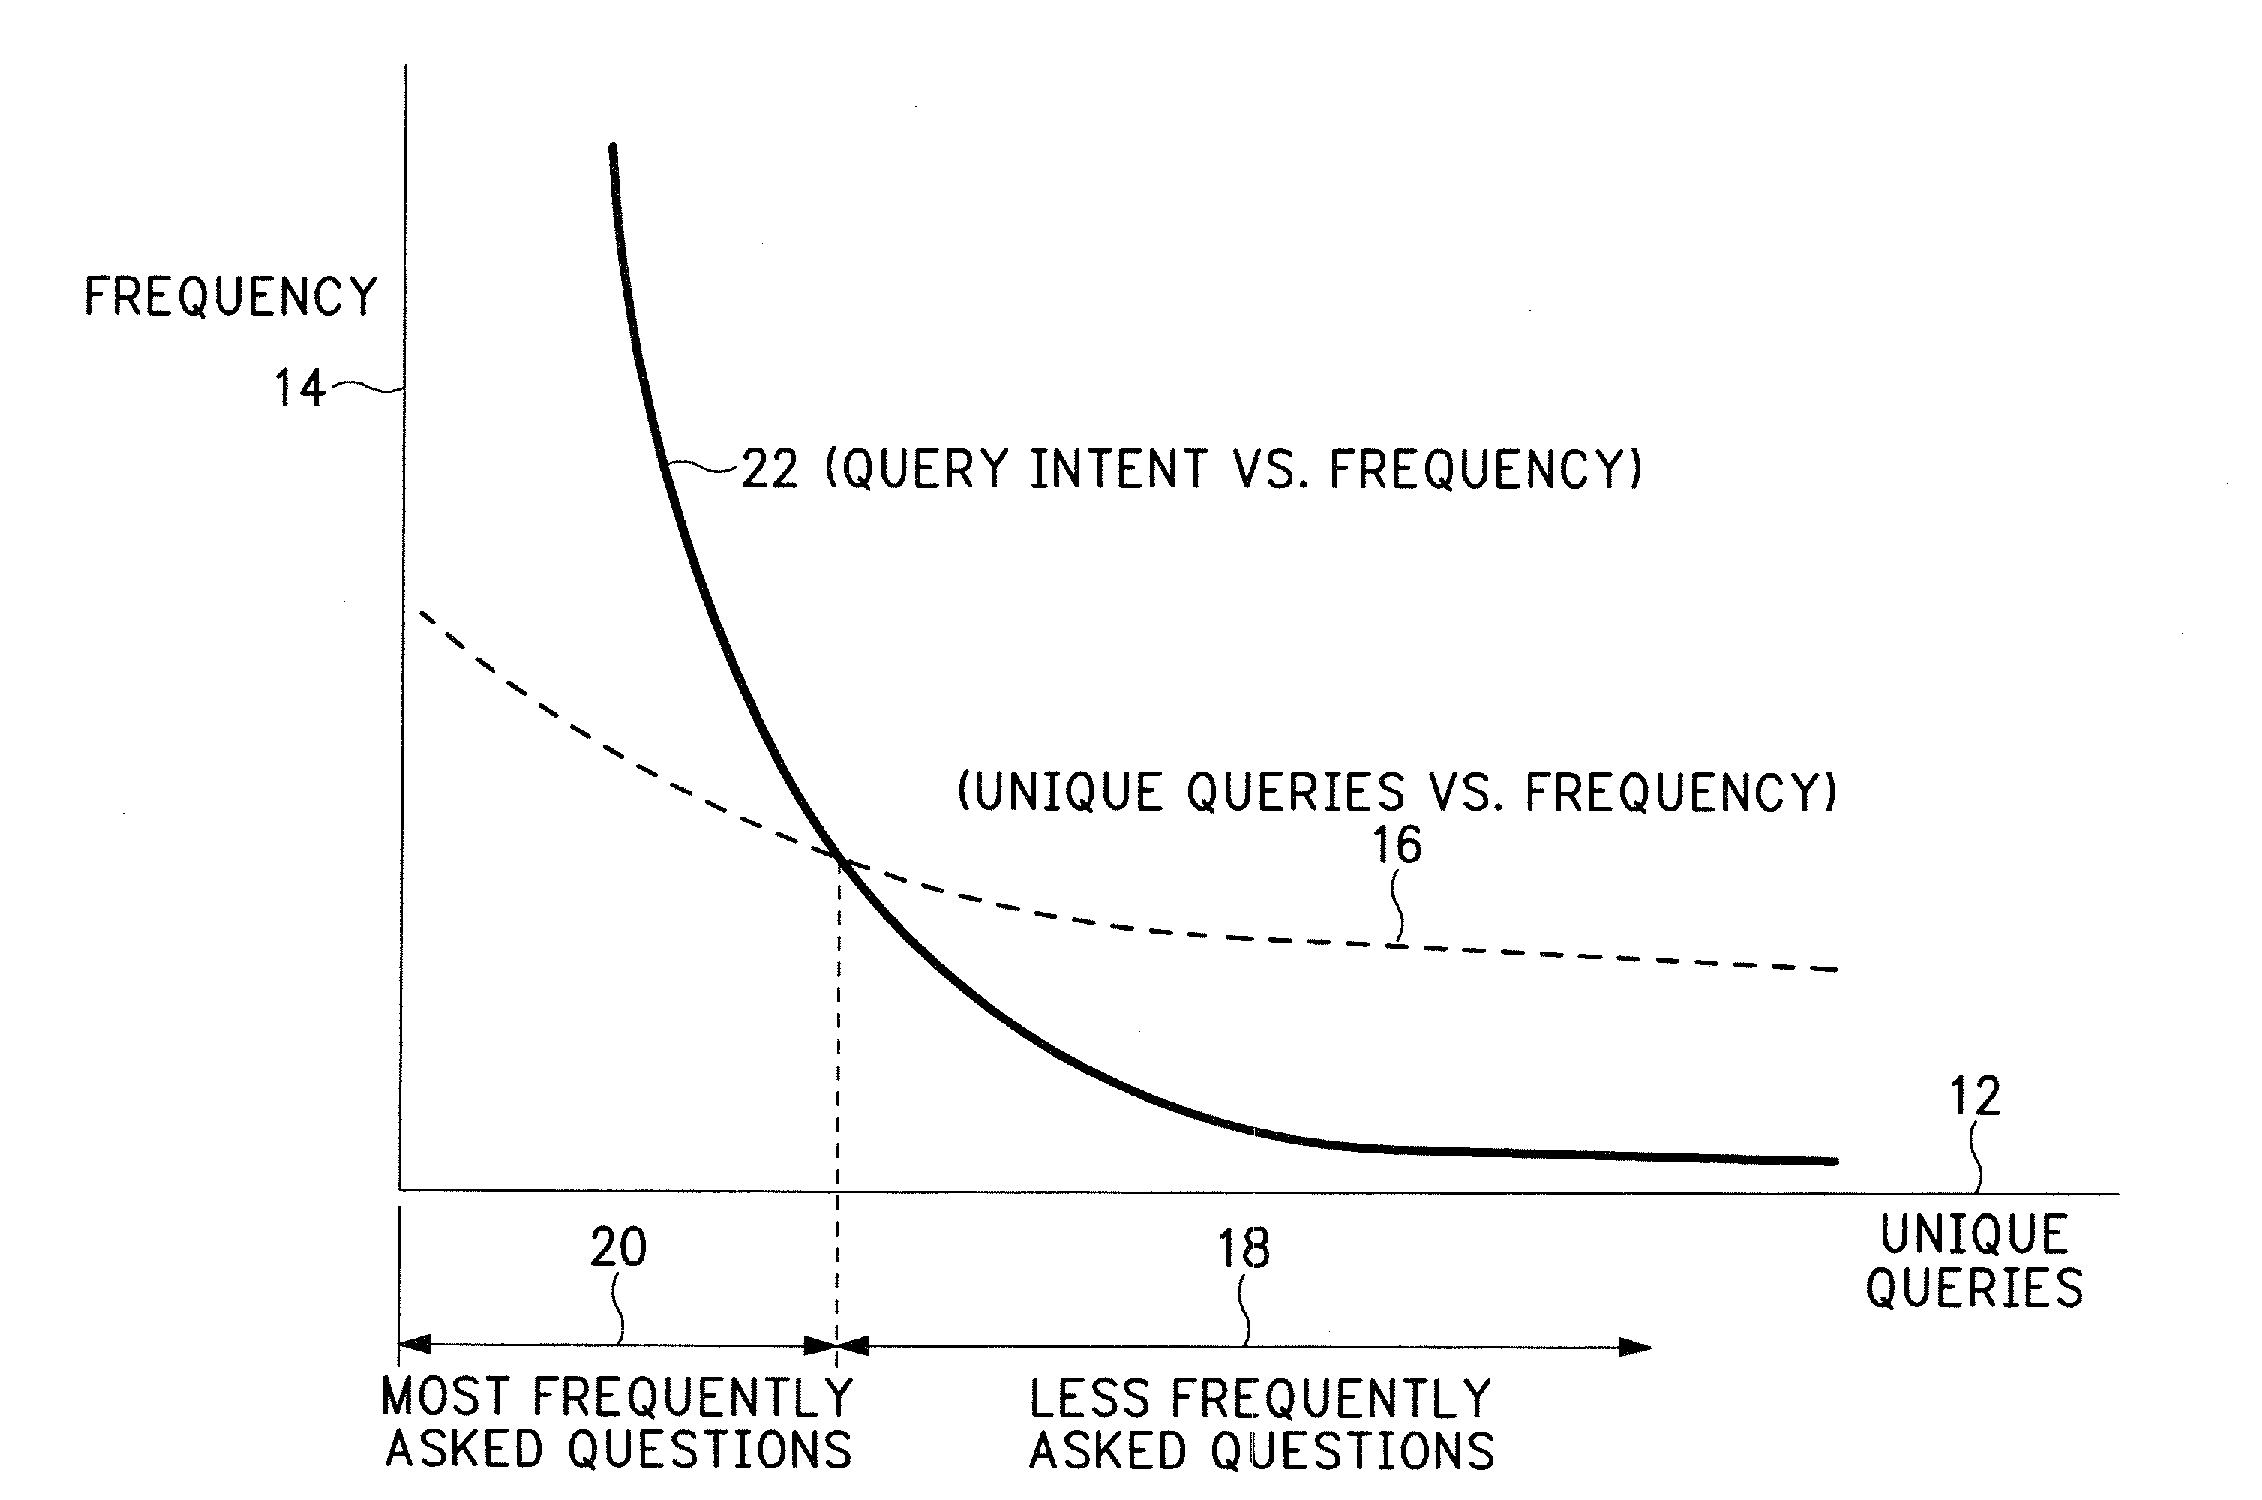
Figure 1 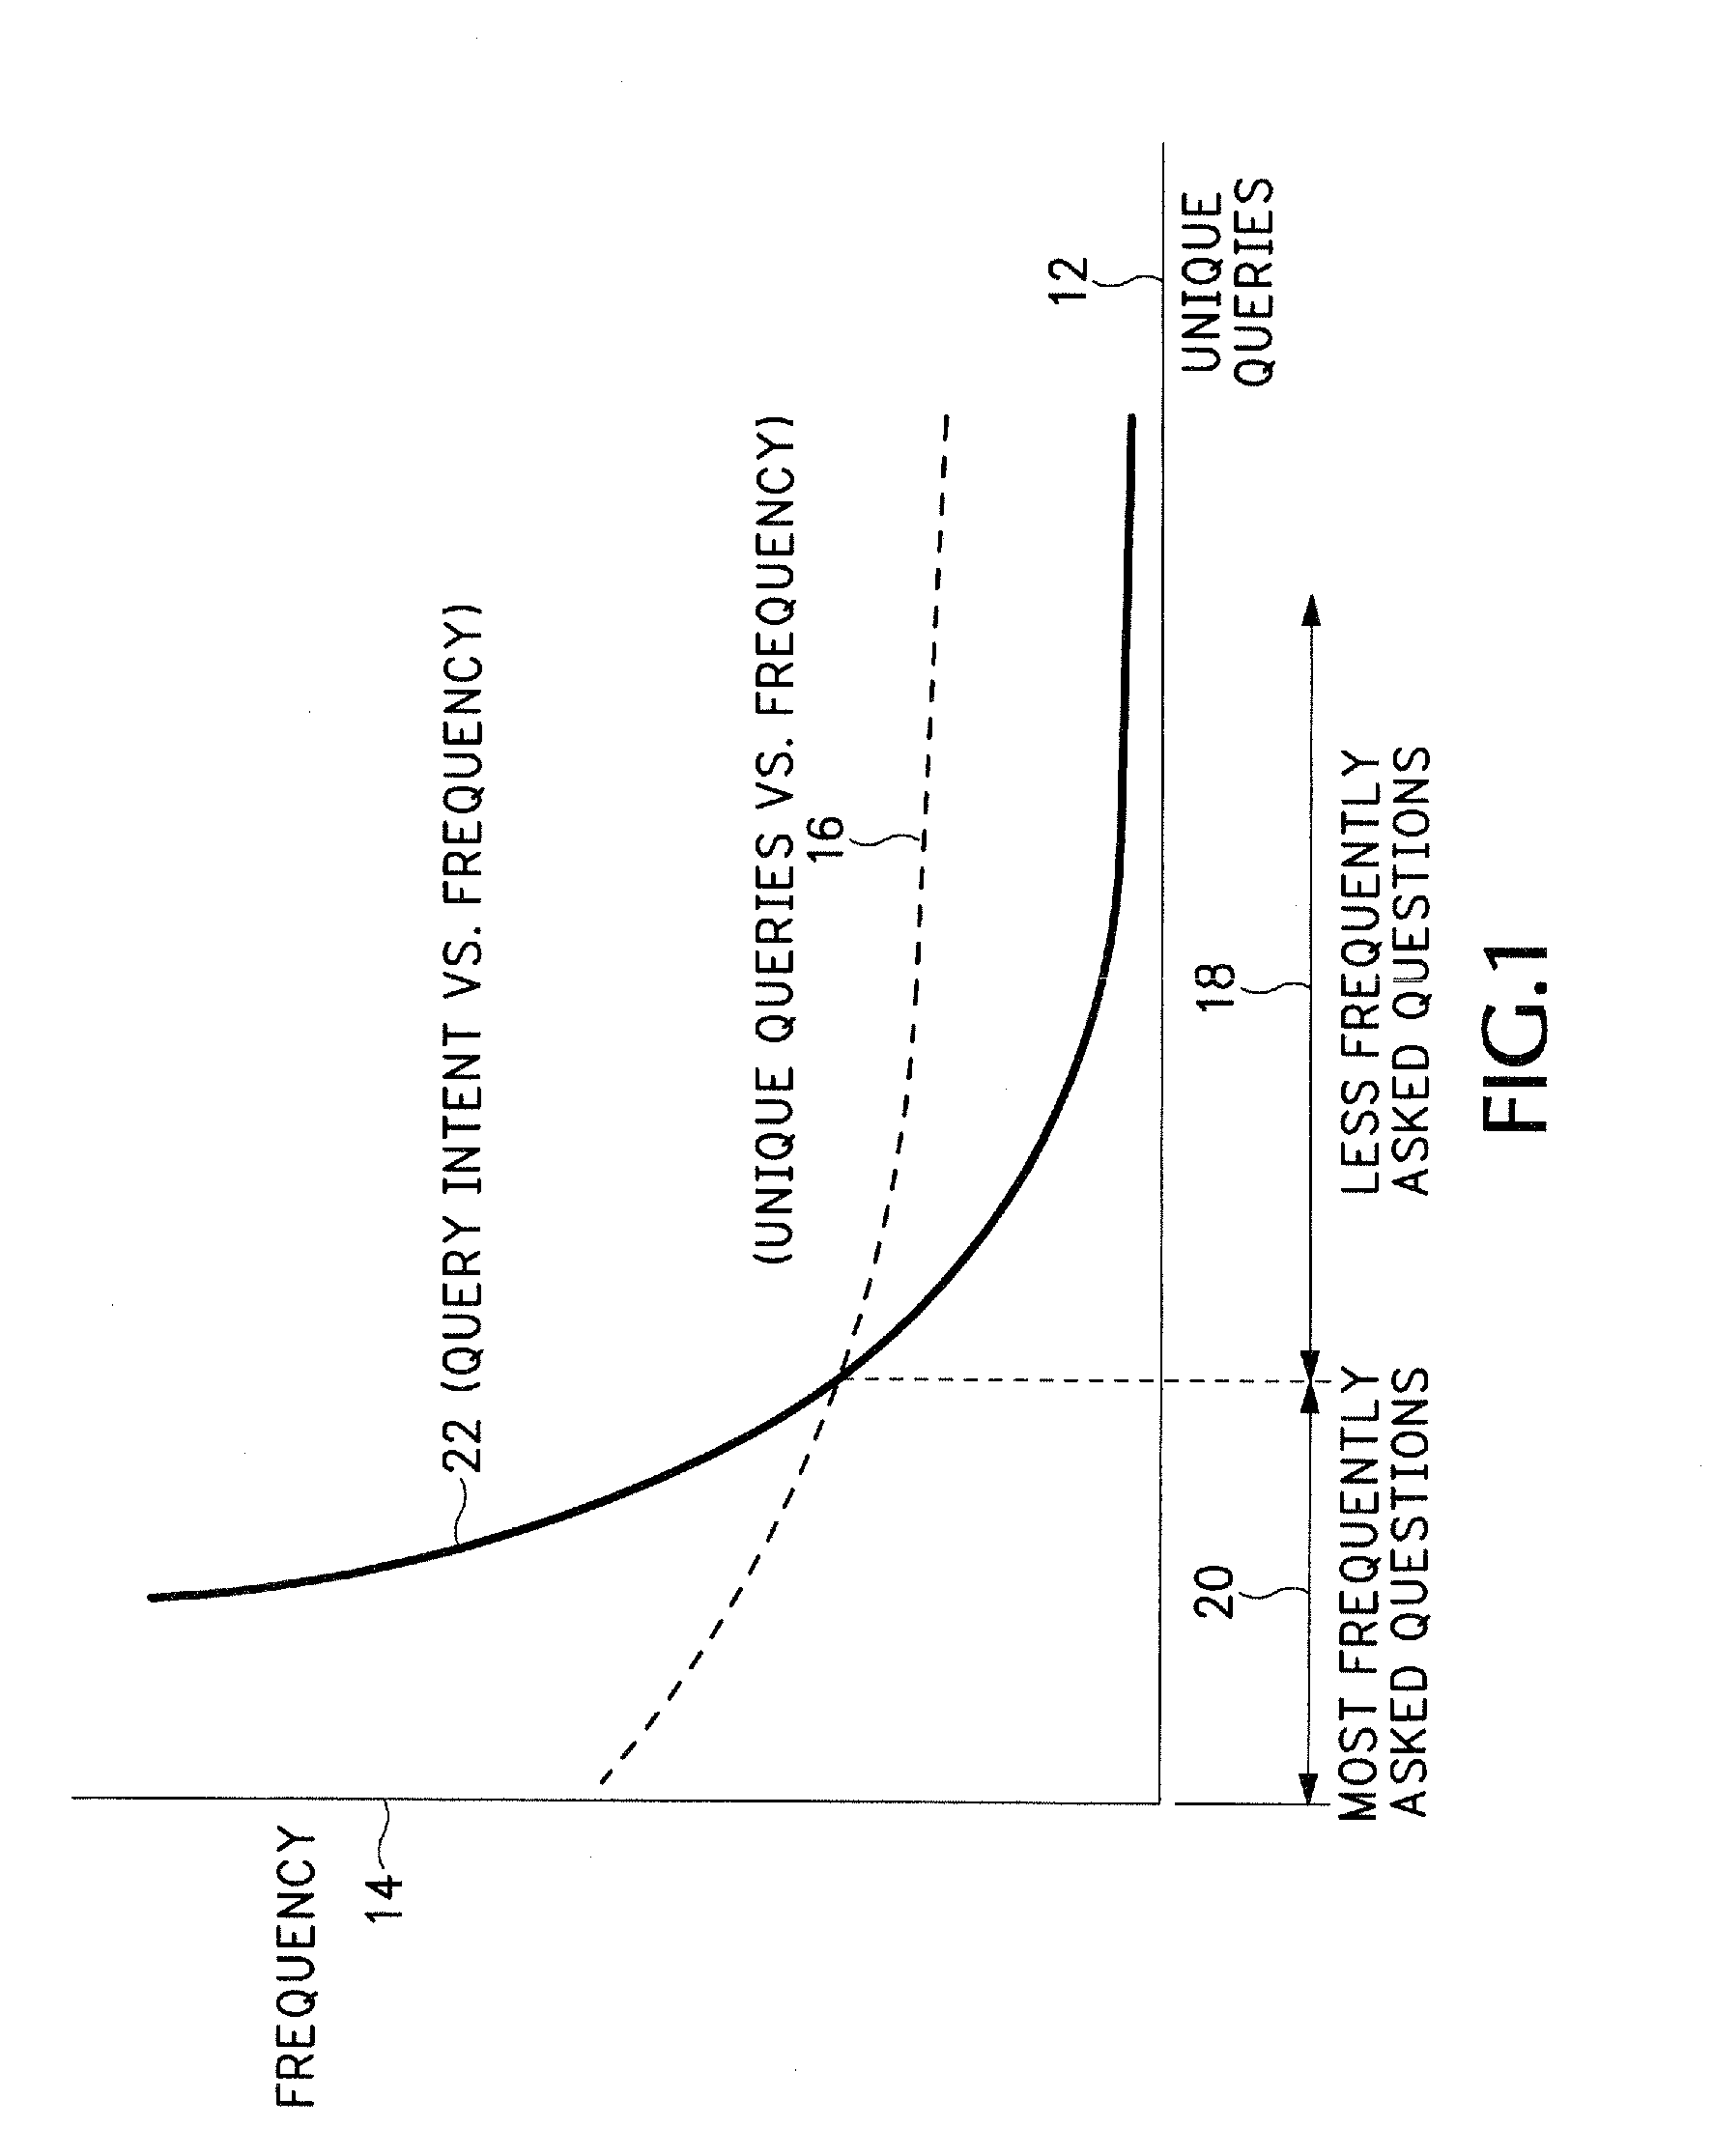
Figure 2 
Figure 3
Abstract
Description
BACKGROUND
[0001] Search engines try to provide the most relevant responses to user questions. Unfortunately, many search engines return information that may be unrelated, or not directly related, to the question. For example, search engines may return any document containing words matching keywords in the question. The user has to then manually sort through each returned document in an attempt to identify information that may be relevant or answer the question. This “brute force” method is time consuming and often fails to locate the precise information sought in the question.
[0002] Current search engines try to help the user in their manual document search by ranking the returned documents. This ranking method may rank documents simply according to the number of words in the documents that match keywords in the query. At least one critical limitation with this keyword search technique is that the user may not necessarily input search terms needed by the search engine to locate the co...
Examples
Embodiment Construction
[0025]FIG. 1 is a graph showing the relationship between unique search queries and the frequency they are received by a particular enterprise. The enterprise could be any type of business or institution, such as a car dealer, financial service, telecommunications company, etc. that has a search engine that attempts to provide responses to questions submitted by users via computer terminals. The horizontal axis 12 refers to the different unique queries that may be received by one or more search engines operated by the enterprise. The vertical axis 14 refers to the frequency of the different unique queries.
[0026]A challenge exists trying to algorithmically decipher the meaning of received queries and then provide responses associated with the identified query meaning. For example, the shape of curve 16 indicates that a first portion 20 of the unique queries occur with the most frequency and a second portion 18 of the queries occur with slightly less frequency. As can be seen, a large ...