System and method for displaying gantt charts with other project management tools

a project management and gantt chart technology, applied in the field of scheduling and user interfaces, can solve the problems of unsuitable computer displays for larger gantt charts, unwieldy projects with more than thirty activities, etc., and achieve the effects of reducing the amount of scrolling, improving search and workflow, and easy control

Active Publication Date: 2012-08-14
INT BUSINESS MASCH CORP
View PDF11 Cites 39 Cited by
  • Summary
  • Abstract
  • Description
  • Claims
  • Application Information

AI Technical Summary

Benefits of technology

[0006]Adding a new tool herein called the “Gantt chart map display” to a typical Gantt chart, enables a high-level view of all running projects to be automatically narrowed down and sorts projects for a particular date range into view. The Gantt chart map display provides a unique and innovative visual means to easily control, see and manage all projects running in a Gantt chart. Introducing a high level “Gantt Chart Map Display” tool in addition to a Gantt chart can provide a complete view of running projects for that day and over the year or a particular time span. There is no fixed starting “X” and “Y” coordinate to begin displaying bar rules but rather a more efficient “view” filter can be used instead. A dynamic set of controls allows the Gantt chart “view” of running projects to be filtered by different days, weeks, months or years or by user selectable entries of date ranges. The “view” filter can also automatically re-sort and scale content into a viewable area reducing the amount of scrolling and thereby improving search and workflow. Details of projects can be displayed in a corresponding form view below the Gantt chart. A Gantt chart as described above greatly enhances the ability to navigate, manage and view a greater expanse of the Gantt chart.

Problems solved by technology

Although a Gantt chart is easily comprehended for small projects that fit on a single sheet or screen, they can become unwieldy for projects with more than about thirty activities.
Larger Gantt charts may not be suitable for most computer displays due to excessive horizontal and vertical scrolling.

Method used


Image

  • System and method for displaying gantt charts with other project management tools
  • System and method for displaying gantt charts with other project management tools
  • System and method for displaying gantt charts with other project management tools

Examples


Embodiment Construction

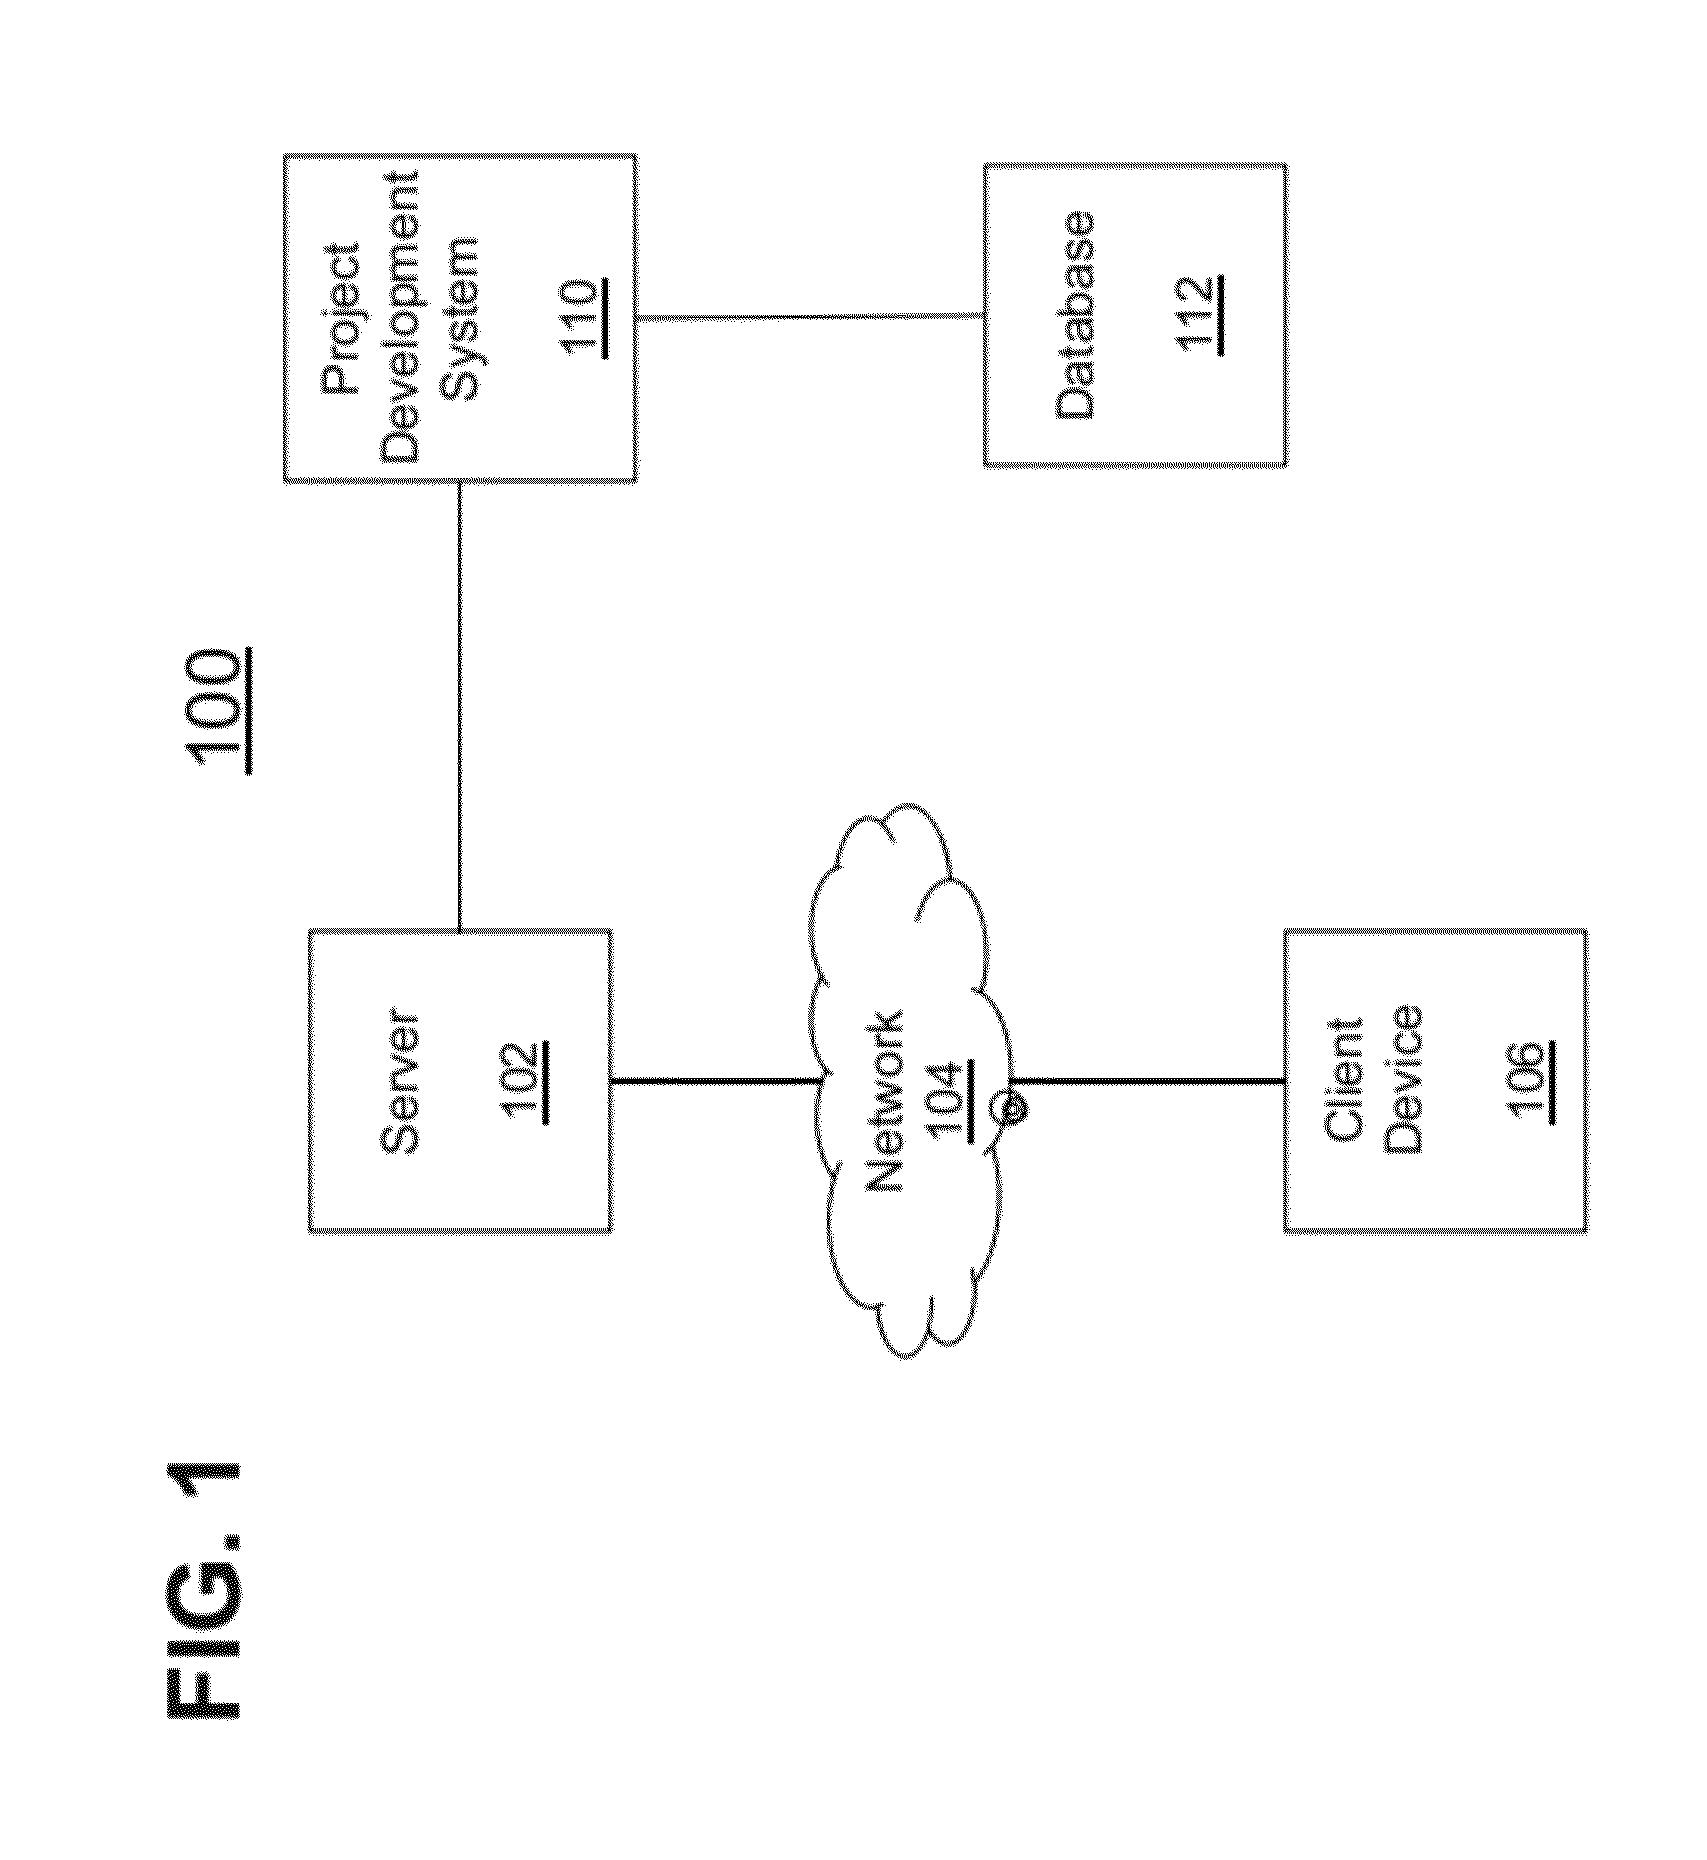
[0013]Referring to FIG. 1, a block diagram of a system 100 suitable for dynamically and graphically representing a project in a Gantt chart or a Gantt chart display map is shown. In one implementation, system 100 can include a server such as an application server or web server 102 that can be connected to a network 104. In one implementation, network 104 includes a worldwide collection of networks and connection devices using various protocols to communicate with one another (e.g., the Internet). These protocols may include the Lightweight Directory Access Protocol (LDAP), the Transport Control Protocol / Internet Protocol (TCP / IP) suite of protocols, the Hypertext Transport Protocol (HTTP), the Wireless Application Protocol (WAP), and other suitable communication protocols.

[0014]System 100 can communicate with a client device 106 running a client application. In one implementation, the client application can be a browser application capable of displaying Web pages retrieved from serv...


PUM


Abstract

A graphical user interface for a Gantt chart map display (100) includes a list of projects (214), a corresponding activity timeline reflecting activity for each project, and a control (210) at a side or bottom area of the Gantt chart map display for manipulating date ranges viewable in the viewable area. The GUI further includes a selected date range control (204) providing a high level view (202) of the corresponding activity timeline displayed in the viewable area (212) above and can provide a high level view of corresponding activity beyond the scrollable view. A dynamic set of controls (205 and 206) enables preset filtered views of the Gantt chart with preset time frames such as days, weeks, months and years or predetermined date ranges entered by a user. The preset filtered view can also automatically re-sort and scale content on the Gantt chart into a viewable area to reduce scrolling.

Description

FIELD OF THE INVENTION[0001]The present invention relates to the fields of scheduling and user interfaces and, more particularly, to a Gantt chart map display used for process or project development.BACKGROUND[0002]Project development systems allow a user to develop and manage a project, among other things. Such systems can support various types of projects, including marketing projects, design projects, manufacturing projects, consulting projects, development projects, and any combination thereof. Project development systems can include project development applications that run on computing devices used for managing one or more projects.[0003]Project development systems often use a project structure to describe a given project. In general, a project structure maps real-world aspects of a project, such as timelines and tasks, into an electronically accessible format. For example, many project development systems describe a start, finish, and other schedule dates of a project, the ta...

Claims


Application Information

Patent Timeline
Patent Type & Authority Patents(United States)
IPC IPC(8): G06F3/048
CPCG06Q10/06
Inventor SHARP, NICHOLASENZI, JASONFOUNTOULAKIS, ELEFTERIOSLAM, BARONRABBIOR, MICHAEL CHRISTOPHER
Owner INT BUSINESS MASCH CORP
Why Eureka
Try Eureka