Method and system for performing multi-zone association and scaling display on K line graph or USA (United States of America) line graph

A technology for zooming and displaying K-line diagrams, applied in graphics and image conversion, 2D image generation, image data processing, etc., can solve problems such as fragmentation, graphic information cannot be continuously displayed, and graphic information stream input cannot be obtained

Active Publication Date: 2016-02-10
SHENZHEN ADAM SOFTWARE
View PDF5 Cites 1 Cited by
  • Summary
  • Abstract
  • Description
  • Claims
  • Application Information

AI Technical Summary

Benefits of technology

This patented technology allows multiple areas with different colors on top of each other's borders to be displayed simultaneously without obscuring any important details about how they are connected together through glyph windows.

Problems solved by technology

Technological Problem addressed by the patented method described in the patents describes how current methods used for representing financial market prices are limited because they only allow one representation per second. However, these limitations have led researchers towards more efficient ways to show larger amounts of detail over all three dimensions simultaneously without compromising their ability to interpret complex relationships within the entire dataset.

Method used


Image

  • Method and system for performing multi-zone association and scaling display on K line graph or USA (United States of America) line graph
  • Method and system for performing multi-zone association and scaling display on K line graph or USA (United States of America) line graph
  • Method and system for performing multi-zone association and scaling display on K line graph or USA (United States of America) line graph

Examples


Embodiment Construction

[0036] In order to make the object, technical solution and advantages of the present invention clearer, the present invention will be further described in detail below in conjunction with the accompanying drawings and embodiments. It should be understood that the specific embodiments described here are only used to explain the present invention, not to limit the present invention.

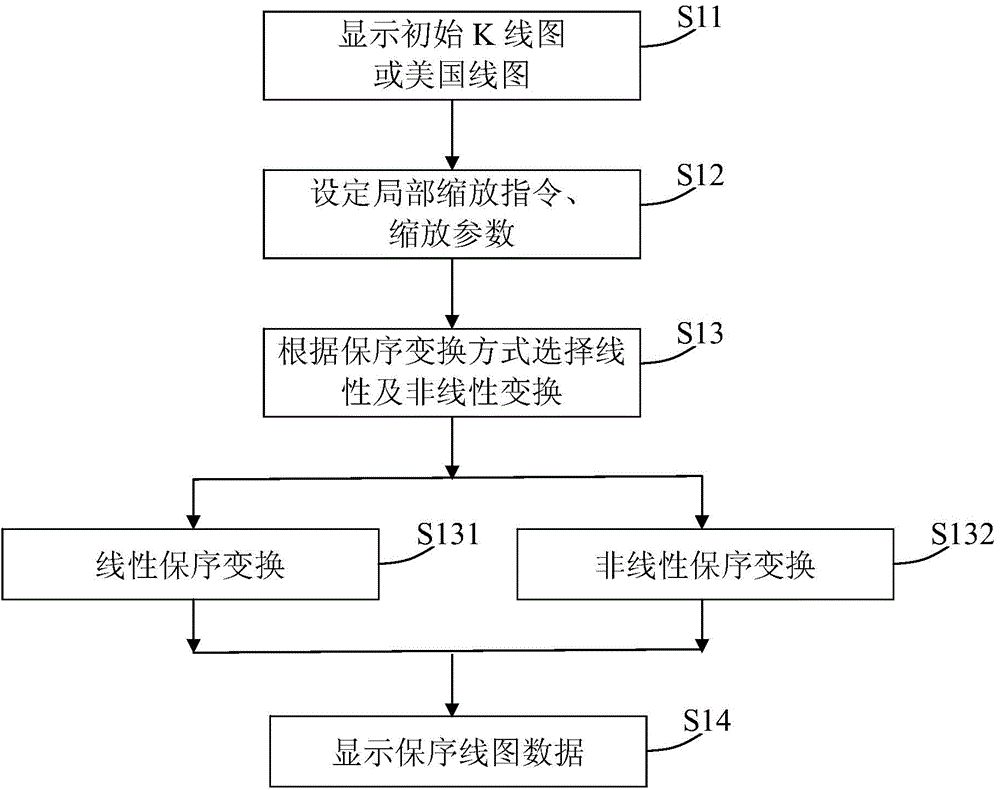
[0037] Such as figure 1 As shown, it is a schematic diagram of an embodiment of the method for multi-region associated zooming and displaying K-line graphs or American line graphs in the present invention, which can display locally zoomed K-line graphs (or American line graphs) and K-line graphs in the same display window of a computer. other parts of the graph (or the US line graph). The method includes the following steps:

[0038] Step S11: convert the overall graphic data y=f(x) of the K line chart or the American line chart into a function v=f(u), and display the function v=f(u) in the compute...


PUM


Abstract

The present invention provides a method and system for performing multi-zone association and scaling display on a K line graph or a USA (United States of America) line graph. The method comprises the following steps: (a) by using time axis as horizontal axis, displaying global line graph data of a K line graph or a USA line graph in a line graph display window; (b) receiving local scaling instruction and local scaling parameter by means of human-computer interaction interface; (c) performing isotonic transformation of time axis dimension on line graph data within a corresponding range on the K line graph or the USA line graph according to the local scaling instruction and the local scaling parameter, and obtaining isotonic line graph data with global data and local data integrated; and (d) replacing the global line graph data with the isotonic line graph data after isotonic transformation in the line graph display window and displaying the isotonic line graph data. According to the method and system for performing multi-zone association and scaling display on the K line graph or the USA (United States of America) line graph provided by the present invention, by performing single-dimensional, multi-zone and variable-proportion isotonic mapping transformation on the local data of the K line graph or the USA line graph, associated display of the global data and the local data can be implemented, and the problem that organic correlation between ''global and local'' line graph information is cut off by the display window can be well solved.

Description


Claims


Application Information

Patent Timeline
Owner SHENZHEN ADAM SOFTWARE
Why Eureka
Try Eureka