Method and system for zooming and displaying k-line chart or American line chart in multiple regions

A technology for zooming and displaying K-line diagrams, which is applied in the direction of graphic image conversion, 2D image generation, image data processing, etc., which can solve the problem of affecting the observer's deep grasp of transaction information, the inability to obtain graphic information flow input, and the inability of graphic information Continuous display and other issues

Active Publication Date: 2019-08-09
SHENZHEN ADAM SOFTWARE
View PDF5 Cites 0 Cited by
  • Summary
  • Abstract
  • Description
  • Claims
  • Application Information

AI Technical Summary

Problems solved by technology

[0006] Although such a technical solution can display "overall and partial" transaction information at the same time, it has brought new problems: the original organic connection between the overall and partial graphic information of the K-line chart or the US line chart is displayed in multiple windows. was torn apart
[0007] That is, the global and local graphic information of the K-line chart or the US line chart is displayed in different {G0} and {Gi, i=1, 2, 3,...,n} respectively, so that the observer can move from the whole to the In the process of looking at the K-line chart or the American line chart locally, from part to the whole, you will encounter the problem that the graphical information cannot be continuously displayed at the edge of the window, and the brain cannot obtain continuous graphical information flow input, so it will affect the observer's understanding of transaction information deep grasp of

Method used


Image

  • Method and system for zooming and displaying k-line chart or American line chart in multiple regions
  • Method and system for zooming and displaying k-line chart or American line chart in multiple regions
  • Method and system for zooming and displaying k-line chart or American line chart in multiple regions

Examples


Embodiment Construction

[0038] In order to make the object, technical solution and advantages of the present invention clearer, the present invention will be further described in detail below in conjunction with the accompanying drawings and embodiments. It should be understood that the specific embodiments described here are only used to explain the present invention, not to limit the present invention.

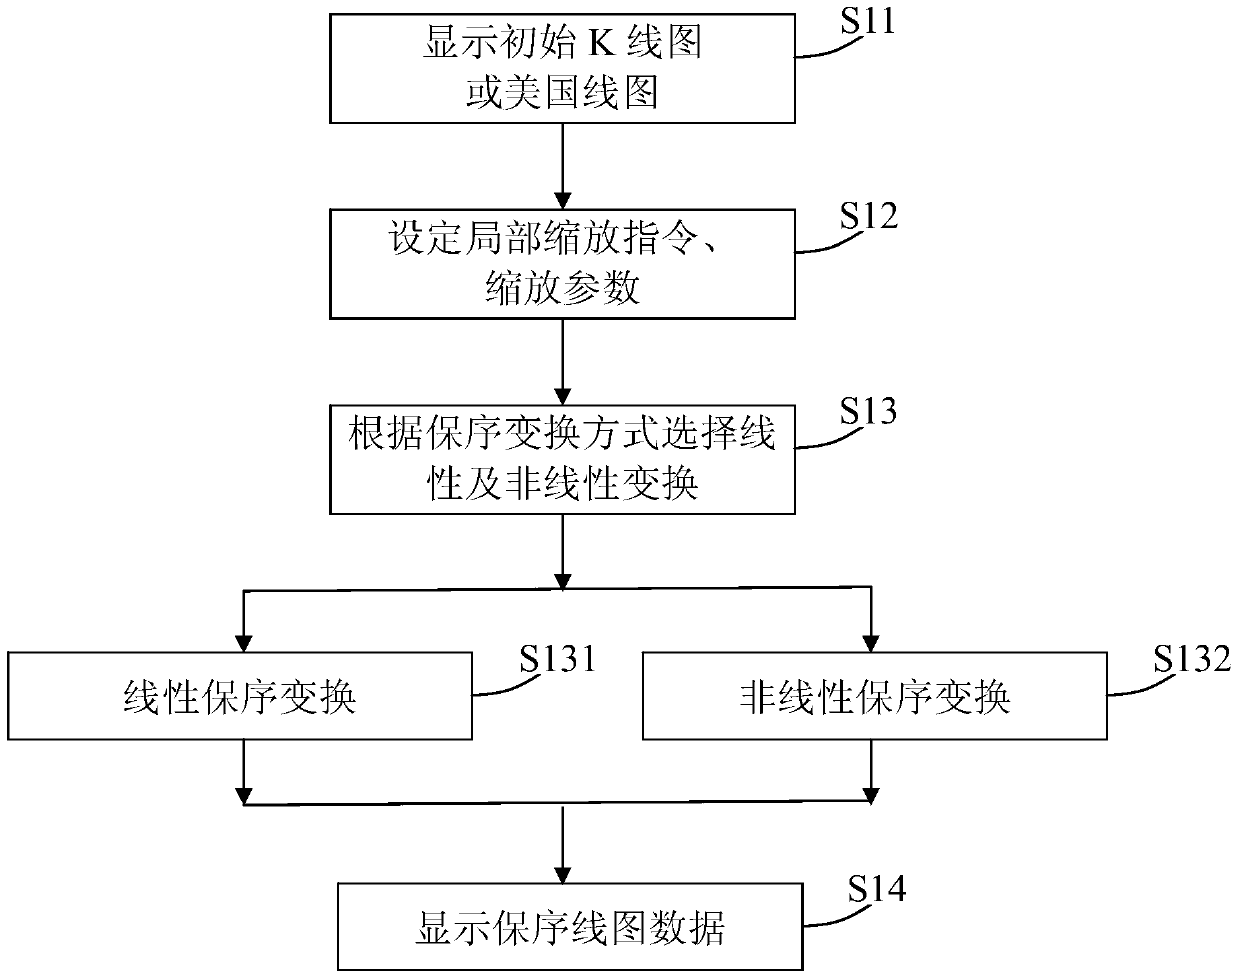
[0039] like figure 1 As shown, it is a schematic diagram of an embodiment of the method for multi-region associated zooming and displaying K-line graphs or American line graphs in the present invention, which can display locally zoomed K-line graphs (or American line graphs) and K-line graphs in the same display window of a computer. other parts of the graph (or the US line graph). The method includes the following steps:

[0040] Step S11: convert the overall graphic data y=f(x) of the K line chart or the American line chart into a function v=f(u), and display the function v=f(u) in the computer...


PUM


Abstract

The present invention provides a method and system for performing multi-zone association and scaling display on a K line graph or a USA (United States of America) line graph. The method comprises the following steps: (a) by using time axis as horizontal axis, displaying global line graph data of a K line graph or a USA line graph in a line graph display window; (b) receiving local scaling instruction and local scaling parameter by means of human-computer interaction interface; (c) performing isotonic transformation of time axis dimension on line graph data within a corresponding range on the K line graph or the USA line graph according to the local scaling instruction and the local scaling parameter, and obtaining isotonic line graph data with global data and local data integrated; and (d) replacing the global line graph data with the isotonic line graph data after isotonic transformation in the line graph display window and displaying the isotonic line graph data. According to the method and system for performing multi-zone association and scaling display on the K line graph or the USA (United States of America) line graph provided by the present invention, by performing single-dimensional, multi-zone and variable-proportion isotonic mapping transformation on the local data of the K line graph or the USA line graph, associated display of the global data and the local data can be implemented, and the problem that organic correlation between ''global and local'' line graph information is cut off by the display window can be well solved.

Description

technical field [0001] The present invention relates to the field of computer graphics display, more specifically, a method and system for displaying trading K-line charts or American line charts in a time-axis multi-region associated zooming manner. Background technique [0002] The so-called K-line chart or American line chart is a line chart applied to stock markets, funds, spot markets, futures and foreign exchange transactions. Its composition is a two-dimensional graph with time as the abscissa and price as the ordinate. Each time coordinate corresponds to a transaction price. In the information expression of the human-machine interface of the computer trading system, when a large amount of trading information is displayed in the form of a K-line chart or an American line chart, there will always be an unavoidable "overall and partial contradiction" problem. That is, the contradiction formed between the infinite time dimension of the line chart and the limitation of t...

Claims


Application Information

Patent Timeline
Patent Type & Authority Patents(China)
IPC IPC(8): G06T3/40G06T11/00G06F3/0484
Inventor 李毅吕珂
Owner SHENZHEN ADAM SOFTWARE
Why Eureka
Try Eureka