A three-dimensional visualization method of complex coherent signals

A visualization and complex coherence coefficient technology, applied in the field of three-dimensional visualization of complex coherent signals, to achieve the effect of improving research

Active Publication Date: 2020-08-04
NAT SPACE SCI CENT CAS
View PDF6 Cites 0 Cited by
  • Summary
  • Abstract
  • Description
  • Claims
  • Application Information

AI Technical Summary

Problems solved by technology

However, there is no method that can fully describe the power information and coherence information of complex coherent signals at the same time

Method used


Image

  • A three-dimensional visualization method of complex coherent signals
  • A three-dimensional visualization method of complex coherent signals
  • A three-dimensional visualization method of complex coherent signals

Examples


Embodiment Construction

[0070] The present invention will be further described now in conjunction with accompanying drawing.

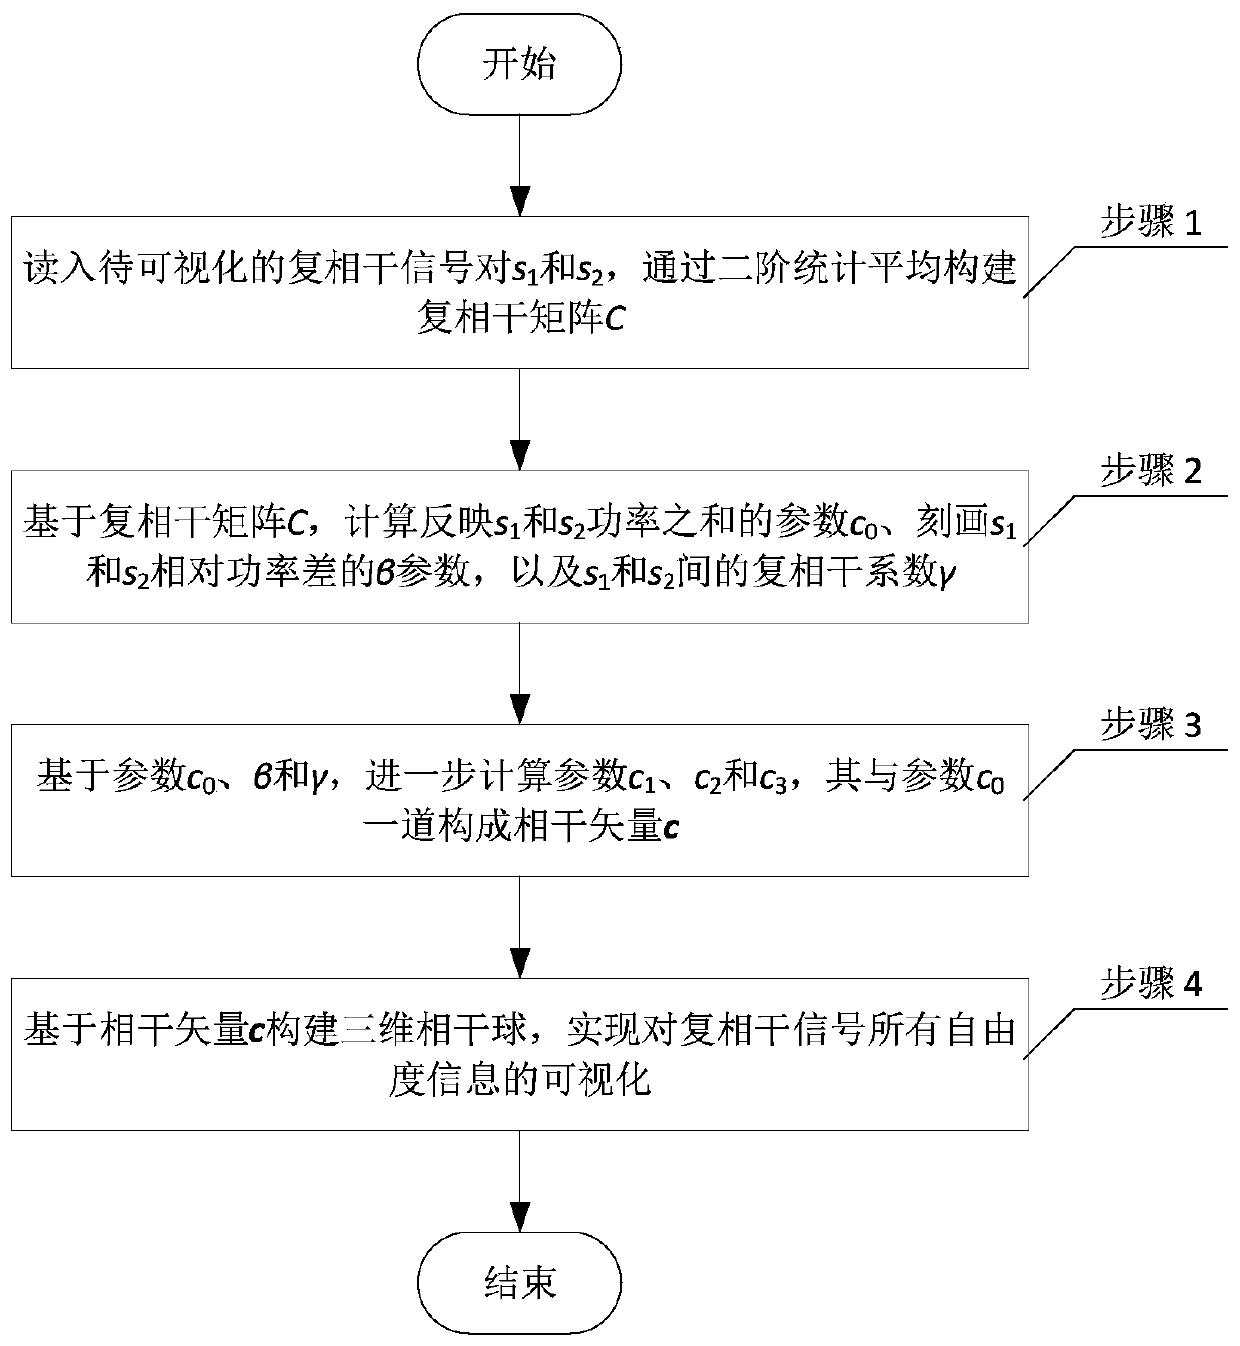
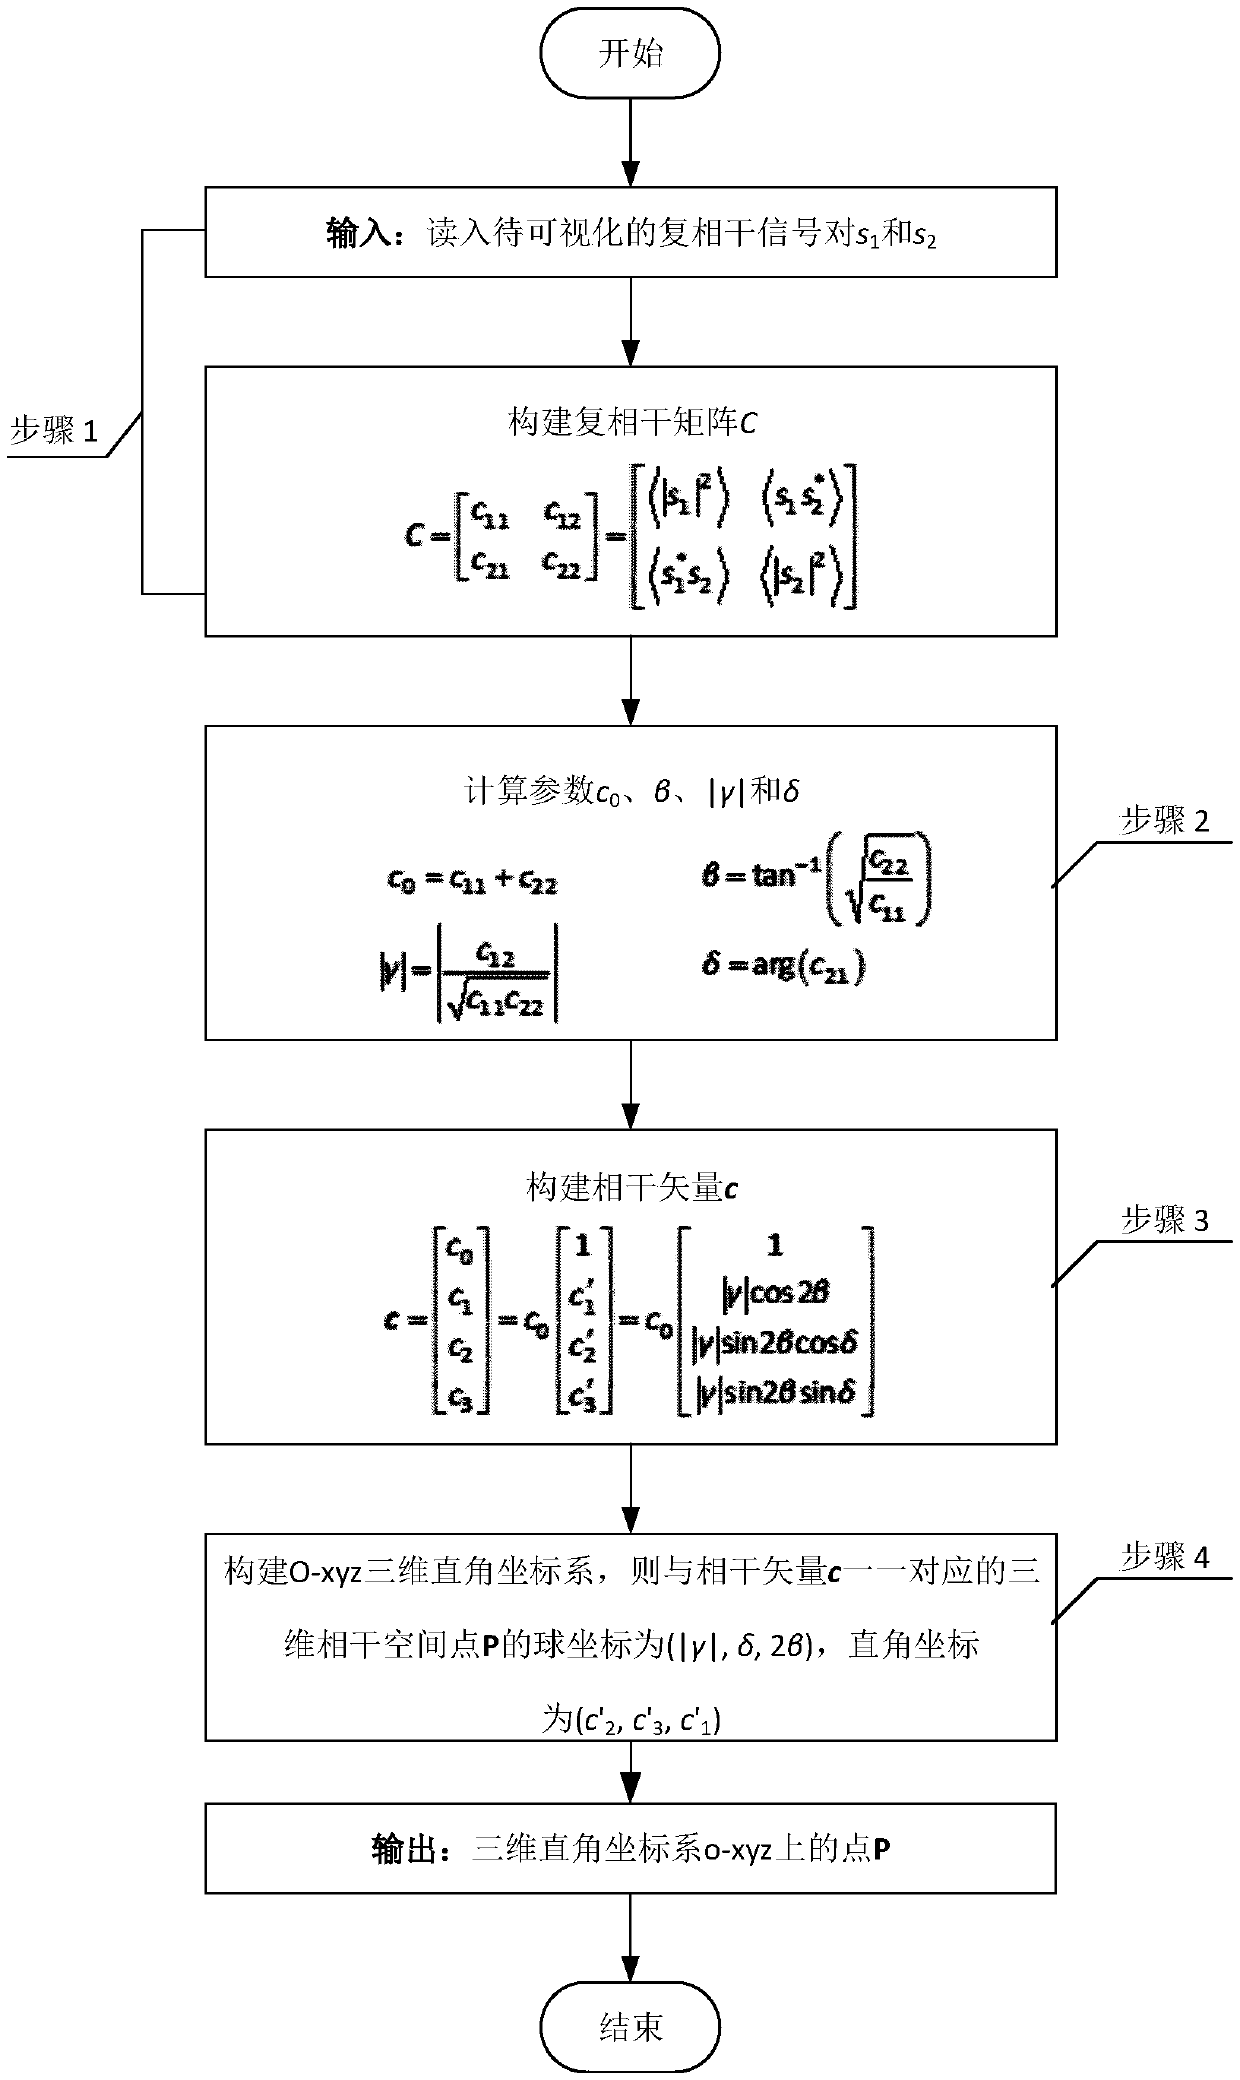
[0071] refer to figure 1 with figure 2 , a kind of complex coherent signal three-dimensional visualization method of the present invention comprises the following steps:

[0072] Step 1), read in the complex coherent signal pair s to be visualized 1 and s 2 , constructing the complex coherence matrix C by second-order statistical averaging;

[0073] Step 2), based on the complex coherence matrix C constructed in step 1), calculate the reflection s 1 and s 2 c of power sum 0 parameters, characterizations 1 and s 2 the beta parameter of the relative power difference, and s 1 and s 2 The complex coherence coefficient γ between;

[0074] Step 3), based on the parameter c obtained in step 2) 0 , β and γ, and further calculate the parameter c 1 、c 2 and c 3 , which with parameter c 0 together form the coherence vector c;

[0075] In step 4), a three-dimensional c...


PUM


Abstract

The invention discloses a complex coherent signal three-dimensional visualization method comprising a step 1) of reading a complex coherent signal pairs s1 and s2 to be visualized, and constructing acomplex coherent matrix C by second-order statistical averaging; a step 2) of based on the complex coherent matrix C constructed in the step 1), calculating a parameter c0 reflecting the power sum ofs1 and s2, a parameter [beta] describing the relative power difference of s1 and s2, and a complex coherence coefficient [gamma] between s1 and s2; a step 3) of based on the parameters c0, [beta] and[gamma] obtained in the step 2), further calculating parameters c1, c2 and c3 so as to constitute a coherent vector c together with the parameter c0; a step 4) of constructing a three-dimensional coherent sphere based on the coherent vector c obtained in the step 3) so as to visualize all degree of freedom information of the complex coherent signal. The complex coherent signal three-dimensional visualization method completely describes the power information and the coherent information of the complex coherent signal by expanding a traditional two-dimensional circular map into a three-dimensional coherent sphere.

Description

technical field [0001] The invention relates to a multi-dimensional information visualization method, in particular to a three-dimensional visualization method of complex coherent signals. Background technique [0002] In applications such as radar signal processing, especially radar interference signal processing, our research object is usually a pair of complex signals s 1 and s 2 , they come from the scattered echoes of the same target at different observation geometries / times, or from the responses of the same signal passing through different channels, etc. for s 1 and s 2 For the characterization of , we either obtain its average power <|s through incoherent measurements 1 | 2 > and <|s 2 | 2 >, or obtain a description of its coherence coefficient |γ| Figure 5 The two-dimensional circular diagram shown in the figure is represented, where |γ| is the radius, and δ is the direction angle. However, there is no method that can fully describe the power in...

Claims


Application Information

Patent Timeline
Patent Type & Authority Patents(China)
IPC IPC(8): G01S7/04G01S7/20
CPCG01S7/04G01S7/20
Inventor 李东张云华
Owner NAT SPACE SCI CENT CAS
Why Eureka
Try Eureka