Method for displaying data visualization design of intelligent operation management center

A technology of operation management and data, applied in the field of data visualization, can solve problems such as inability to reuse and fail to meet the status quo of productization, and achieve the effects of increasing reusability and ease of use, reducing repeated communication, and reducing the difficulty of technology development

Pending Publication Date: 2021-12-28
华建数创(上海)科技有限公司
View PDF0 Cites 0 Cited by
  • Summary
  • Abstract
  • Description
  • Claims
  • Application Information

AI Technical Summary

Problems solved by technology

Due to different application scenarios and various types of data source requirements, data visualization usually adopts a unique design and cannot be reused
Massive data g

Method used


Image

  • Method for displaying data visualization design of intelligent operation management center
  • Method for displaying data visualization design of intelligent operation management center
  • Method for displaying data visualization design of intelligent operation management center

Examples


Embodiment Construction

[0030] The preferred embodiments of the present invention will be described in detail below in conjunction with the accompanying drawings, and the present invention will be further elaborated.

[0031] First, combine the figure 1 The method for visual design and display of data in the smart operation management center according to the embodiment of the present invention is described, which is used for the large screen of the smart operation center (IOC) in the smart operation management center, and its application scenarios are very wide.

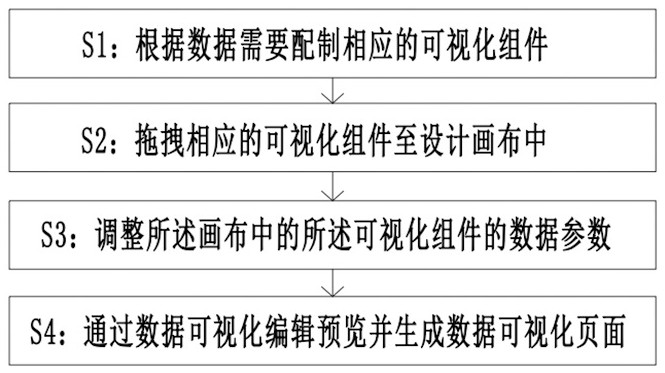
[0032] Such as figure 1 As shown, the method for visual design and display of data in the smart operation management center in the embodiment of the present invention includes the following steps:

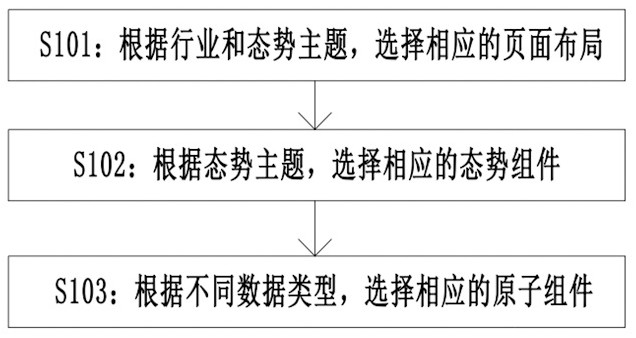
[0033] S1: if figure 1 As shown, configure the corresponding visualization components according to the data needs.

[0034] This design presentation approach includes data visualization editing and visualization component libraries. Visual e...


PUM


Abstract

The invention discloses a method for displaying data visualization design of an intelligent operation management center. The method comprises the following steps: preparing a corresponding visualization component according to data requirements; dragging the corresponding visual component to the design canvas; adjusting data parameters of a visual component in the canvas; and editing and previewing through data visualization and generating a data visualization page. According to the method, the data visualization preview can be quickly established, the reusability and the usability are improved, and the human resource cost is saved while the data visualization display efficiency is improved; a graphic visualization operation interface is provided for business personnel, demand personnel and developers in the data visualization project development process, the development process is simplified, the technology development difficulty is reduced, repeated communication is reduced, and the project delivery efficiency is improved; a datamation design display method is provided for smart cities, smart parks and smart buildings, and modularized and efficient project delivery is realized.

Description

technical field [0001] The invention relates to the field of data visualization, in particular to a method for visual design and display of data in an intelligent operation management center. Background technique [0002] With the continuous advancement of my country's urban intelligence process, the demand for intelligent operation center (Intelligent operation center) display is also gradually increasing. Due to different application scenarios and various types of data source requirements, data visualization usually adopts a unique design and cannot be reused. The massive data generated by various industries needs to be combined with multi-scenario display, and the unique design for the project can no longer meet the current status of productization. The rapid construction of automated design components can meet the needs of different scenarios, and visualize data based on multiple data sources to solve data visualization problems in multiple industries and projects. ...

Claims


Application Information

Patent Timeline
IPC IPC(8): G06F8/38G06F3/0486G06F3/0481
CPCG06F8/38G06F3/0486G06F3/0481
Inventor 朱洪波沈育祥王玉宇来永政吴焱
Owner 华建数创(上海)科技有限公司
Why Eureka
Try Eureka