
Method for detecting light rare earth hydride using non-contact raman spectrum
A Raman spectrum detection, non-contact technology, applied in the cross field of material science and substance detection, to achieve the effect of convenient detection, low economic cost, safe and reliable detection process
Patent Information
- Authority / Receiving Office
- CN · China
- Patent Type
- Applications(China)
- Current Assignee / Owner
- Publication Date
- 2016-06-08
Smart Images
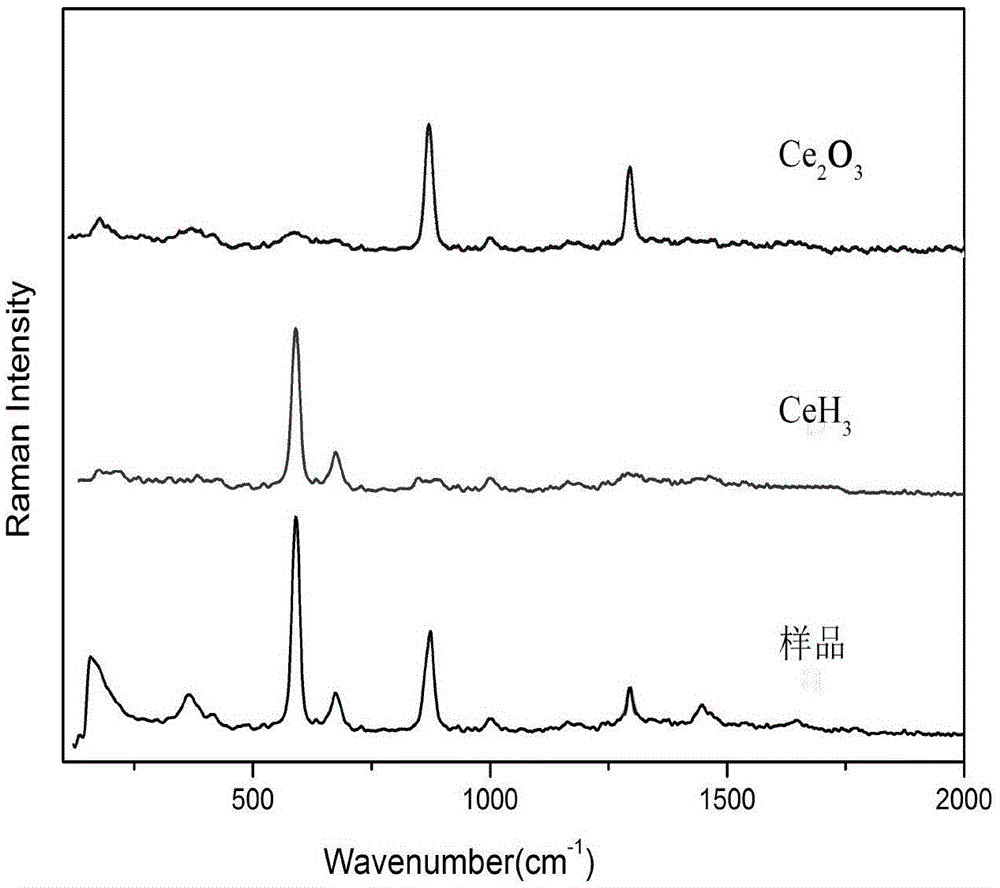
Figure 1 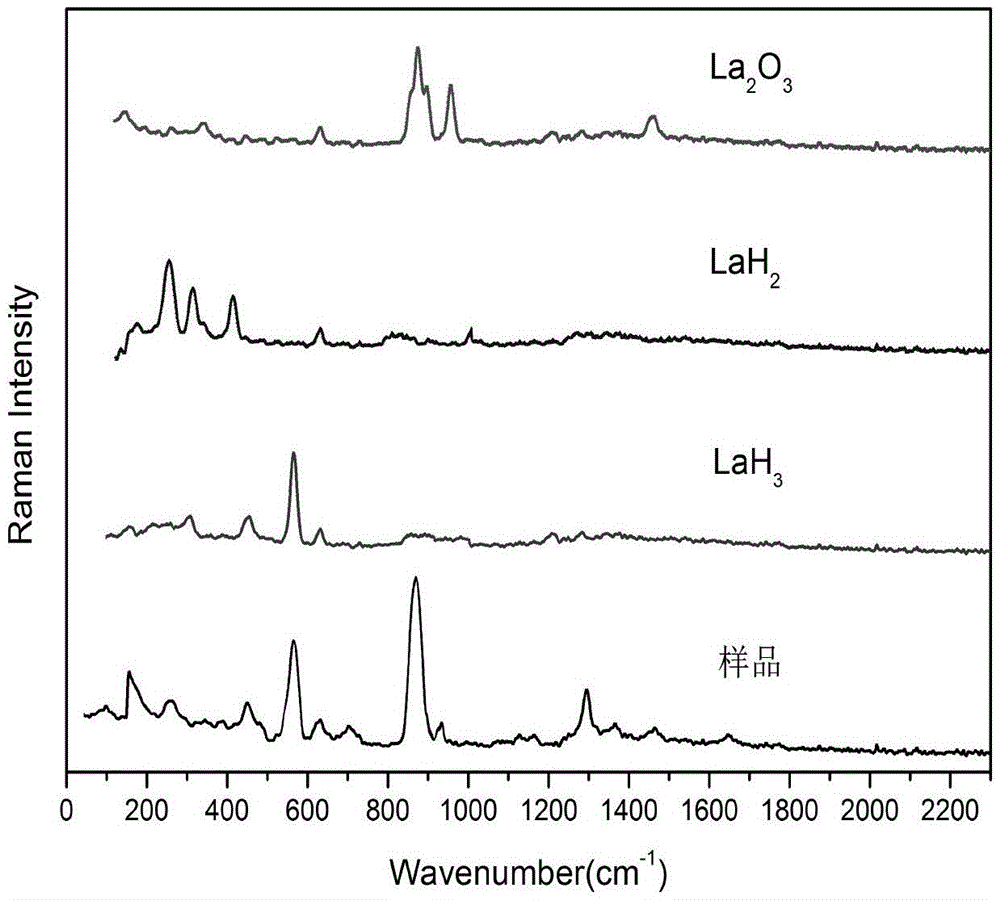
Figure 2 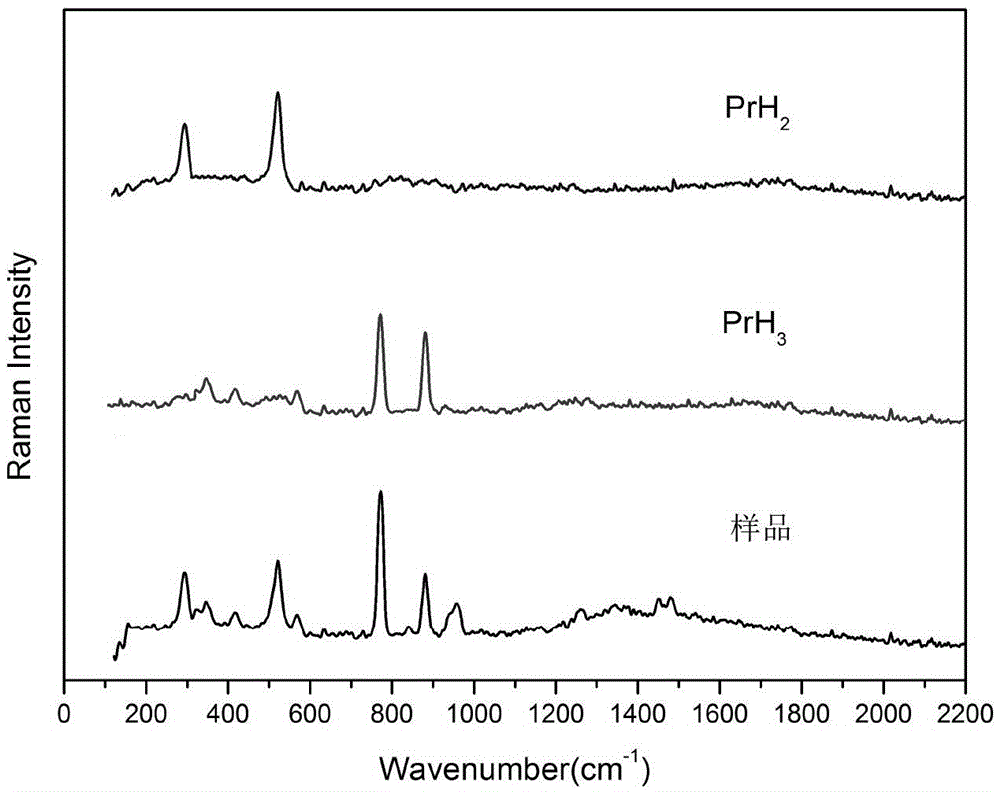
Figure 3
Abstract
Description
technical field
[0001] The invention relates to a method for non-contact Raman spectrum detection of rare earth metal hydrides, which belongs to the cross field of material science and substance detection. Background technique
[0002] Rare earth metal hydrogen storage material is a kind of metal hydrogen storage material with good performance and wide application. Its application fields have been expanded to energy, chemical industry, electronics, aerospace, military and civilian fields. Rare earth hydrogen storage alloys used for chemical heat storage and chemical heat pumps can recover and heat up low-quality heat such as waste heat from factories, thus opening up new ways for humans to effectively utilize various energy sources. The pressure generated when the rare earth hydrogen storage material is used to release hydrogen can be used as a thermal drive power. The use of rare earth hydrogen storage alloys can achieve small size, light weight, and high output power, and ...
Examples
Embodiment 1
[0022] A method for non-contact Raman spectroscopy detection of rare earth metal hydrides, the specific steps are as follows:
[0023] Step 1, in a vacuum environment, under the protection of an inert gas, grind the cerium hydride sample to be detected into a 100-mesh powder and place it in a quartz sample bottle, then add 20ml of anhydrous and oxygen-free aviation kerosene to the bottle, Take out after sealing to obtain a sealed bottle;
[0024] Step 2, the sealed bottle obtained in step 1 is scanned and detected with a Raman spectrometer, and the characteristic peaks of the sealed bottle and dispersant aviation kerosene are removed to obtain the spectrogram peak curve and data of the tested sample, and it is found that the tested Raman spectral curve is at 620cm -1 nearby, 880cm -1 near and 1300cm -1 There are obvious characteristic peaks nearby;
[0025] Step 3, compare the Raman spectrum of the sample obtained in step 2 with the corresponding cerium trihydride (CeH 3 )...
Embodiment 2
[0027] Step 1: Grind the lanthanum hydride powder to be detected into a 100-mesh powder under the protection of an inert gas in a vacuum environment and place it in a polystyrene sample bottle, and then add 30ml of anhydrous and oxygen-free tetrachloride to the bottle. Carbonization solution is taken out after sealing to obtain a sealed bottle;
[0028] Step 2. Scan the sealed bottle obtained in step 1 with a Raman spectrometer to remove the characteristic peaks of the sealed bottle and dispersant to obtain the peak curve and data of the tested sample. It is found that the tested Raman spectrum curve is at 257cm -1 nearby, 321cm -1 nearby, 418cm -1 nearby, 570cm -1 nearby, 629cm -1 nearby, 873cm -1 near and 958cm -1 There are obvious characteristic peaks nearby;
[0029] Step 3, compare the sample Raman spectrum curve obtained in step 2 with the corresponding lanthanum trihydride (LaH 3 ), lanthanum oxide (La 2 o 3 ) and lanthanum dihydride (LaH 2 ) standard Raman sp...
Embodiment 4
[0031] Step 1: Grind the praseodymium hydride powder to be detected into a 100-mesh powder under the protection of an inert gas in a vacuum environment and place it in a sample bottle made of polymethyl methacrylate, then add 35ml to the bottle and treat it with anhydrous and oxygen-free treatment. The toluene solution is taken out after sealing to obtain a sealed bottle;
[0032] Step 2. Scan the sealed bottle obtained in step 1 with a Raman spectrometer to remove the characteristic peaks of the sealed bottle and dispersant to obtain the peak curve and data of the tested sample. It is found that the tested Raman spectrum curve is at 297cm -1 nearby, 517cm -1 nearby, 769cm -1 near and 877cm -1 There are obvious characteristic peaks nearby;
[0033] Step 3, compare the sample Raman spectrum curve obtained in step 2 with the corresponding praseodymium trihydrogen (PrH 3 ) and praseodymium hydride (PrH 2 ) standard Raman spectrum for curve and characteristic peak data compar...