FTIR vs Resonance Raman: Understanding Spectral Lines
SEP 22, 20259 MIN READ
Generate Your Research Report Instantly with AI Agent
Patsnap Eureka helps you evaluate technical feasibility & market potential.
FTIR and Raman Spectroscopy Evolution and Objectives
Spectroscopic techniques have evolved significantly over the past century, with Fourier Transform Infrared (FTIR) and Raman spectroscopy emerging as complementary analytical methods for molecular characterization. The development of FTIR can be traced back to the early 20th century, with significant advancements occurring in the 1960s when computational capabilities enabled practical implementation of the Fourier transform algorithm. This technological breakthrough transformed infrared spectroscopy from a slow, limited technique to a powerful analytical tool with enhanced sensitivity and resolution.
Raman spectroscopy, discovered by C.V. Raman in 1928, remained primarily an academic curiosity until the invention of the laser in the 1960s provided the intense monochromatic light source necessary for practical applications. The subsequent development of resonance Raman techniques in the 1970s and 1980s further expanded the capabilities of this methodology, allowing for selective enhancement of signals from specific molecular structures.
The technological trajectory of both techniques has been characterized by continuous improvements in instrumentation, including more sensitive detectors, higher resolution capabilities, and increasingly sophisticated data processing algorithms. Recent innovations include portable and handheld devices, enabling field applications that were previously confined to laboratory settings. The integration of these spectroscopic methods with microscopy has also opened new avenues for spatial analysis at micro and nanoscales.
The fundamental distinction between FTIR and Raman spectroscopy lies in their physical principles: FTIR measures absorption of infrared radiation, while Raman detects the inelastic scattering of monochromatic light. This difference results in complementary spectral information, with FTIR typically providing data on polar functional groups and Raman excelling at identifying symmetric, non-polar bonds and crystalline structures.
The primary objective of comparing these techniques is to establish a comprehensive understanding of their respective strengths, limitations, and optimal application scenarios. This includes evaluating their sensitivity to different molecular structures, their ability to distinguish between similar compounds, and their performance in various sample environments. Additionally, this analysis aims to identify opportunities for synergistic application, where combined use of both techniques provides more complete molecular characterization than either method alone.
Future technological objectives include enhancing spectral resolution, improving signal-to-noise ratios, developing more sophisticated chemometric analysis tools, and expanding the range of materials and conditions under which these techniques can be effectively applied. The ultimate goal is to refine these spectroscopic methods to address increasingly complex analytical challenges across diverse fields including materials science, pharmaceutical development, environmental monitoring, and biomedical research.
Market Applications and Demand Analysis for Spectroscopic Technologies
The spectroscopic technology market has witnessed substantial growth driven by increasing applications across pharmaceutical, chemical, environmental, and materials science sectors. FTIR (Fourier Transform Infrared) and Resonance Raman spectroscopy represent two distinct yet complementary analytical techniques with diverse market applications and growing demand trajectories.
The global spectroscopy market was valued at approximately 13.2 billion USD in 2022 and is projected to reach 17.8 billion USD by 2027, growing at a CAGR of 6.2%. Within this broader market, molecular spectroscopy, which encompasses both FTIR and Raman technologies, accounts for roughly 45% of the total market share, highlighting the significant commercial relevance of these technologies.
Pharmaceutical and biotechnology sectors remain the largest consumers of spectroscopic technologies, utilizing FTIR for drug formulation analysis, quality control, and raw material verification. The pharmaceutical industry's stringent regulatory requirements have created sustained demand for reliable analytical methods, with FTIR being favored for its speed and non-destructive nature.
Resonance Raman spectroscopy has found particular traction in biomedical applications, where its enhanced sensitivity allows for detection of specific biomolecules at low concentrations. The growing focus on personalized medicine and point-of-care diagnostics has accelerated demand for portable Raman systems, with market analysts predicting a 9.5% growth rate in this subsegment through 2028.
Environmental monitoring represents another significant growth area, with both technologies being deployed for pollutant identification and water quality assessment. Government regulations regarding environmental protection across North America, Europe, and increasingly in Asia-Pacific regions have stimulated market demand for spectroscopic solutions capable of detecting trace contaminants.
The food and beverage industry has emerged as a rapidly expanding application area, with FTIR being utilized for authentication and adulteration detection. This sector's demand is primarily driven by increasing food safety concerns and regulatory compliance requirements, creating a market segment growing at approximately 7.8% annually.
Regional analysis reveals North America as the dominant market for advanced spectroscopic technologies, followed by Europe and Asia-Pacific. However, the highest growth rates are observed in emerging economies, particularly China and India, where expanding industrial bases and increasing R&D investments are creating new market opportunities for both FTIR and Raman technologies.
Customer demand increasingly favors integrated solutions that combine multiple spectroscopic techniques with advanced data analysis capabilities, reflecting the market's evolution toward comprehensive analytical platforms rather than standalone instruments.
Current Capabilities and Technical Limitations of FTIR vs Raman
FTIR spectroscopy currently offers exceptional capabilities in molecular identification through its ability to capture comprehensive mid-infrared spectra (400-4000 cm⁻¹) in a single measurement. Modern FTIR systems achieve resolutions of 0.1-4 cm⁻¹ with measurement times of seconds to minutes, making them highly efficient for routine analysis. The technique excels in analyzing solid, liquid, and gas samples with minimal preparation, particularly through attenuated total reflection (ATR) accessories that require virtually no sample preparation.
However, FTIR faces significant limitations in several areas. Water interference remains problematic as strong H₂O absorption bands can mask important spectral features, necessitating careful sample preparation or atmospheric compensation. Spatial resolution is typically limited to 10-20 μm due to diffraction limits at infrared wavelengths, restricting microscopic applications. Detection sensitivity generally ranges from 0.1-1% concentration levels, making trace analysis challenging without specialized sampling techniques.
Raman spectroscopy, particularly resonance Raman, demonstrates complementary strengths. Modern Raman systems achieve spatial resolution down to 1 μm or better, enabling detailed microscopic analysis of heterogeneous samples. The technique offers exceptional molecular specificity through the "fingerprint region" (500-1700 cm⁻¹) and can detect concentrations as low as parts per million in favorable cases. Resonance Raman provides dramatic signal enhancement (10³-10⁶ times) when the excitation wavelength matches electronic transitions of the analyte.
Raman's technical limitations include fluorescence interference, which can overwhelm the relatively weak Raman signal, particularly with biological samples or materials containing fluorophores. Sample heating from laser excitation may damage sensitive samples or alter their chemical composition during measurement. Additionally, Raman typically requires longer acquisition times than FTIR for comparable signal-to-noise ratios in non-resonant conditions.
Both techniques face challenges in quantitative analysis, requiring careful calibration and reference standards. FTIR struggles with highly absorbing or scattering samples, while Raman has difficulty with highly fluorescent materials. FTIR provides better throughput for routine analysis of known compounds, while Raman offers superior capabilities for aqueous samples and microscopic analysis.
Recent technological advances are addressing these limitations through hybrid systems, advanced computational methods, and novel sampling accessories. Surface-enhanced Raman spectroscopy (SERS) has dramatically improved detection limits, while new FTIR imaging systems are pushing spatial resolution boundaries through near-field techniques.
Comparative Analysis of FTIR and Resonance Raman Methodologies
01 Fundamentals of FTIR and Resonance Raman spectroscopy
FTIR (Fourier Transform Infrared) and Resonance Raman spectroscopy are complementary analytical techniques used for molecular identification and characterization. FTIR measures the absorption of infrared radiation by molecules, while Resonance Raman spectroscopy involves the inelastic scattering of photons. Both techniques produce characteristic spectral lines that correspond to specific molecular vibrations and structures, allowing for detailed analysis of chemical compounds and materials.- Fundamentals of FTIR and Raman spectroscopy techniques: FTIR (Fourier Transform Infrared) and Resonance Raman spectroscopy are complementary analytical techniques used for molecular identification and characterization. These techniques analyze the interaction between electromagnetic radiation and molecular vibrations, producing characteristic spectral lines that serve as molecular fingerprints. The fundamental principles involve different physical phenomena: FTIR measures absorption of infrared radiation, while Raman spectroscopy measures inelastic scattering of monochromatic light. These techniques provide valuable information about molecular structure, composition, and chemical bonding.
- Advanced instrumentation and measurement systems: Advanced instrumentation for FTIR and Resonance Raman spectroscopy incorporates sophisticated optical components, detectors, and data processing systems to enhance spectral resolution and sensitivity. Modern systems often integrate laser sources, interferometers, spectrometers, and specialized detectors optimized for specific wavelength ranges. These instruments may feature automated sample handling, real-time analysis capabilities, and miniaturized designs for portable applications. Innovations in instrumentation focus on improving signal-to-noise ratios, reducing acquisition times, and enhancing the ability to detect and analyze complex spectral lines.
- Data processing and spectral analysis methods: Advanced computational methods are essential for processing and analyzing FTIR and Resonance Raman spectral data. These include algorithms for baseline correction, noise reduction, peak identification, and spectral deconvolution to resolve overlapping bands. Machine learning and artificial intelligence approaches are increasingly applied to spectral analysis for pattern recognition, classification, and quantitative determination. Chemometric techniques such as principal component analysis and partial least squares regression enable extraction of meaningful information from complex spectral datasets, facilitating identification of subtle spectral features and correlations.
- Biomedical and clinical applications: FTIR and Resonance Raman spectroscopy have significant applications in biomedical research and clinical diagnostics. These techniques enable non-invasive analysis of biological tissues, cells, and fluids for disease detection and monitoring. Spectral lines from biomolecules such as proteins, lipids, nucleic acids, and metabolites provide valuable diagnostic information. Applications include cancer detection, monitoring of therapeutic responses, analysis of pathological tissues, and identification of biomarkers. The ability to detect subtle molecular changes associated with disease states makes these spectroscopic techniques powerful tools for medical diagnostics and research.
- Industrial and environmental monitoring applications: FTIR and Resonance Raman spectroscopy are widely used for industrial process monitoring and environmental analysis. These techniques enable real-time monitoring of chemical reactions, quality control in manufacturing, and detection of contaminants in environmental samples. The specificity of spectral lines allows for identification and quantification of multiple components in complex mixtures. Applications include pharmaceutical manufacturing, polymer production, food safety testing, air and water quality monitoring, and detection of hazardous substances. The non-destructive nature and minimal sample preparation requirements make these techniques particularly valuable for routine analysis and field applications.
02 Advanced instrumentation for spectral line analysis
Modern spectroscopic instruments combine multiple technologies to enhance spectral line detection and analysis. These systems often integrate FTIR and Raman capabilities with advanced optics, detectors, and data processing algorithms. Innovations include portable devices, high-resolution spectrometers, and automated systems that can identify spectral lines with greater precision and sensitivity, enabling applications in various fields including material science, pharmaceuticals, and environmental monitoring.Expand Specific Solutions03 Biomedical applications of spectral analysis
FTIR and Resonance Raman spectroscopy are increasingly used in biomedical applications for disease diagnosis and monitoring. The spectral lines produced by these techniques can identify biomarkers in tissues and bodily fluids, detect molecular changes associated with pathological conditions, and monitor therapeutic responses. These non-invasive or minimally invasive methods provide rapid results and can be integrated into clinical workflows for improved patient care and personalized medicine approaches.Expand Specific Solutions04 Data processing and spectral line interpretation
Advanced computational methods are essential for processing and interpreting the complex spectral data generated by FTIR and Resonance Raman spectroscopy. Machine learning algorithms, multivariate analysis, and specialized software tools help identify and characterize spectral lines, remove noise, and extract meaningful information from overlapping signals. These computational approaches enable automated identification of chemical compounds, quantitative analysis, and the creation of spectral libraries for reference and comparison.Expand Specific Solutions05 Industrial and environmental monitoring applications
Spectral line analysis using FTIR and Resonance Raman techniques plays a crucial role in industrial quality control and environmental monitoring. These methods enable real-time analysis of chemical processes, detection of contaminants, verification of product composition, and monitoring of environmental pollutants. The ability to identify specific molecular signatures through spectral lines allows for precise detection of target compounds even in complex matrices, supporting regulatory compliance and process optimization.Expand Specific Solutions
Leading Manufacturers and Research Institutions in Spectroscopy
The spectroscopic analysis market, particularly FTIR and Resonance Raman technologies, is currently in a mature growth phase with increasing applications across pharmaceutical, materials science, and biomedical sectors. The global market size for these spectroscopic techniques is estimated at $1.5-2 billion annually, with steady growth projections. Leading players include established scientific instrumentation companies like Thermo Scientific and Koninklijke Philips, alongside specialized firms such as Spectra Analysis Instruments and QuantaSpec. Academic institutions including Purdue Research Foundation, National University of Singapore, and University of Liverpool contribute significantly to technological advancements. The technology maturity varies between applications, with FTIR being more established while Resonance Raman techniques continue to evolve with enhanced sensitivity and specificity for complex molecular analysis.
Thermo Scientific Portable Analytical Instruments, Inc.
Technical Solution: Thermo Scientific has developed advanced handheld FTIR spectrometers that utilize Fourier Transform Infrared technology to identify unknown substances in field conditions. Their solution incorporates diamond ATR (Attenuated Total Reflectance) sampling interfaces that enable direct analysis of solids, liquids, powders, and gels without sample preparation. The company's FTIR systems employ interferometers with moving mirrors to generate interferograms that are mathematically converted to spectral data via Fourier transformation. Their technology captures the entire infrared spectrum simultaneously, providing comprehensive molecular fingerprinting by measuring how samples absorb infrared light at different wavelengths. Thermo's instruments feature spectral libraries containing thousands of compounds for rapid identification, with algorithms that can identify components in mixtures and determine their concentrations. The portable nature of their instruments allows for non-destructive analysis directly at sampling sites, eliminating the need for sample transport to laboratories.
Strengths: Superior portability allowing field deployment; comprehensive spectral libraries for rapid identification; minimal sample preparation requirements; non-destructive analysis capabilities. Weaknesses: Lower spectral resolution compared to laboratory FTIR systems; limited sensitivity for trace components; potential interference from environmental conditions like humidity affecting field measurements.
Quantaspec, Inc.
Technical Solution: Quantaspec has pioneered specialized Resonance Raman spectroscopy systems that exploit the resonance enhancement effect to achieve significantly higher sensitivity for targeted molecular detection. Their technology utilizes laser excitation wavelengths specifically tuned to match electronic transitions in target molecules, resulting in signal enhancements of 10^3 to 10^6 compared to conventional Raman. This approach allows for selective enhancement of chromophores and fluorophores within complex biological samples. Quantaspec's systems incorporate advanced laser stabilization technology to maintain precise excitation wavelengths, critical for consistent resonance conditions. Their instruments feature sophisticated optical filtering systems to remove Rayleigh scattered light while preserving the Raman signal, and employ high-sensitivity CCD detectors cooled to reduce thermal noise. The company has developed proprietary algorithms for background fluorescence subtraction, a common challenge in Raman spectroscopy. Quantaspec's technology enables detection of specific biomolecules at concentrations as low as nanomolar levels, making it particularly valuable for pharmaceutical and biomedical applications.
Strengths: Exceptional sensitivity for specific target molecules; ability to detect compounds at very low concentrations; selective enhancement of specific molecular components in complex mixtures; minimal water interference. Weaknesses: Requires precise wavelength matching to target molecules; potential for sample photodegradation due to higher laser powers; more complex instrumentation requiring specialized expertise; limited to compounds with suitable chromophores.
Key Patents and Scientific Breakthroughs in Spectral Line Analysis
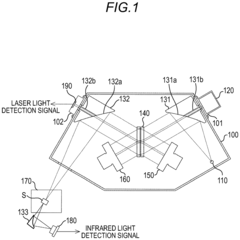
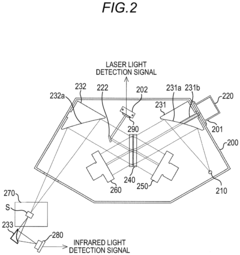
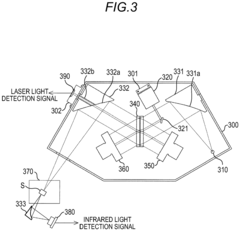
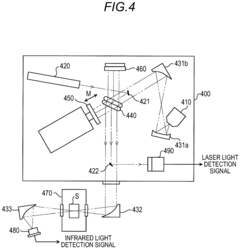
Fourier transform spectrophotometer
PatentInactiveEP3285053A1
Innovation
- Incorporating a first and second reflection mirror with through-holes to align and separate the laser and measurement light paths, reducing the number of optical elements and facilitating optical axis adjustment by allowing the laser light to be introduced and extracted without additional reflection mirrors.
Data Processing Algorithms for Spectral Interpretation
The interpretation of spectral data from FTIR and Resonance Raman techniques requires sophisticated data processing algorithms to extract meaningful information from complex spectral patterns. These algorithms serve as the bridge between raw spectral data and actionable analytical insights.
Baseline correction algorithms represent a fundamental preprocessing step for both FTIR and Raman spectroscopy. For FTIR, polynomial fitting methods effectively address sloping baselines, while wavelet transformation techniques excel at handling more complex baseline distortions in Raman spectra. The selection of appropriate baseline correction parameters significantly impacts the accuracy of subsequent quantitative analysis.
Noise reduction algorithms employ various mathematical approaches to enhance signal quality. Savitzky-Golay filtering has proven particularly effective for FTIR spectra by preserving peak shapes while reducing random noise. For Raman spectroscopy, especially resonance Raman, principal component analysis (PCA) offers superior performance in separating signal from noise in complex biological samples.
Peak detection and deconvolution algorithms address the challenge of overlapping spectral features. Second-derivative methods excel at identifying hidden peaks in FTIR spectra, while Gaussian-Lorentzian mixed functions provide optimal peak fitting for Raman data. Recent machine learning approaches have demonstrated remarkable accuracy in automated peak identification across both spectroscopic methods.
Multivariate statistical methods have revolutionized spectral interpretation. Partial least squares regression (PLS) enables quantitative analysis of complex mixtures in FTIR data, while hierarchical cluster analysis (HCA) excels at pattern recognition in resonance Raman spectra. These techniques have proven particularly valuable for pharmaceutical quality control applications.
Chemometric algorithms facilitate the extraction of chemical information from spectral data. Soft independent modeling of class analogies (SIMCA) has demonstrated exceptional performance in classifying unknown samples based on FTIR spectral patterns. For resonance Raman, two-dimensional correlation spectroscopy algorithms reveal subtle molecular interactions that would otherwise remain undetected.
Recent advances in deep learning have introduced convolutional neural networks capable of automated spectral interpretation with minimal human intervention. These algorithms have shown particular promise in real-time monitoring applications where traditional algorithms struggle with processing speed requirements.
Miniaturization Trends and Portable Spectroscopy Solutions
The miniaturization of spectroscopic technologies has revolutionized analytical capabilities across multiple industries, with significant advancements in both FTIR and Raman spectroscopy. Recent developments have focused on reducing the size, weight, and power requirements while maintaining analytical performance comparable to laboratory instruments.
Portable FTIR devices have evolved from bulky suitcase-sized units to handheld analyzers weighing less than 2 kg. This transformation has been enabled by innovations in interferometer design, including the development of monolithic interferometers that eliminate moving parts and enhance durability. Microelectromechanical systems (MEMS) technology has further contributed to size reduction, with some modern portable FTIR spectrometers achieving dimensions of approximately 20 × 10 × 5 cm.
For Resonance Raman spectroscopy, miniaturization has followed a different trajectory due to the inherent requirements for laser excitation sources and sensitive detectors. Recent breakthroughs include the integration of photonic integrated circuits (PICs) that combine multiple optical components on a single chip, dramatically reducing instrument footprint. Compact diode lasers with precise wavelength control have replaced larger gas lasers, enabling resonance enhancement while maintaining portability.
Battery technology advancements have been crucial for field deployment of both technologies. Modern portable spectroscopic devices can now operate continuously for 8-12 hours on a single charge, compared to 1-2 hours just five years ago. This extended operational capability has been achieved through both improved battery energy density and more efficient optical and electronic components.
Data processing capabilities have also evolved significantly. Edge computing implementations allow for on-device spectral analysis without requiring connection to external computers. Machine learning algorithms optimized for low-power processors can now identify spectral patterns and perform quantitative analysis in real-time, enhancing the utility of portable instruments in field applications.
The market has responded with specialized solutions targeting specific application domains. For environmental monitoring, ruggedized units with IP67 ratings provide reliable operation in harsh conditions. In pharmaceutical verification, miniaturized systems with optimized spectral ranges focus on specific compound identification. Medical diagnostics has seen the emergence of smartphone-compatible spectrometers that leverage the processing power and connectivity of consumer devices.
As miniaturization continues, the convergence of FTIR and Raman technologies in hybrid portable instruments represents an emerging trend, offering complementary spectral information from a single compact platform. These developments are expanding the application scope of spectroscopic analysis beyond traditional laboratory settings into point-of-need testing across diverse fields.
Unlock deeper insights with Patsnap Eureka Quick Research — get a full tech report to explore trends and direct your research. Try now!
Generate Your Research Report Instantly with AI Agent
Supercharge your innovation with Patsnap Eureka AI Agent Platform!