FTIR vs Spectrophotometry: Assessing Pigment Distribution
SEP 22, 202510 MIN READ
Generate Your Research Report Instantly with AI Agent
Patsnap Eureka helps you evaluate technical feasibility & market potential.
FTIR and Spectrophotometry Background and Objectives
Fourier Transform Infrared Spectroscopy (FTIR) and Spectrophotometry represent two cornerstone analytical techniques in the field of material characterization and pigment analysis. These technologies have evolved significantly over the past century, with FTIR emerging in the mid-20th century as an advancement over traditional dispersive infrared spectroscopy, while spectrophotometric methods trace their origins to the early color measurement systems of the 1900s.
FTIR technology operates by measuring the absorption or transmission of infrared radiation through a sample, creating a molecular fingerprint that identifies chemical structures based on their vibrational modes. The technique has progressed from early interferometer designs to modern systems featuring advanced detectors and computational capabilities, enabling rapid, high-resolution spectral acquisition. This evolution has transformed FTIR from a specialized laboratory tool to an essential analytical method across numerous industries.
Spectrophotometry, conversely, measures how materials interact with light across the ultraviolet, visible, and near-infrared regions of the electromagnetic spectrum. Its development trajectory has seen significant advancements in light source technology, detector sensitivity, and data processing algorithms. Modern spectrophotometers can provide precise quantitative measurements of color properties, concentration, and molecular composition with remarkable accuracy.
The convergence of these technologies in pigment distribution analysis represents a particularly promising research direction. Pigments, as complex chemical compounds responsible for color in various materials, present unique analytical challenges due to their diverse chemical structures and physical properties. Understanding their spatial distribution within substrates is crucial for applications ranging from art conservation to advanced manufacturing processes.
The primary objective of this technical investigation is to comprehensively evaluate the comparative efficacy of FTIR and spectrophotometric techniques in characterizing pigment distribution across various material matrices. Specifically, we aim to determine which methodology provides superior spatial resolution, chemical specificity, and quantitative accuracy when mapping pigment concentrations in heterogeneous samples.
Secondary objectives include assessing the complementary nature of these techniques when used in combination, identifying optimal instrumental parameters for specific pigment classes, and exploring emerging hyphenated technologies that integrate aspects of both methodologies. Additionally, we seek to establish standardized protocols for sample preparation and data analysis that maximize the information yield from both techniques.
The anticipated outcomes of this research will directly inform technology development strategies for next-generation analytical instrumentation, potentially leading to hybrid systems that leverage the strengths of both approaches. Furthermore, the findings will contribute to fundamental understanding of pigment-substrate interactions, with implications for formulation science, quality control processes, and non-destructive testing methodologies across multiple industries.
Market Applications for Pigment Distribution Analysis
Pigment distribution analysis technologies, particularly FTIR and spectrophotometry, have found significant applications across multiple industries where color consistency, material composition, and quality control are paramount. The art conservation and restoration sector represents one of the most sophisticated applications, where these technologies enable conservators to identify original pigments, detect forgeries, and guide restoration processes with unprecedented precision. Museums and cultural institutions worldwide have adopted these analytical methods to preserve historical artifacts and authenticate valuable artworks.
In the manufacturing sector, pigment distribution analysis has become essential for quality control in industries producing paints, coatings, plastics, textiles, and printing inks. Companies like PPG Industries, Sherwin-Williams, and BASF have integrated spectrophotometric analysis into their production lines to ensure batch-to-batch consistency and meet stringent color matching requirements. The automotive industry particularly benefits from these technologies, as vehicle manufacturers demand perfect color matching across different components produced by various suppliers.
The pharmaceutical and cosmetic industries utilize these analytical methods to ensure product uniformity and regulatory compliance. Pharmaceutical companies employ FTIR and spectrophotometry to verify the homogeneous distribution of active ingredients in tablets and capsules, while cosmetic manufacturers use these technologies to maintain consistent coloration in makeup products. L'Oréal, Estée Lauder, and Johnson & Johnson have invested significantly in advanced pigment analysis systems to enhance product quality and reduce manufacturing variability.
The textile and fashion industries have embraced spectrophotometric analysis to ensure color consistency across different fabric batches and maintain brand identity through precise color matching. Major retailers like Zara, H&M, and Nike rely on these technologies to maintain color standards across global supply chains and production facilities.
Emerging applications include the food industry, where pigment analysis helps detect adulteration and ensure natural colorant consistency, and the environmental sector, where these technologies assist in identifying pollutants and microplastics. The construction materials industry has also adopted these analytical methods to ensure consistent coloration in concrete, tiles, and other building materials.
The global market for pigment distribution analysis technologies continues to expand as industries increasingly recognize the value of precise color control and material verification. The integration of artificial intelligence and machine learning with spectroscopic techniques is creating new opportunities for automated quality control systems and real-time monitoring solutions across these diverse market applications.
Technical Limitations and Challenges in Pigment Assessment
Despite significant advancements in pigment assessment technologies, both FTIR (Fourier Transform Infrared Spectroscopy) and spectrophotometry face substantial technical limitations when evaluating pigment distribution in various matrices. FTIR's primary challenge lies in its spatial resolution constraints, typically limited to 10-20 micrometers, which proves inadequate for analyzing nano-scale pigment distributions increasingly common in advanced materials and coatings. Additionally, FTIR struggles with highly absorptive or reflective samples, leading to signal attenuation and reduced analytical accuracy.
Spectrophotometry, while excellent for quantitative color analysis, encounters difficulties with heterogeneous samples where pigment distribution varies throughout the material. The technique provides averaged measurements across the sampling area, potentially masking localized concentration variations critical for quality control in manufacturing processes. Furthermore, spectrophotometric methods often require extensive calibration procedures specific to each pigment system, limiting their versatility across diverse material compositions.
Both technologies face significant challenges when analyzing complex multi-pigment systems. Spectral overlapping in FTIR can make it difficult to distinguish between chemically similar pigments, while spectrophotometry struggles to differentiate between color contributions from multiple pigments with similar absorption profiles. This becomes particularly problematic in artistic, historical, or high-performance industrial applications where precise pigment identification and distribution mapping are essential.
Sample preparation represents another major hurdle, especially for FTIR analysis. Samples often require specific thickness, homogeneity, and surface characteristics to yield reliable results. For spectrophotometry, surface texture and geometry significantly impact measurements, requiring standardized preparation protocols that may alter the original pigment distribution being studied.
Environmental factors introduce additional complications, with both techniques showing sensitivity to humidity, temperature fluctuations, and ambient light conditions. These variables can introduce measurement inconsistencies that complicate comparative analyses across different laboratory settings or time periods.
Data interpretation presents perhaps the most significant challenge. Converting spectral information into meaningful pigment distribution maps requires sophisticated algorithms and reference databases. Current software solutions often struggle with complex matrices where pigment interactions, substrate effects, and aging phenomena alter spectral signatures. This limitation frequently necessitates complementary analytical techniques to validate findings, increasing analysis complexity and cost.
Emerging research points toward hybrid approaches combining multiple spectroscopic techniques with advanced computational methods as the most promising path forward for overcoming these limitations in comprehensive pigment distribution assessment.
Comparative Analysis of Current Methodologies
01 FTIR spectroscopy for pigment analysis
Fourier Transform Infrared (FTIR) spectroscopy is used to analyze the chemical composition and distribution of pigments in various materials. This technique helps identify functional groups and molecular structures in pigments, allowing for characterization of both organic and inorganic components. FTIR analysis provides valuable information about pigment distribution patterns and can be used for quality control in manufacturing processes.- FTIR spectroscopy for pigment analysis: Fourier Transform Infrared (FTIR) spectroscopy is used to analyze the chemical composition and distribution of pigments in various materials. This technique identifies functional groups in pigments by measuring the absorption of infrared radiation. FTIR can determine pigment concentration, purity, and spatial distribution, making it valuable for quality control in manufacturing processes and authentication of pigmented materials.
- Spectrophotometric methods for pigment quantification: Spectrophotometry enables precise quantification of pigments by measuring light absorption at specific wavelengths. These methods can determine pigment concentration, color intensity, and distribution patterns in various materials. Advanced spectrophotometric techniques allow for non-destructive analysis of pigments, providing valuable data for quality control in industries such as cosmetics, printing, and coatings.
- Imaging techniques for pigment distribution analysis: Advanced imaging techniques combined with spectroscopic methods enable visualization of pigment distribution across surfaces and within materials. These techniques include hyperspectral imaging, confocal microscopy, and digital image analysis. By mapping the spatial distribution of pigments, manufacturers can ensure uniform application and identify inconsistencies in pigment dispersion, which is crucial for quality control in industries such as printing, cosmetics, and coatings.
- Pigment characterization in ink formulations: Spectroscopic methods are employed to characterize pigments in ink formulations, analyzing particle size, dispersion quality, and color properties. FTIR and spectrophotometry help determine how pigments interact with other ink components and substrates. These analytical techniques enable optimization of ink formulations for specific applications, ensuring consistent color reproduction, stability, and performance across different printing conditions.
- Real-time monitoring of pigment distribution: Real-time monitoring systems using spectroscopic techniques allow continuous assessment of pigment distribution during manufacturing processes. These systems integrate FTIR or spectrophotometric sensors with data analysis software to provide immediate feedback on pigment concentration and homogeneity. Real-time monitoring enables rapid detection of inconsistencies in pigment distribution, allowing for immediate process adjustments and reducing waste in production lines.
02 Spectrophotometric methods for quantifying pigment concentration
Spectrophotometric techniques enable precise measurement of pigment concentration and distribution in samples. These methods utilize the absorption or reflection of light at specific wavelengths to quantify pigment content. Advanced spectrophotometric approaches can detect subtle variations in pigment distribution across surfaces or within materials, providing data for both quality assessment and research applications.Expand Specific Solutions03 Combined FTIR and spectrophotometry for comprehensive pigment analysis
The integration of FTIR and spectrophotometric techniques creates powerful analytical systems for comprehensive pigment characterization. This combined approach allows for simultaneous determination of chemical composition, concentration, and spatial distribution of pigments. Such integrated systems provide more complete information about pigment properties and distribution patterns than either technique alone, enabling more accurate material analysis.Expand Specific Solutions04 Imaging techniques for visualizing pigment distribution
Advanced imaging techniques coupled with spectroscopic methods enable visualization of pigment distribution across surfaces and within materials. These approaches include hyperspectral imaging, confocal microscopy, and specialized mapping techniques that generate detailed distribution maps of different pigments. Such visualization methods are valuable for understanding how pigments are dispersed in various substrates and how this affects material properties.Expand Specific Solutions05 Quality control applications for pigment distribution analysis
FTIR and spectrophotometric methods are widely used for quality control in industries where pigment distribution affects product performance. These analytical techniques help ensure consistent color, appearance, and functional properties in manufactured goods. By monitoring pigment distribution during production processes, manufacturers can detect anomalies, adjust formulations, and maintain product quality standards across batches.Expand Specific Solutions
Leading Manufacturers and Research Institutions
The FTIR vs Spectrophotometry market for pigment distribution analysis is in a growth phase, with increasing demand driven by advanced material characterization needs across industries. The global spectroscopy market is expanding at approximately 7-8% CAGR, with the pigment analysis segment representing a significant portion. Technologically, FTIR offers higher chemical specificity while spectrophotometry provides better quantitative analysis capabilities. Leading players demonstrate varying levels of technological maturity: Thermo Electron Scientific Instruments and F. Hoffmann-La Roche have established comprehensive commercial solutions, while Photothermal Spectroscopy Corp is pioneering innovative approaches with their O-Ptir technology. Academic institutions like MIT and McGill University continue advancing fundamental research, while specialized firms like Spectra Analysis Instruments and Nicoya Lifesciences are developing niche applications targeting specific market segments.
Photothermal Spectroscopy Corp.
Technical Solution: Photothermal Spectroscopy Corp. has developed a groundbreaking approach to pigment distribution analysis through their patented Optical Photothermal Infrared (O-PTIR) spectroscopy technology. This innovative method bridges the gap between FTIR and spectrophotometry by combining the chemical specificity of mid-IR spectroscopy with the spatial resolution advantages of visible light microscopy[1]. Their mIRage™ system uses a tunable quantum cascade laser to excite samples, generating photothermal responses that are detected optically, enabling submicron spatial resolution—far beyond conventional FTIR limitations. For pigment distribution assessment, this allows non-contact, non-destructive analysis at resolutions approaching 500nm, critical for heterogeneous samples like art materials or pharmaceutical formulations[3]. The technology overcomes traditional FTIR diffraction limits while maintaining spectral quality comparable to conventional FTIR. Their latest systems incorporate simultaneous Raman spectroscopy capabilities, providing complementary molecular information that enhances pigment identification accuracy in complex matrices.
Strengths: Submicron spatial resolution far exceeding traditional FTIR; non-destructive analysis capability; works with reflective and optically opaque samples that challenge conventional techniques; minimal sample preparation requirements. Weaknesses: Higher initial investment compared to standard spectrophotometry systems; specialized expertise required for data interpretation; limited penetration depth in certain sample types.
Foss Analytical A/S
Technical Solution: Foss Analytical has developed specialized near-infrared (NIR) spectroscopy solutions that complement traditional FTIR approaches for pigment distribution analysis. Their technology focuses on rapid, high-throughput assessment of pigment homogeneity in industrial products and processes. The company's ProFoss™ system enables inline, real-time monitoring of pigment distribution in production environments, utilizing advanced chemometric models to translate spectral data into actionable quality metrics[1]. Their approach combines spectrophotometric principles with multivariate data analysis to overcome traditional limitations in analyzing complex matrices. For laboratory applications, their MeatMaster™ X-ray and NIR combination technology provides three-dimensional mapping of pigment distribution in opaque samples without destructive preparation[4]. Recent innovations include the integration of machine learning algorithms that continuously improve prediction accuracy through adaptive modeling, particularly valuable for processes where pigment distribution specifications may change based on product requirements. The systems incorporate automated calibration procedures that maintain measurement accuracy despite environmental variations in production settings.
Strengths: Exceptional speed and throughput compared to traditional FTIR methods; robust performance in harsh industrial environments; minimal sample preparation requirements; excellent for process control applications. Weaknesses: Lower chemical specificity than mid-IR FTIR techniques; more challenging to differentiate between chemically similar pigments; requires extensive calibration development for new applications.
Key Patents and Innovations in Spectroscopic Techniques
Infra-red spectroscopy system
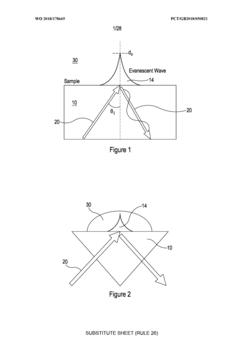
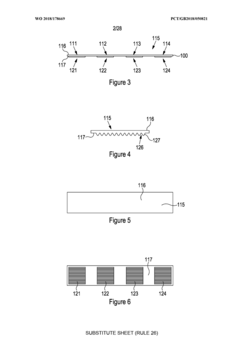
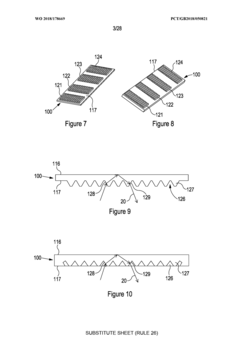
PatentWO2018178669A2
Innovation
- A sample slide with multiple sample-receiving portions and integrated beam-receiving portions acting as internal reflection elements, allowing for multiple measurements without removing and replacing the slide, and the use of a disposable silicon slide to reduce costs and eliminate cleaning and drying requirements.

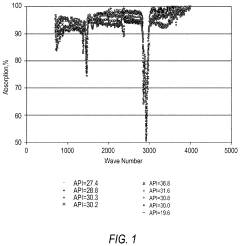
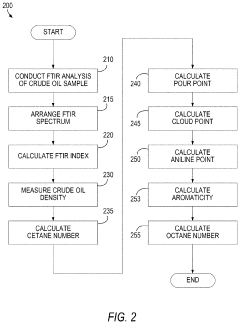
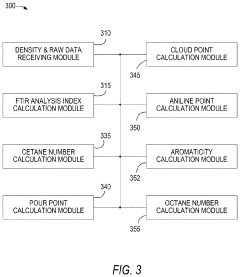
Characterization of crude oil and its fractions by fourier transform infrared (FTIR) spectroscopy analysis
PatentActiveUS20200264156A1
Innovation
- Employing Fourier Transform Infrared Spectroscopy (FTIR) analysis to directly assess the density and FTIR index of crude oil samples, allowing for the prediction of indicative properties without fractionation, using a system that includes an FTIR spectrophotometer and calculation modules to derive properties like cetane number, pour point, and aromaticity.
Standardization and Calibration Protocols
Standardization and calibration protocols are essential for ensuring the reliability, reproducibility, and comparability of results when using FTIR and spectrophotometry for pigment distribution assessment. These protocols establish the foundation for accurate measurements and meaningful data interpretation across different laboratories and research settings.
For FTIR analysis, calibration begins with background spectrum collection to eliminate environmental interference. This process should be performed at regular intervals, typically every 30 minutes during continuous operation, using a clean substrate identical to the sample carrier. Reference materials with known chemical compositions must be analyzed to establish calibration curves for quantitative measurements, with NIST-traceable standards being particularly valuable for cross-laboratory validation.
Spectrophotometric calibration requires similar rigor but focuses on different parameters. Wavelength accuracy verification using holmium oxide or didymium glass filters should be conducted quarterly, while photometric accuracy requires calibration with neutral density filters of certified optical density. Zero and 100% transmittance/reflectance calibrations must be performed before each measurement session to ensure baseline stability.
Sample preparation standardization is equally critical for both techniques. For FTIR, consistent sample thickness (typically 2-5 μm for transmission mode) and homogeneity must be maintained. Spectrophotometry requires standardized sample dilution protocols when working with solutions, or consistent surface preparation for solid samples, with documented procedures for grinding, polishing, and mounting.
Data processing protocols represent another crucial aspect of standardization. For FTIR, baseline correction methods, spectral resolution settings (typically 4 cm⁻¹ for pigment analysis), and number of scans (minimum 32 for adequate signal-to-noise ratio) should be standardized. Spectrophotometric data requires standardized integration times, slit widths, and defined procedures for converting reflectance to absorbance or Kubelka-Munk units when appropriate.
Validation procedures must include regular performance verification using certified reference materials that mimic the matrix of analyzed pigments. Interlaboratory comparison studies should be conducted annually to ensure method transferability and identify systematic biases. Uncertainty budgets must be established for both techniques, accounting for instrument precision, sample preparation variability, and environmental factors.
Documentation requirements complete the standardization framework, with detailed records of calibration dates, reference materials, instrument settings, and operator information. Electronic laboratory notebooks with version control capabilities are increasingly becoming the standard for maintaining this critical information, ensuring traceability and facilitating regulatory compliance in industrial applications.
Environmental Impact and Sustainability Considerations
The environmental impact of analytical techniques has become increasingly important in scientific research and industrial applications. When comparing FTIR (Fourier Transform Infrared Spectroscopy) and Spectrophotometry for pigment distribution assessment, sustainability considerations must be thoroughly evaluated to ensure responsible scientific practice.
FTIR technology generally requires smaller sample sizes compared to traditional spectrophotometric methods, resulting in reduced waste generation during analysis. This advantage becomes particularly significant in conservation science and cultural heritage studies, where minimizing sample extraction from valuable artifacts is paramount. The non-destructive capabilities of modern FTIR systems further enhance their environmental profile by preserving original materials.
Energy consumption patterns differ significantly between these technologies. Spectrophotometers typically operate at room temperature with relatively modest power requirements. In contrast, FTIR systems—especially those utilizing liquid nitrogen-cooled detectors—have higher energy demands. However, recent advancements in FTIR instrumentation have introduced more energy-efficient models with ambient temperature detectors, narrowing this sustainability gap.
Chemical waste management represents another critical environmental consideration. Spectrophotometric analysis often requires sample preparation involving organic solvents and reagents that generate hazardous waste requiring specialized disposal. FTIR techniques generally produce less chemical waste, though certain sample preparation methods may still involve solvents, particularly when analyzing complex pigment matrices.
The longevity and maintenance requirements of analytical equipment also factor into sustainability assessments. Modern FTIR instruments typically offer longer operational lifespans with fewer replacement parts needed over time compared to some spectrophotometric systems. This reduced material turnover contributes to lower environmental impact throughout the equipment lifecycle.
Both technologies present opportunities for green chemistry integration. Recent developments include solvent-free sample preparation techniques and miniaturized versions of both instruments that reduce resource consumption. Portable FTIR systems enable in-situ analysis, eliminating transportation-related environmental impacts associated with laboratory-based testing.
When implementing either technology for pigment distribution assessment, laboratories should consider establishing environmental management systems that track resource consumption, waste generation, and energy usage. Optimization of analytical protocols to minimize environmental footprint without compromising data quality represents an important balance that responsible research facilities must achieve.
The selection between FTIR and spectrophotometry should therefore include environmental impact as a key decision criterion alongside analytical performance, cost considerations, and specific application requirements for pigment distribution assessment.
Unlock deeper insights with Patsnap Eureka Quick Research — get a full tech report to explore trends and direct your research. Try now!
Generate Your Research Report Instantly with AI Agent
Supercharge your innovation with Patsnap Eureka AI Agent Platform!