

How to Visualize Ultrafiltration Flow Dynamics for System Optimization
SEP 22, 202510 MIN READ
Generate Your Research Report Instantly with AI Agent
PatSnap Eureka helps you evaluate technical feasibility & market potential.
Ultrafiltration Visualization Background and Objectives
Ultrafiltration (UF) technology has evolved significantly since its inception in the 1960s, transitioning from laboratory-scale applications to widespread industrial implementation. This membrane-based separation process has become increasingly critical in various sectors including water treatment, bioprocessing, food and beverage production, and pharmaceutical manufacturing. The visualization of ultrafiltration flow dynamics represents a frontier in optimizing these systems, as it enables direct observation and analysis of phenomena that traditionally remained hidden within the "black box" of membrane operations.
The evolution of ultrafiltration visualization techniques has paralleled advancements in imaging technologies and computational capabilities. Early approaches relied primarily on indirect measurements and mathematical modeling, while contemporary methods incorporate advanced imaging techniques such as magnetic resonance imaging (MRI), computational fluid dynamics (CFD), and real-time monitoring systems that provide unprecedented insights into membrane performance and fouling mechanisms.
Current technological trends in this field are moving toward multi-scale visualization approaches that integrate molecular-level interactions with macro-scale flow patterns. This holistic perspective is essential for comprehensive system optimization, as ultrafiltration performance is influenced by phenomena occurring across multiple spatial and temporal scales.
The primary objective of ultrafiltration flow visualization is to develop robust methodologies that can accurately capture and represent the complex hydrodynamic behaviors within membrane systems. These include concentration polarization, cake layer formation, pore blocking, and flow distribution patterns that significantly impact system efficiency and membrane longevity.
Secondary objectives encompass the translation of visualization data into actionable insights for system design and operation. This includes identifying optimal operating parameters, developing predictive maintenance protocols, and creating feedback control systems that can respond dynamically to changing flow conditions.
Long-term goals in this field include the development of standardized visualization protocols that can be implemented across different ultrafiltration applications, enabling comparative analysis and knowledge transfer between industries. Additionally, there is growing interest in creating accessible visualization tools that do not require specialized expertise, thereby democratizing the optimization process for a broader range of users.
The advancement of ultrafiltration visualization techniques is expected to drive significant improvements in system efficiency, reducing energy consumption and operational costs while extending membrane lifespan. Furthermore, enhanced visualization capabilities will facilitate the development of novel membrane materials and module designs specifically tailored to address identified flow dynamics challenges.
Market Demand Analysis for Flow Dynamics Visualization
The ultrafiltration flow dynamics visualization market is experiencing significant growth driven by increasing demands across multiple industries. In the healthcare sector, particularly in dialysis treatment facilities, there is a pressing need for advanced visualization tools to optimize filtration processes, reduce treatment times, and improve patient outcomes. Medical professionals require real-time visualization capabilities to monitor membrane fouling and flow distribution, which directly impacts treatment efficacy and equipment longevity.
In the water treatment industry, municipalities and industrial water treatment facilities are seeking more sophisticated visualization technologies to enhance operational efficiency and reduce maintenance costs. The global water and wastewater treatment market, valued at over $280 billion, is growing at approximately 6.5% annually, with ultrafiltration systems representing a significant segment of this market. Visualization tools that can identify flow irregularities and predict membrane performance are increasingly viewed as essential rather than optional.
Pharmaceutical manufacturing represents another substantial market segment, where ultrafiltration is critical in production processes. Companies are willing to invest in advanced visualization technologies that ensure product quality and regulatory compliance. The biopharmaceutical filtration equipment market alone is expanding at nearly 10% annually, with visualization technologies becoming a key differentiator for equipment providers.
Food and beverage processing industries are also driving demand for ultrafiltration flow visualization tools. As these industries face stricter quality standards and efficiency requirements, the ability to monitor and optimize filtration processes in real-time has become crucial for maintaining competitive advantage and meeting regulatory requirements.
Market research indicates that end-users are particularly interested in visualization solutions that offer integration with existing systems, intuitive interfaces, and actionable insights rather than just raw data. There is strong preference for technologies that can translate complex flow dynamics into easily interpretable visual information that supports decision-making.
The geographical distribution of market demand shows concentration in North America and Europe, where regulatory requirements and higher technology adoption rates drive implementation. However, the fastest growth is occurring in Asia-Pacific regions, particularly China and India, where rapid industrialization and increasing healthcare investments are creating new market opportunities.
Customer surveys reveal willingness to pay premium prices for visualization technologies that demonstrably improve system performance, extend membrane life, and reduce operational costs. The return on investment timeline is a critical factor, with most customers expecting measurable benefits within 12-18 months of implementation.
Current Visualization Technologies and Challenges
Ultrafiltration (UF) visualization technologies have evolved significantly over the past decade, yet substantial challenges remain in effectively capturing and representing flow dynamics. Current visualization approaches can be broadly categorized into experimental methods and computational techniques, each with distinct advantages and limitations.
Experimental visualization methods include direct observation techniques such as particle image velocimetry (PIV), which tracks the movement of tracer particles in the fluid to map velocity fields. While PIV offers high spatial resolution, its application in complex UF membrane systems is limited by optical access constraints and the microscale nature of membrane pores. Fluorescent microscopy techniques have enabled researchers to observe fouling phenomena and concentration polarization at the membrane surface, but these methods typically provide only two-dimensional information and struggle with temporal resolution.
Dye injection methods remain popular for macroscale flow pattern visualization but lack quantitative precision for optimization purposes. More advanced techniques like nuclear magnetic resonance imaging (NMR) and X-ray computed tomography provide non-invasive visualization capabilities but are constrained by high equipment costs and limited accessibility for routine industrial applications.
Computational fluid dynamics (CFD) simulations have become increasingly sophisticated for UF system visualization. Modern CFD tools can model complex geometries and multiphase flows, generating detailed three-dimensional representations of pressure distributions, velocity profiles, and concentration gradients. However, these models often rely on simplifying assumptions regarding membrane properties and fouling behaviors that may not accurately reflect real-world conditions.
A significant challenge in current visualization technologies is the integration of multi-scale phenomena. UF processes involve interactions spanning from nanometer-scale membrane pore dynamics to meter-scale system hydraulics. No single visualization technique effectively bridges these scales, necessitating composite approaches that are difficult to implement and interpret.
Real-time visualization capabilities remain limited, with most current technologies providing either high temporal resolution with low spatial detail or vice versa. This temporal-spatial trade-off restricts the ability to observe transient phenomena crucial for system optimization, such as the initial stages of fouling or the effects of backwashing procedures.
Data interpretation presents another substantial challenge. The massive datasets generated by advanced visualization techniques require sophisticated analysis algorithms and expertise to extract actionable insights. Many facilities lack the specialized knowledge to translate visual data into optimization strategies, creating a gap between visualization capabilities and practical implementation.
Standardization issues further complicate the field, with various visualization methodologies producing results that are difficult to compare across different studies or systems. This fragmentation hinders the establishment of universal optimization principles based on visualization findings.
Current Flow Dynamics Visualization Solutions
01 Visualization techniques for ultrafiltration flow dynamics
Various visualization techniques are employed to observe and analyze flow dynamics in ultrafiltration processes. These techniques include advanced imaging methods that allow researchers to visualize fluid movement, particle distribution, and membrane interactions in real-time. The visualization helps in understanding concentration polarization, fouling mechanisms, and flow patterns that affect filtration efficiency.- Visualization techniques for ultrafiltration flow dynamics: Various visualization techniques are employed to observe and analyze flow dynamics in ultrafiltration systems. These techniques include advanced imaging methods that capture real-time flow patterns, particle tracking systems, and specialized software that renders flow behavior visually. These visualization approaches help researchers and engineers understand membrane fouling mechanisms, optimize filtration efficiency, and identify flow irregularities in ultrafiltration processes.
- Computational modeling of ultrafiltration flow dynamics: Computational fluid dynamics (CFD) models are developed to simulate and predict flow behavior in ultrafiltration systems. These models incorporate various parameters such as pressure gradients, membrane properties, and fluid characteristics to create accurate representations of flow dynamics. The computational approaches enable optimization of membrane module design, prediction of concentration polarization, and analysis of shear stress distribution, ultimately improving ultrafiltration system performance.
- Real-time monitoring systems for ultrafiltration flow: Real-time monitoring systems are implemented to continuously track flow dynamics in ultrafiltration processes. These systems utilize sensors, flow meters, and pressure transducers to collect data on flow rates, pressure differentials, and other critical parameters. The collected data is processed and displayed through user interfaces that provide immediate feedback on system performance, allowing for prompt adjustments to optimize filtration efficiency and prevent membrane fouling.
- Flow pattern analysis in membrane modules: Specialized techniques are developed for analyzing flow patterns within ultrafiltration membrane modules. These methods focus on understanding how fluid flows through different module configurations, including hollow fiber, spiral wound, and flat sheet membranes. The analysis reveals dead zones, preferential flow paths, and turbulence patterns that affect filtration performance. This knowledge guides the design of improved module geometries that enhance mass transfer, reduce concentration polarization, and extend membrane life.
- Advanced visualization interfaces for ultrafiltration systems: Advanced user interfaces are created to present ultrafiltration flow dynamics data in intuitive and interactive formats. These interfaces incorporate 3D visualization, augmented reality, and interactive dashboards that allow operators to explore flow data from multiple perspectives. The visualization tools help in identifying patterns, anomalies, and correlations in flow behavior, supporting better decision-making in process control and system optimization for ultrafiltration applications.
02 Computational modeling of ultrafiltration processes
Computational fluid dynamics (CFD) and other numerical modeling approaches are used to simulate and predict flow behavior in ultrafiltration systems. These models help in optimizing membrane module design, predicting pressure drops, and understanding flow distribution across membrane surfaces. The computational approaches enable visualization of flow patterns that would be difficult to observe experimentally.Expand Specific Solutions03 Real-time monitoring systems for ultrafiltration flow
Real-time monitoring systems are developed to continuously track and visualize flow dynamics during ultrafiltration operations. These systems incorporate sensors, data acquisition tools, and visualization interfaces that allow operators to observe flow rates, pressure distributions, and membrane performance. The real-time visualization helps in detecting anomalies and optimizing process parameters during operation.Expand Specific Solutions04 3D visualization and virtual reality applications
Three-dimensional visualization techniques and virtual reality applications are being utilized to create immersive representations of ultrafiltration flow dynamics. These advanced visualization methods provide comprehensive views of complex flow patterns and enable researchers to interact with the data in intuitive ways. The 3D visualizations help in identifying flow irregularities and optimizing membrane module configurations.Expand Specific Solutions05 Flow dynamics analysis for membrane fouling prevention
Visualization of flow dynamics is specifically applied to understand and prevent membrane fouling in ultrafiltration processes. By visualizing the flow patterns near membrane surfaces, researchers can identify conditions that lead to fouling and develop strategies to mitigate it. These visualization techniques help in designing improved flow distributors, optimizing cross-flow velocities, and implementing effective cleaning protocols.Expand Specific Solutions
Key Industry Players in Ultrafiltration Visualization
Ultrafiltration flow dynamics visualization is currently in a growth phase, with the market expanding due to increasing applications in healthcare, water treatment, and industrial processes. The global market is estimated to reach $5-7 billion by 2027, growing at 7-9% CAGR. Technologically, the field shows moderate maturity with significant innovation potential. Leading players include Koninklijke Philips and Siemens Healthineers, who focus on medical applications with advanced imaging technologies; Gambro Lundia specializing in dialysis systems; and 3M Innovative Properties developing membrane technologies. Academic institutions like Tianjin University and Tongji University contribute fundamental research, while industrial players such as Halliburton and ExxonMobil adapt these technologies for energy applications. The convergence of AI, computational fluid dynamics, and sensor technologies is driving the next wave of advancement.
Koninklijke Philips NV
Technical Solution: Philips has developed advanced ultrafiltration visualization systems that integrate real-time computational fluid dynamics (CFD) with high-resolution imaging technologies. Their approach combines multi-modal imaging sensors with proprietary algorithms to create dynamic 3D representations of fluid flow patterns within filtration membranes. The system employs contrast-enhanced ultrasound technology that can detect microbubbles as flow tracers, allowing for non-invasive monitoring of flow distribution across membrane surfaces. Philips' solution incorporates machine learning algorithms that analyze flow patterns to predict membrane fouling before it becomes critical, enabling preventive maintenance protocols. The visualization platform features a user-friendly interface that displays key performance metrics including transmembrane pressure, flux distribution, and localized flow velocities, providing operators with actionable insights for system optimization.
Strengths: Superior integration with existing medical imaging infrastructure, exceptional image resolution, and advanced predictive analytics for membrane fouling. Weaknesses: Higher implementation costs compared to conventional monitoring systems and requires specialized training for operators to fully utilize the advanced features.
Gambro Lundia AB
Technical Solution: Gambro Lundia has pioneered a comprehensive ultrafiltration visualization platform specifically designed for renal replacement therapy systems. Their technology utilizes optical coherence tomography (OCT) combined with Doppler flow measurement to create detailed maps of fluid dynamics within hollow fiber dialyzers. The system captures real-time data on flow distribution, boundary layer formation, and protein deposition patterns across membrane surfaces. Gambro's proprietary software processes this information to generate color-coded visualization maps that highlight areas of suboptimal flow, allowing for immediate intervention. The technology incorporates pressure sensors at multiple points in the filtration circuit, correlating pressure differentials with flow visualization to provide a complete picture of system performance. Their latest innovation includes integration with dialysis machine control systems, enabling automated adjustments to flow parameters based on visualization feedback, creating a closed-loop optimization system for maintaining optimal filtration efficiency throughout treatment sessions.
Strengths: Highly specialized for medical dialysis applications with exceptional sensitivity for detecting early-stage membrane fouling and flow irregularities. Weaknesses: Limited application outside of medical dialysis settings and requires integration with Gambro's proprietary dialysis equipment for full functionality.
Core Visualization Technologies and Patents
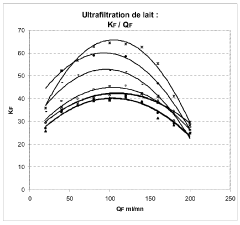
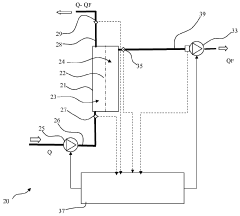
Filtration apparatus and method for monitoring such an apparatus
PatentWO2011083245A1
Innovation
- A method to manage filtration devices by determining the instantaneous filtration coefficient and comparing it to characteristic values, adjusting the filtration rate to reach the maximum coefficient, thereby optimizing the operation and efficiency of the filtration process.
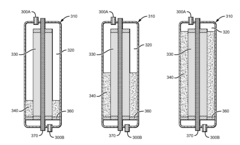
Filter With Captured Membrane
PatentInactiveUS20140339150A1
Innovation
- Occupying the gap volume between the filter assembly and housing with a fluid-impermeable filler material, such as an epoxy polymer, to prevent distortion and contamination, while ensuring a robust seal and increased filtration rates.
Computational Fluid Dynamics Integration Approaches
Computational Fluid Dynamics (CFD) has emerged as a powerful tool for visualizing and optimizing ultrafiltration flow dynamics. The integration of CFD into ultrafiltration system design enables engineers to model complex fluid behaviors that would be difficult to observe through physical experimentation alone.
Modern CFD software packages such as ANSYS Fluent, COMSOL Multiphysics, and OpenFOAM offer specialized modules for membrane filtration processes. These tools can simulate multiphase flows, concentration polarization, and fouling phenomena that are critical to understanding ultrafiltration performance. The integration approach typically begins with creating accurate geometric models of membrane modules, followed by mesh generation that captures boundary layers near membrane surfaces.
For ultrafiltration systems specifically, CFD integration requires careful consideration of the porous media models. The Darcy-Brinkman-Forchheimer equations are commonly implemented to account for flow through porous membranes with varying permeability. This mathematical framework allows for the simulation of transmembrane pressure distributions and local flux variations across the membrane surface.
Real-time data integration represents an advanced approach where operational data from ultrafiltration systems is fed into CFD models for continuous calibration. This creates a digital twin of the filtration system that evolves with the physical system's changing conditions. Sensors measuring pressure drops, flow rates, and permeate quality provide inputs that refine the computational models, improving their predictive accuracy over time.
Machine learning algorithms are increasingly being coupled with CFD simulations to enhance ultrafiltration visualization capabilities. These hybrid models can identify patterns in flow dynamics that might indicate impending fouling or system inefficiencies. Neural networks trained on CFD-generated datasets can predict system behavior under various operating conditions, enabling proactive optimization strategies.
Multi-scale modeling approaches bridge the gap between molecular-level membrane interactions and system-level flow dynamics. By integrating models that operate at different spatial and temporal scales, engineers can visualize how microscopic membrane properties influence macroscopic filtration performance. This comprehensive view facilitates targeted improvements in membrane design and module configuration.
The computational requirements for these integrated approaches remain significant, often necessitating high-performance computing resources. Cloud-based CFD platforms have emerged as a solution, offering scalable computing power for complex ultrafiltration simulations without requiring extensive on-premises infrastructure.
Real-time Monitoring and Control Systems
Real-time monitoring and control systems represent a critical advancement in ultrafiltration technology, enabling operators to visualize flow dynamics and optimize system performance with unprecedented precision. These systems integrate sensors, data acquisition hardware, and specialized software to provide continuous feedback on key operational parameters including transmembrane pressure, flux rates, and membrane fouling indicators.
Modern ultrafiltration monitoring systems employ multiple sensor types strategically positioned throughout the filtration train. Pressure transducers measure differential pressures across membrane modules, while flow meters track filtrate production rates and feed velocities. Advanced systems also incorporate turbidity meters, conductivity sensors, and specialized fouling detection instruments that can identify early warning signs of membrane performance degradation.
Data acquisition systems collect these measurements at high sampling frequencies, typically ranging from 1-10 Hz, ensuring that even rapid fluctuations in flow dynamics are captured. This temporal resolution is essential for detecting transient phenomena such as pressure pulses or flow instabilities that may indicate developing problems within the system.
Visualization software transforms this raw data into intuitive graphical representations that operators can readily interpret. Modern interfaces feature color-coded flow path diagrams, real-time trend graphs, and 3D visualization tools that illustrate pressure gradients and flow patterns across membrane modules. Some advanced platforms incorporate augmented reality elements, allowing maintenance personnel to visualize internal flow dynamics while physically inspecting equipment.
Control algorithms process monitoring data to automatically adjust operational parameters for optimal performance. These systems implement sophisticated feedback loops that can modify feed rates, backwash cycles, and chemical dosing in response to changing conditions. Machine learning capabilities enable predictive control strategies that anticipate fouling events before they significantly impact performance, initiating preventive measures to maintain efficiency.
Cloud connectivity has further enhanced these systems by enabling remote monitoring and control capabilities. Operations teams can access visualization tools from mobile devices, allowing for rapid response to alerts even when personnel are not physically present at the facility. This connectivity also facilitates data aggregation across multiple facilities, enabling comparative analysis and identification of best practices for system optimization.
The integration of digital twin technology represents the cutting edge of ultrafiltration visualization. These virtual replicas simulate physical systems with high fidelity, allowing operators to test optimization strategies in a risk-free virtual environment before implementing changes to actual operations. This approach significantly reduces the trial-and-error typically associated with process optimization.
Unlock deeper insights with PatSnap Eureka Quick Research — get a full tech report to explore trends and direct your research. Try now!
Generate Your Research Report Instantly with AI Agent
Supercharge your innovation with PatSnap Eureka AI Agent Platform!