Method of presenting predictive data of financial securities

a financial security and predictive data technology, applied in the field of financial instruments trading, can solve the problems of stock market severe economic downturn, loss of a large share of value, requiring years and sometimes decades to recover, and value stocks are performing poorly

Inactive Publication Date: 2009-03-05
CONNORS RES +1
View PDF6 Cites 38 Cited by
  • Summary
  • Abstract
  • Description
  • Claims
  • Application Information

AI Technical Summary

Problems solved by technology

One drawback associated with the buy-and-hold approach is that the holder of the stock must exercise a tremendous amount of patience and discipline over many years and sometimes through bear markets.
A further drawback associated with the buy-and-hold approach is that the stock market may suffer a severe economic downturn losing a large share of its value and requiring years and sometimes decades to recover.
Some of the reasons supporting the belief that such value stocks are performing poorly include bad press and poor earnings.
However, the ability for day traders to profit is considered by some to be more difficult due to certain changes in the trading environment.
Furthermore, short-term traders or day traders must typically execute a large number of transactions as compared to investors using the buy-and-hold approach.
Although trading can be a stimulating and financially rewarding activity, the volume of trading and the capital investment required can make day trading intimidating to many people.
While a certain amount of study and research is required before investing in any particular market or financial security (e.g., stocks), most investors have a limited amount of time to devote to research.
As mentioned above, because of the high level of discipline required and the need to act quickly, trading can be intimidating.
Traders risk losing large amounts of money by acting on impulse or emotion such as fear or panic instead of making rationalized trading decisions based on objective data.
Particularly for beginning traders, the lack of knowledge or experience with typical market patterns only increases the intimidation factor.

Method used


Image

  • Method of presenting predictive  data of financial securities
  • Method of presenting predictive  data of financial securities
  • Method of presenting predictive  data of financial securities

Examples


Embodiment Construction

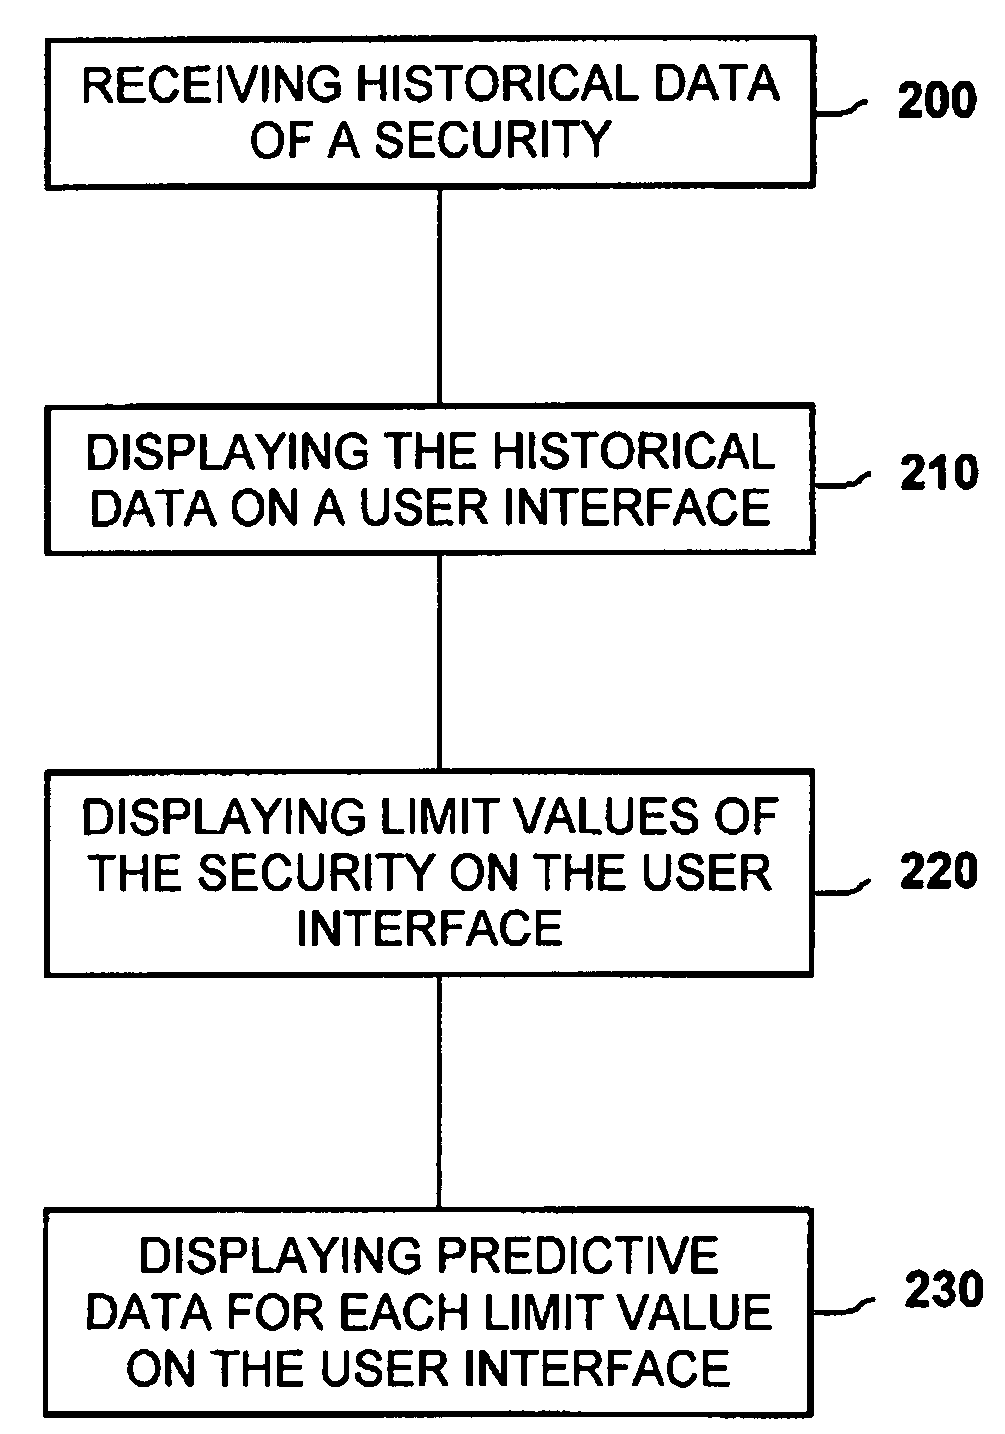
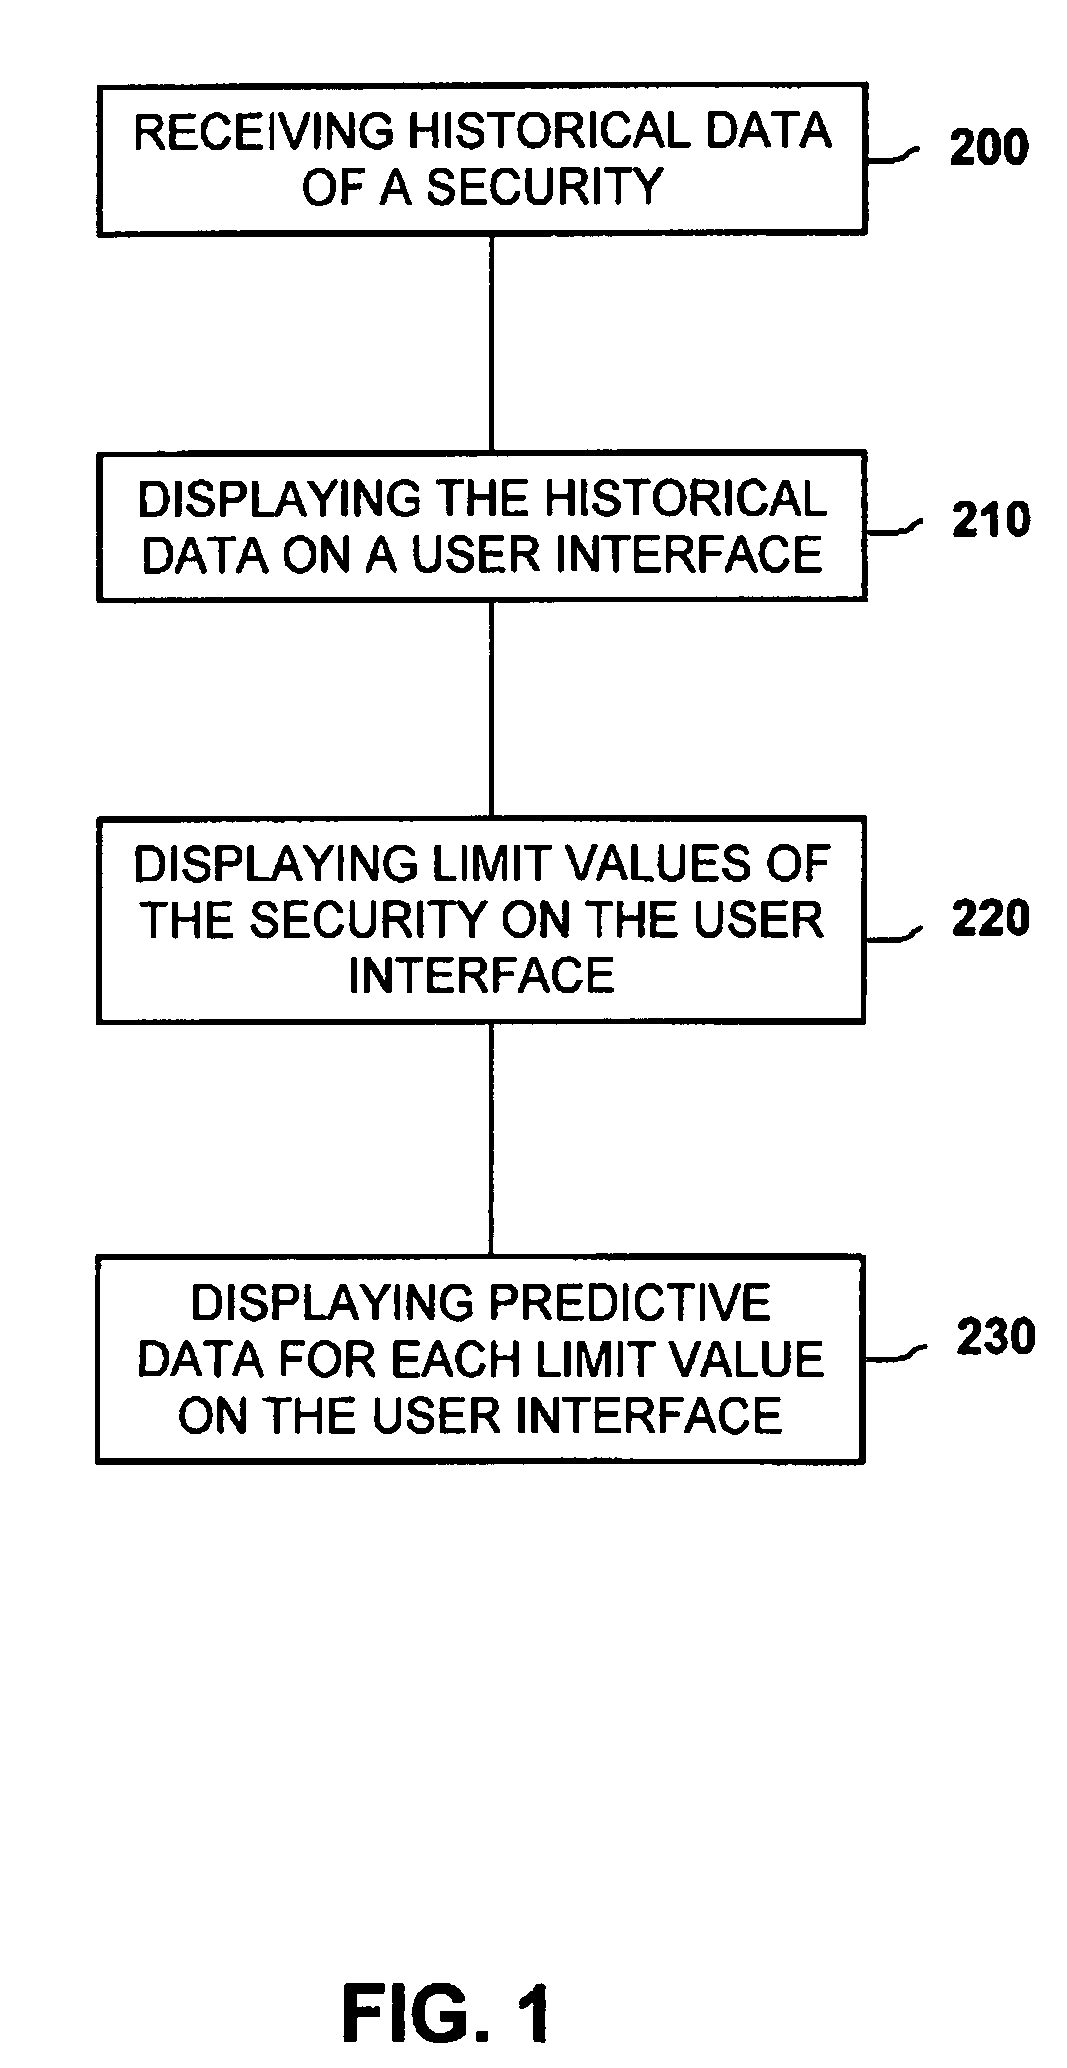
[0035]Referring now to the drawings wherein the showings are for purposes of illustrating preferred embodiments of the present invention only and not for purposes of limiting the same, FIG. 1 is a flow chart illustrating implementation of a method of presenting predictive data 44 of a security such as a stock wherein such predictive data 44 is based upon historical data 36. The predictive data 44 is preferably presented on a display window 12 of a graphical user interface 10 (GUI) to allow a user such as an individual trader or an institutional trader of financial instruments to observe the predictive data 44 as an aid in making trading decisions. In the present invention, the predictive data 44 includes an edge 46 which may be expressed as an increase or a decrease in the value of the security and which is predicted to occur at the end of a hold period 42. The hold period 42 may be measured in any suitable time unit such as in units of days although other time units may be used.

[00...


PUM


Abstract

A method of presenting past, present, and predictive data of a stock comprises the steps of displaying historical data of the stock on a user interface and displaying the current price of the stock on the user interface. The method further includes displaying limit prices of the stock including incrementally greater and lesser values expressed as a percentage of the target price of the stock. The method further includes displaying predictive data for the current price wherein the predictive data includes an edge expressed as an increase or decrease in the current price predicted to occur at the end of a hold period. The predictive data further includes a numerical expression of the probability that the predicted edge will occur at the end of the hold period.

Description

CROSS-REFERENCE TO RELATED APPLICATIONS[0001](Not Applicable)STATEMENT RE: FEDERALLY SPONSORED RESEARCH / DEVELOPMENT[0002](Not Applicable)BACKGROUND[0003]The present invention relates generally to the trading of financial instruments and, more particularly, to a method of presenting predictive data such as predicted changes in the price of a stock or other security as a means for profiting from trading (i.e., buying and selling) of the security.[0004]Included in the prior art are a wide range of techniques and systems for trading various types of financial instruments and securities such as, stocks, bonds, currencies, options, futures, and derivatives. One of the more conservative trading techniques is the “buy-and-hold” technique which is a long term trading approach. The buy-and-hold technique requires buying a security, typically a stock, and holding the stock for many years in the hopes that over the long term, the price will rise and the stock can eventually be sold for a profit...

Claims


Application Information

Patent Timeline
Patent Type & Authority Applications(United States)
IPC IPC(8): G06Q40/00
CPCG06Q40/06G06Q40/04
Inventor CONNORS, LAURENCE A.
Owner CONNORS RES
Why Eureka
Try Eureka