Method for statistical visualization of client service events

Inactive Publication Date: 2011-12-22
ALEXANDRE ZOLOTOVITSKI
View PDF11 Cites 14 Cited by
  • Summary
  • Abstract
  • Description
  • Claims
  • Application Information

AI Technical Summary

Benefits of technology

[0007]This new method is applicable for any customer service—help desks, stores, doctor offices

Problems solved by technology

Existed methods of visualization (the most popular of them are MS Excel pivot charts) could not

Method used


Image

  • Method for statistical visualization of client service events
  • Method for statistical visualization of client service events
  • Method for statistical visualization of client service events

Examples


Embodiment Construction

1. Introduction

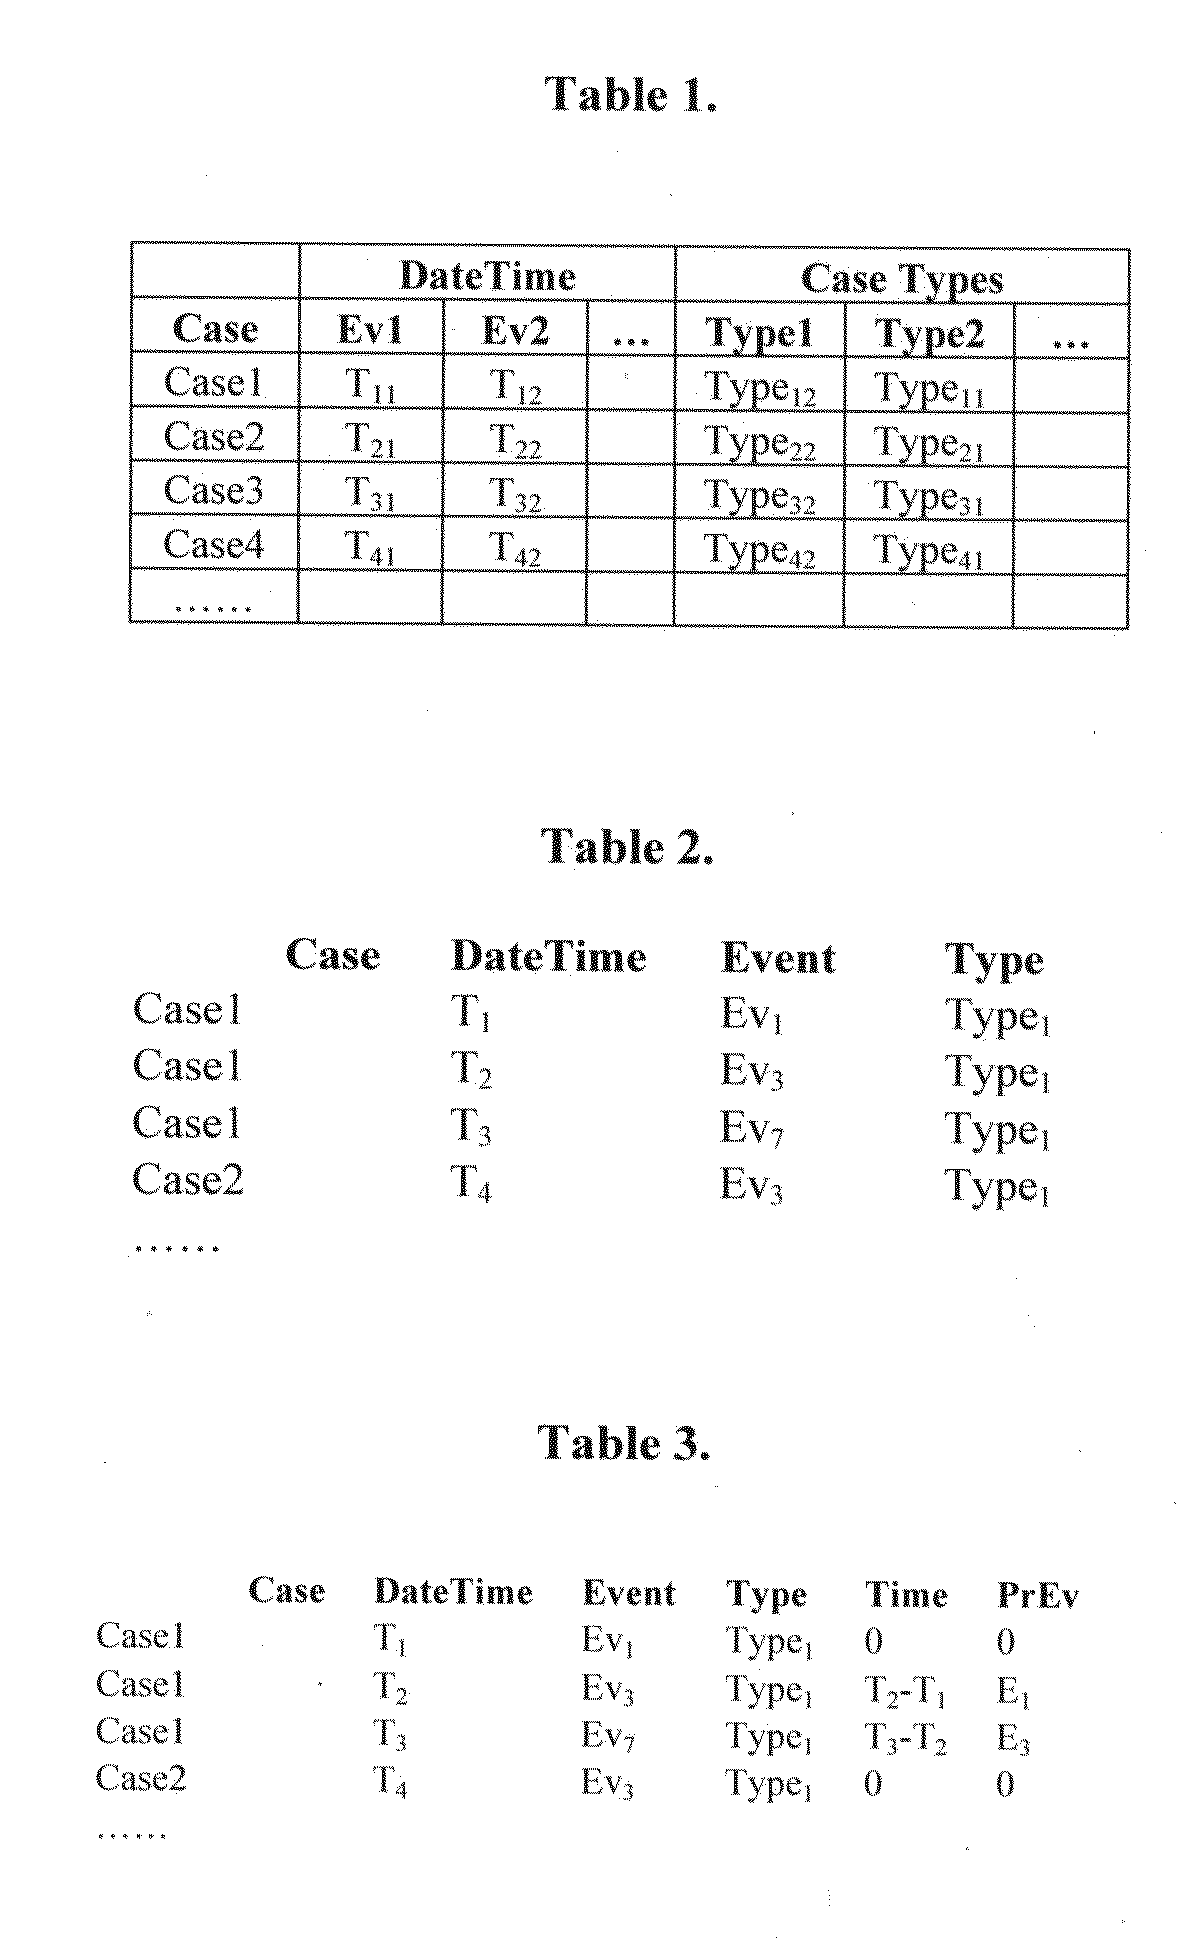
[0026]Improving performance of interaction with customers (“customer service”) is important business task of CRM for every business. In this work we have deal with the problem of visualization for Client service events to optimize work of client service. In order to do it we have to visualize business important characteristics related to customer service. The raw data related to customer service usually has form: see Table 1.

[0027]In our example of technical service center events were service cases, so variable Case was the foreign key identifying service case; the following columns are for. DateTime stamps for service events Ev1, Ev2, . . . that could be Creation—Received—Contact_SW—Contact_HW—Pending—Closed.

[0028]The Type columns could contain such variables as HW_Platform, Product, Geographic variables, Customer, Case_Owner and can be used for the Classification of cases. For simplicity we will show only one Type variable.

[0029]The same type of visualization can be...


PUM


Abstract

For every business interaction with customers consists of cases and each case consists of sequence of events: First_Contact_Customer, . . . intermediate events, . . . Case_Closed. The most important characteristics are frequencies of transitions between events and mean time between events (MTBE, TBE) for each type of cases. Type of cases could be type of customer, group of products, branch of enterprise, geographical area, etc. Existed methods of visualization (the most popular of them are MS Excel pivot charts) could not visualize two characteristics (Frequency and MTBE) simultaneously to locate business problems.
Our method combines standard SPC run chart for time series representation with three new types of charts for cross-sectional representation: “matrix bar chart” for portraying types of cases, “flower bed chart” for displaying Frequencies and MTBE. and “Tower Chart” that can be element of “Flower Bed Chart” and “Matrix Bar Chart” when we need detailed visualization of distribution of TBE.
This new method is applicable for any customer service—help desks, stores, doctor offices, banks and gives the user ability to identify immediately the most business important factors

Description

CROSS-REFERENCE TO RELATED APPLICATIONS[0001]Not ApplicableSTATEMENT REGARDING FEDERALLY SPONSORED RESEARCH OR DEVELOPMENT[0002]Not ApplicableREFERENCE TO AN APPENDIX[0003]Not ApplicableBACKGROUNDField of Technology[0004]The present invention relates generally to topical analysis of data presenting client service events in the field of Data processing: Visualization, Data Mining, Statistical process control (SPC), Performance monitoring, Operations research, Customer service.BRIEF SUMMARY[0005]For every business interaction with customers consists of cases and each case consists of sequence of events: First_Contact_Customer, . . . intermediate events, . . . Case_Closed. The most important characteristics are frequencies of transitions between events and mean time between events (MTBE, TBE) for each type of cases. Type of cases could be type of customer, group of products, branch of enterprise, geographical area, etc. Existed methods of visualization (the most popular of them are MS ...

Claims


Application Information

Patent Timeline
IPC IPC(8): G06T11/20G09G5/02
CPCG06T11/206
Inventor ZOLOTOVITSKI, ALEXANDRE
Owner ALEXANDRE ZOLOTOVITSKI
Why Eureka
Try Eureka