Method and apparatus for organizing, visualizing and using measured or modeled system statistics

a system statistics and data technology, applied in the field of software to organize and display performance data, can solve problems such as low business application performance, system over-stress, and inability to meet business requirements,

Inactive Publication Date: 2009-09-29
HYPERFORMIX
View PDF59 Cites 6 Cited by
  • Summary
  • Abstract
  • Description
  • Claims
  • Application Information

AI Technical Summary

Benefits of technology

[0012]The present invention teaches processes and apparatus to acquire and organize measured or modeled statistical data into optimal reports. In a design mode of use, a report designer utilizes the apparatus as a tool to create optimal reports from a variety of data sources, translating the reports into templates that can be reused to automate a reporting process to repeatedly solve a class of user defined problems. In a performance engineering mode of use, a performance engineer utilizes a process enabled by the apparatus whereby the engineer may select from a set of performance questions, connect the apparatus to a variety data sources, and through an interaction process enabled and guided by the apparatus and largely automated, create well-defined answers to the performance questions of interest. The performance engineer, may create templates or projects that capture the process and allow it to be repeated in a continual process to make network or system optimizations.
[0014]Another embodiment of the invention teaches manipulation and use of data within data Tables for the automatic selection and population of other data tables. In particular, column selection and column header information is optimized for relevance to the report design or system question at hand. A novel mechanism for automatically joining data from a variety of data sources is also described that allows for the rapid construction of specific reports from within multiple data tables of different types, structures and formats.

Problems solved by technology

Reliability and performance can be a considerable issue in the face of rapid system or application scaling such as would be experienced in a merger of two large corporations or in an onset of an IT outsourcing contract.
In other situations, a system may be overly stressed, with such low business application performance that the situation is detrimental to the function of the corporation.
Even more complex reports are generated by test3 tests that look at resource usage and scaling in a mixed environment.

Method used


Image

  • Method and apparatus for organizing, visualizing and using measured or modeled system statistics
  • Method and apparatus for organizing, visualizing and using measured or modeled system statistics
  • Method and apparatus for organizing, visualizing and using measured or modeled system statistics

Examples


Embodiment Construction

[0034]While the making and using of various embodiments of the present invention are discussed in detail below, it should be appreciated that the present invention provides many applicable inventive concepts that can be embodied in a wide variety of specific contexts. The specific embodiments described herein are merely illustrative of specific ways to make and use the invention and do not delimit the scope of the invention.

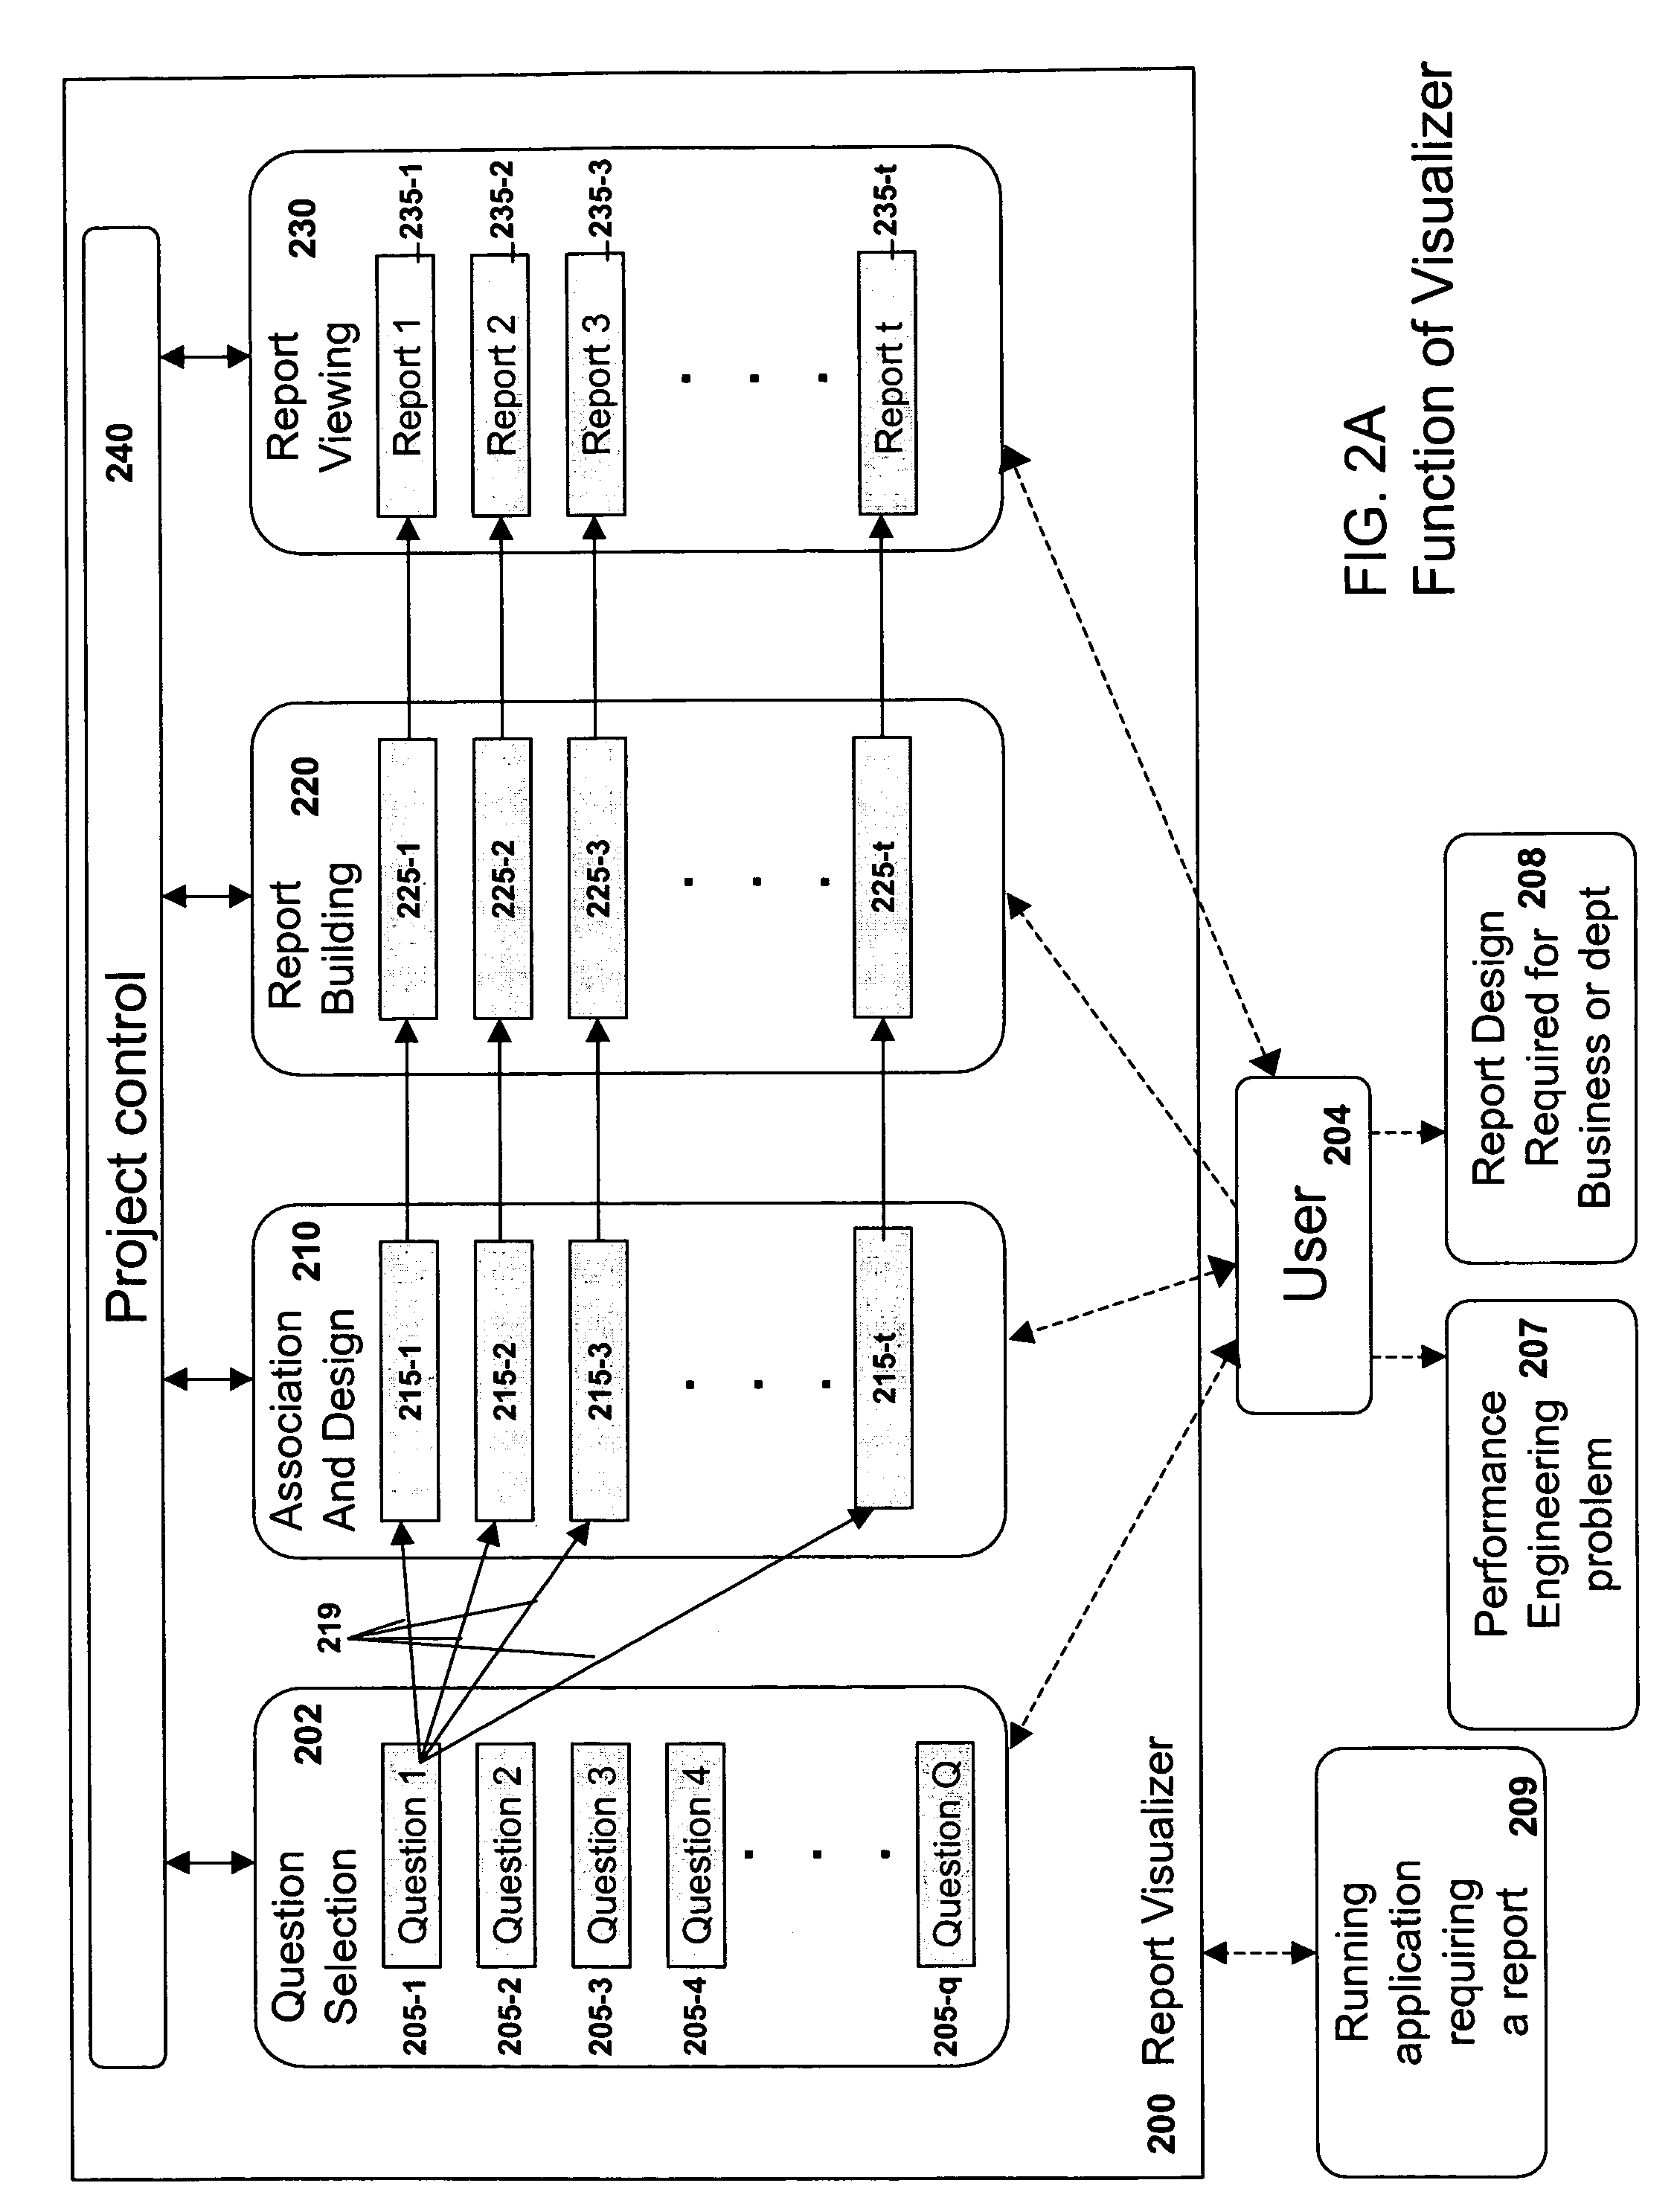
[0035]In FIG. 2A a report visualizer program 200, which constructs complex reports for a user 204, provides the following functions: A question selections process 202 for aiding user 204 in selecting a question from a list of questions to be answered by a report, a report design process 210 for gathering information and populating report designs from user 204, a report building process 220 for automatically gathering data into reports and preparing them for viewing, a report viewing process 230 for presenting reports visually to user 204 and a project control pro...


PUM


Abstract

An apparatus and methodology to acquire and organize measured or modeled statistical data into optimal reports with a performance engineering mode of use and a design mode of use. In a performance engineering mode of use, the engineer may select from a set of performance questions, and guided by the apparatus and largely automated, create well-defined answers to the performance questions of interest. A series of template manipulations whereby report objects that are embedded within templates may be defined, reused, modified and improved upon to optimize reports and to aid in a report building process in a design mode of use. Methods are taught for the automatic selection and population of data tables. Column selection and column header information is optimized for relevance to the report design or system question at hand. The automatic joining of data from a variety of data sources is taught that allows for the rapid construction of specific reports from within multiple data tables of different types, structures and formats.

Description

CROSS-REFERENCE TO RELATED APPLICATIONS[0001]This application claims priority to U.S. Provisional Application No. 60 / 579,456, entitled “Method and Apparatus for Acquiring and Organizing Simulation Statistics,” filed Jun. 14, 2004; U.S. Provisional Application No. 60 / 579,306, entitled “Method and Apparatus for Translating Objects Into Templates,” filed Jun. 14, 2004; U.S. Provisional Application No. 60 / 579,305, entitled “Method and Apparatus for Automatic Selection of Data and Table Population,” filed Jun. 14, 2004; and U.S. Provisional Application No. 60 / 579,329, entitled “Method and Apparatus for Joining Data and Building Tables,” filed Jun. 14, 2004.TECHNICAL FIELD OF THE INVENTION[0002]The technical field of this invention is software, namely, software to organize and display performance data from complex computer networks.BACKGROUND OF THE INVENTION[0003]The performance of business systems in the global economy is an area of considerable interest as businesses become more disper...

Claims


Application Information

Patent Timeline
Patent Type & Authority Patents(United States)
IPC IPC(8): G06F7/00
CPCG06F17/30554G06Q10/10G06Q10/0639G06F16/248Y10S707/99933
Inventor MATCHETT, DOUGLAS K.PALMER, ANNETTE S.WISE, TIMOTHY E.LEHR, TED
Owner HYPERFORMIX
Why Eureka
Try Eureka