
Method and report assessing consumer reaction to a stimulus by matching eye position with facial coding
a technology of eye position and facial coding, applied in the field of measuring consumer reaction to business stimuli, can solve the problems of not providing actionable insight, limit that people may provide a knowingly false assessment to appease the interviewer, and practitioners of eye tracking have not been able to report back to their clients how the test subjects are feeling
- Summary
- Abstract
- Description
- Claims
- Application Information
AI Technical Summary
Problems solved by technology
Method used
Image

Examples
example 1
Eye Fixation Raw Data
[0155]A participant was exposed to a stimuli depicted on a computer monitor set at a screen resolution of 1024×768. The eye movements were captured using a Tobii Model 1750 Eye Tracker. Minimum duration of fixation was set at 50 milliseconds. The time, duration and location of detected fixations are reported in TABLE SIX below.
[0156]
TABLE SIXELAPSEDPIXELTIMEDURATIONLOCATIONFIXATION #(milliseconds)(milliseconds)XY16710048931022861002963603964604903244134380486328527396040427762858100402273731178050844784593100517345952706048438110539010048437711600812047039112626760500341137065605183851472448051638715780260428270168121605723941784001005733951888196043626619901980606352209317804332842195178043528122971680438287231039410052828124107336052428825108538052329026110528056729127115308054832128116301005753252911850805743243012049805533803112687805183493213644120428337331406212033238234144211793713653515378605943203615797604833413716176605123453816335805153503916475605093...
example 2
Eye Fixation Map
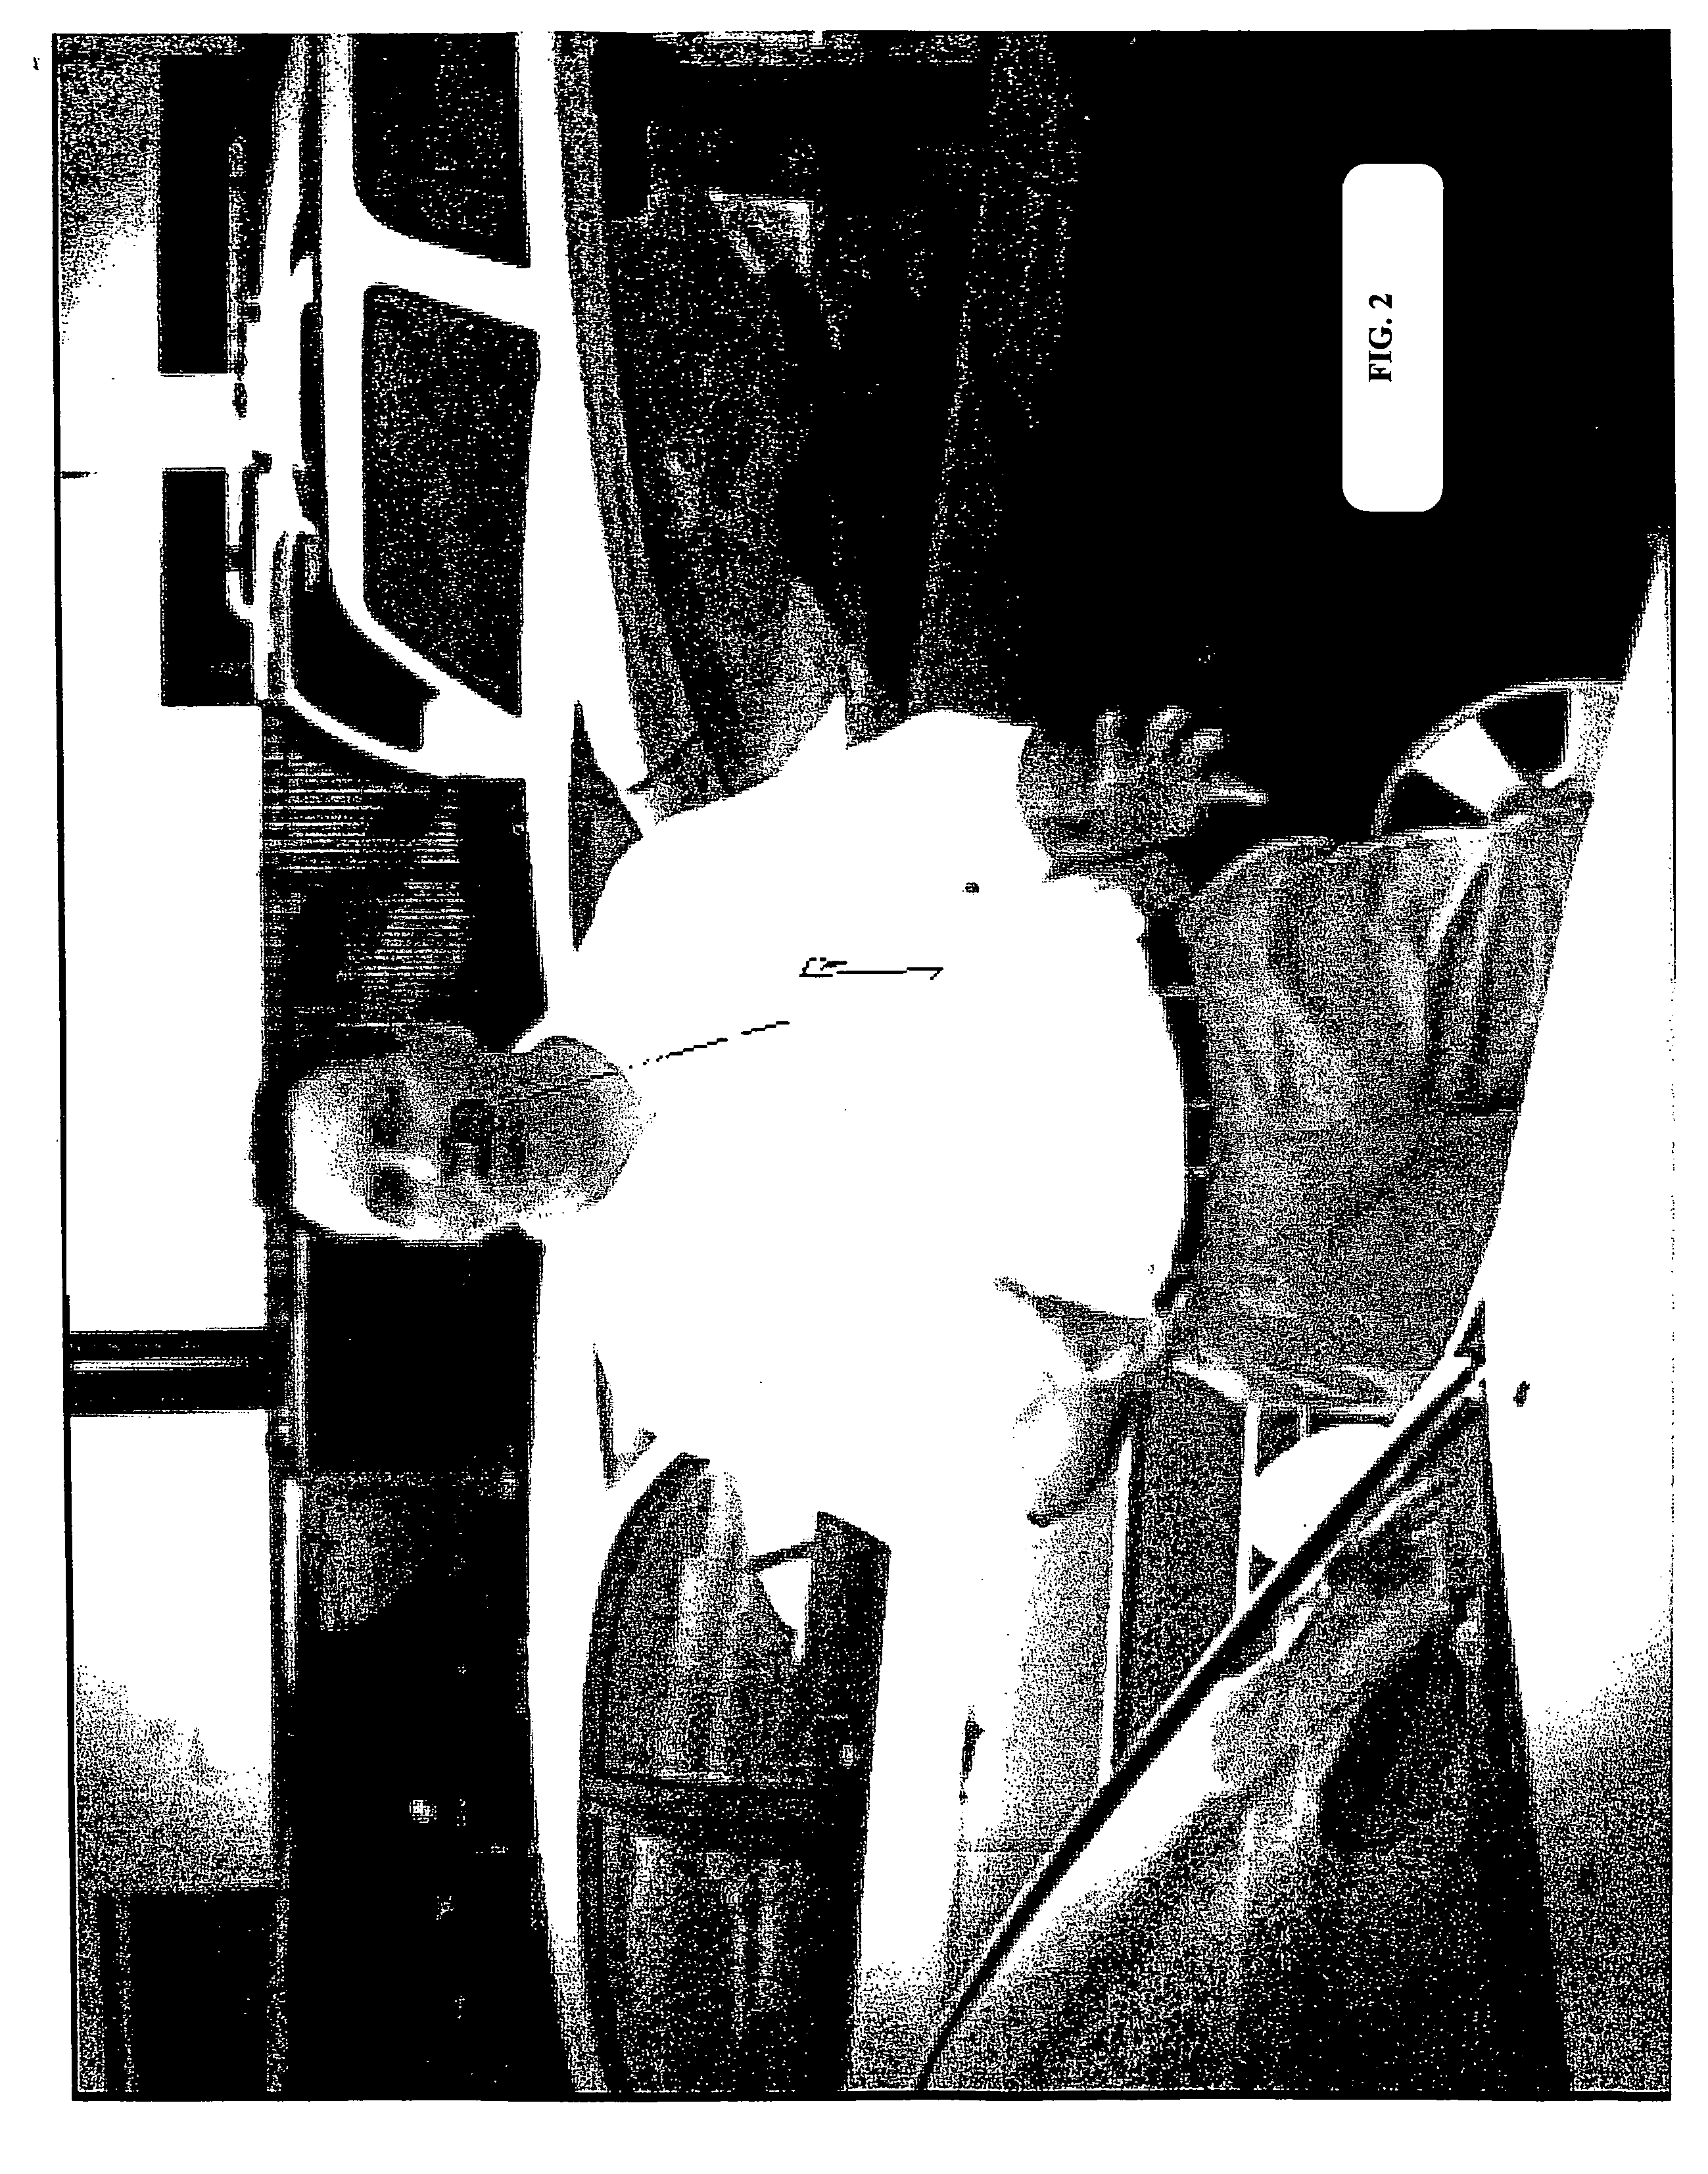
[0157]A participant was exposed to a stimuli depicted on a computer monitor. The eye movements were captured using a Tobii Model 1750 Eye Tracker. Minimum duration of fixation was set at 50 milliseconds. The initial saccade and first detected fixation point are shown in FIG. 2 as a gray line and gray dot respectively, superimposed on the stimuli.
example 3
Report with Eye Fixation Spots Map and Emotions
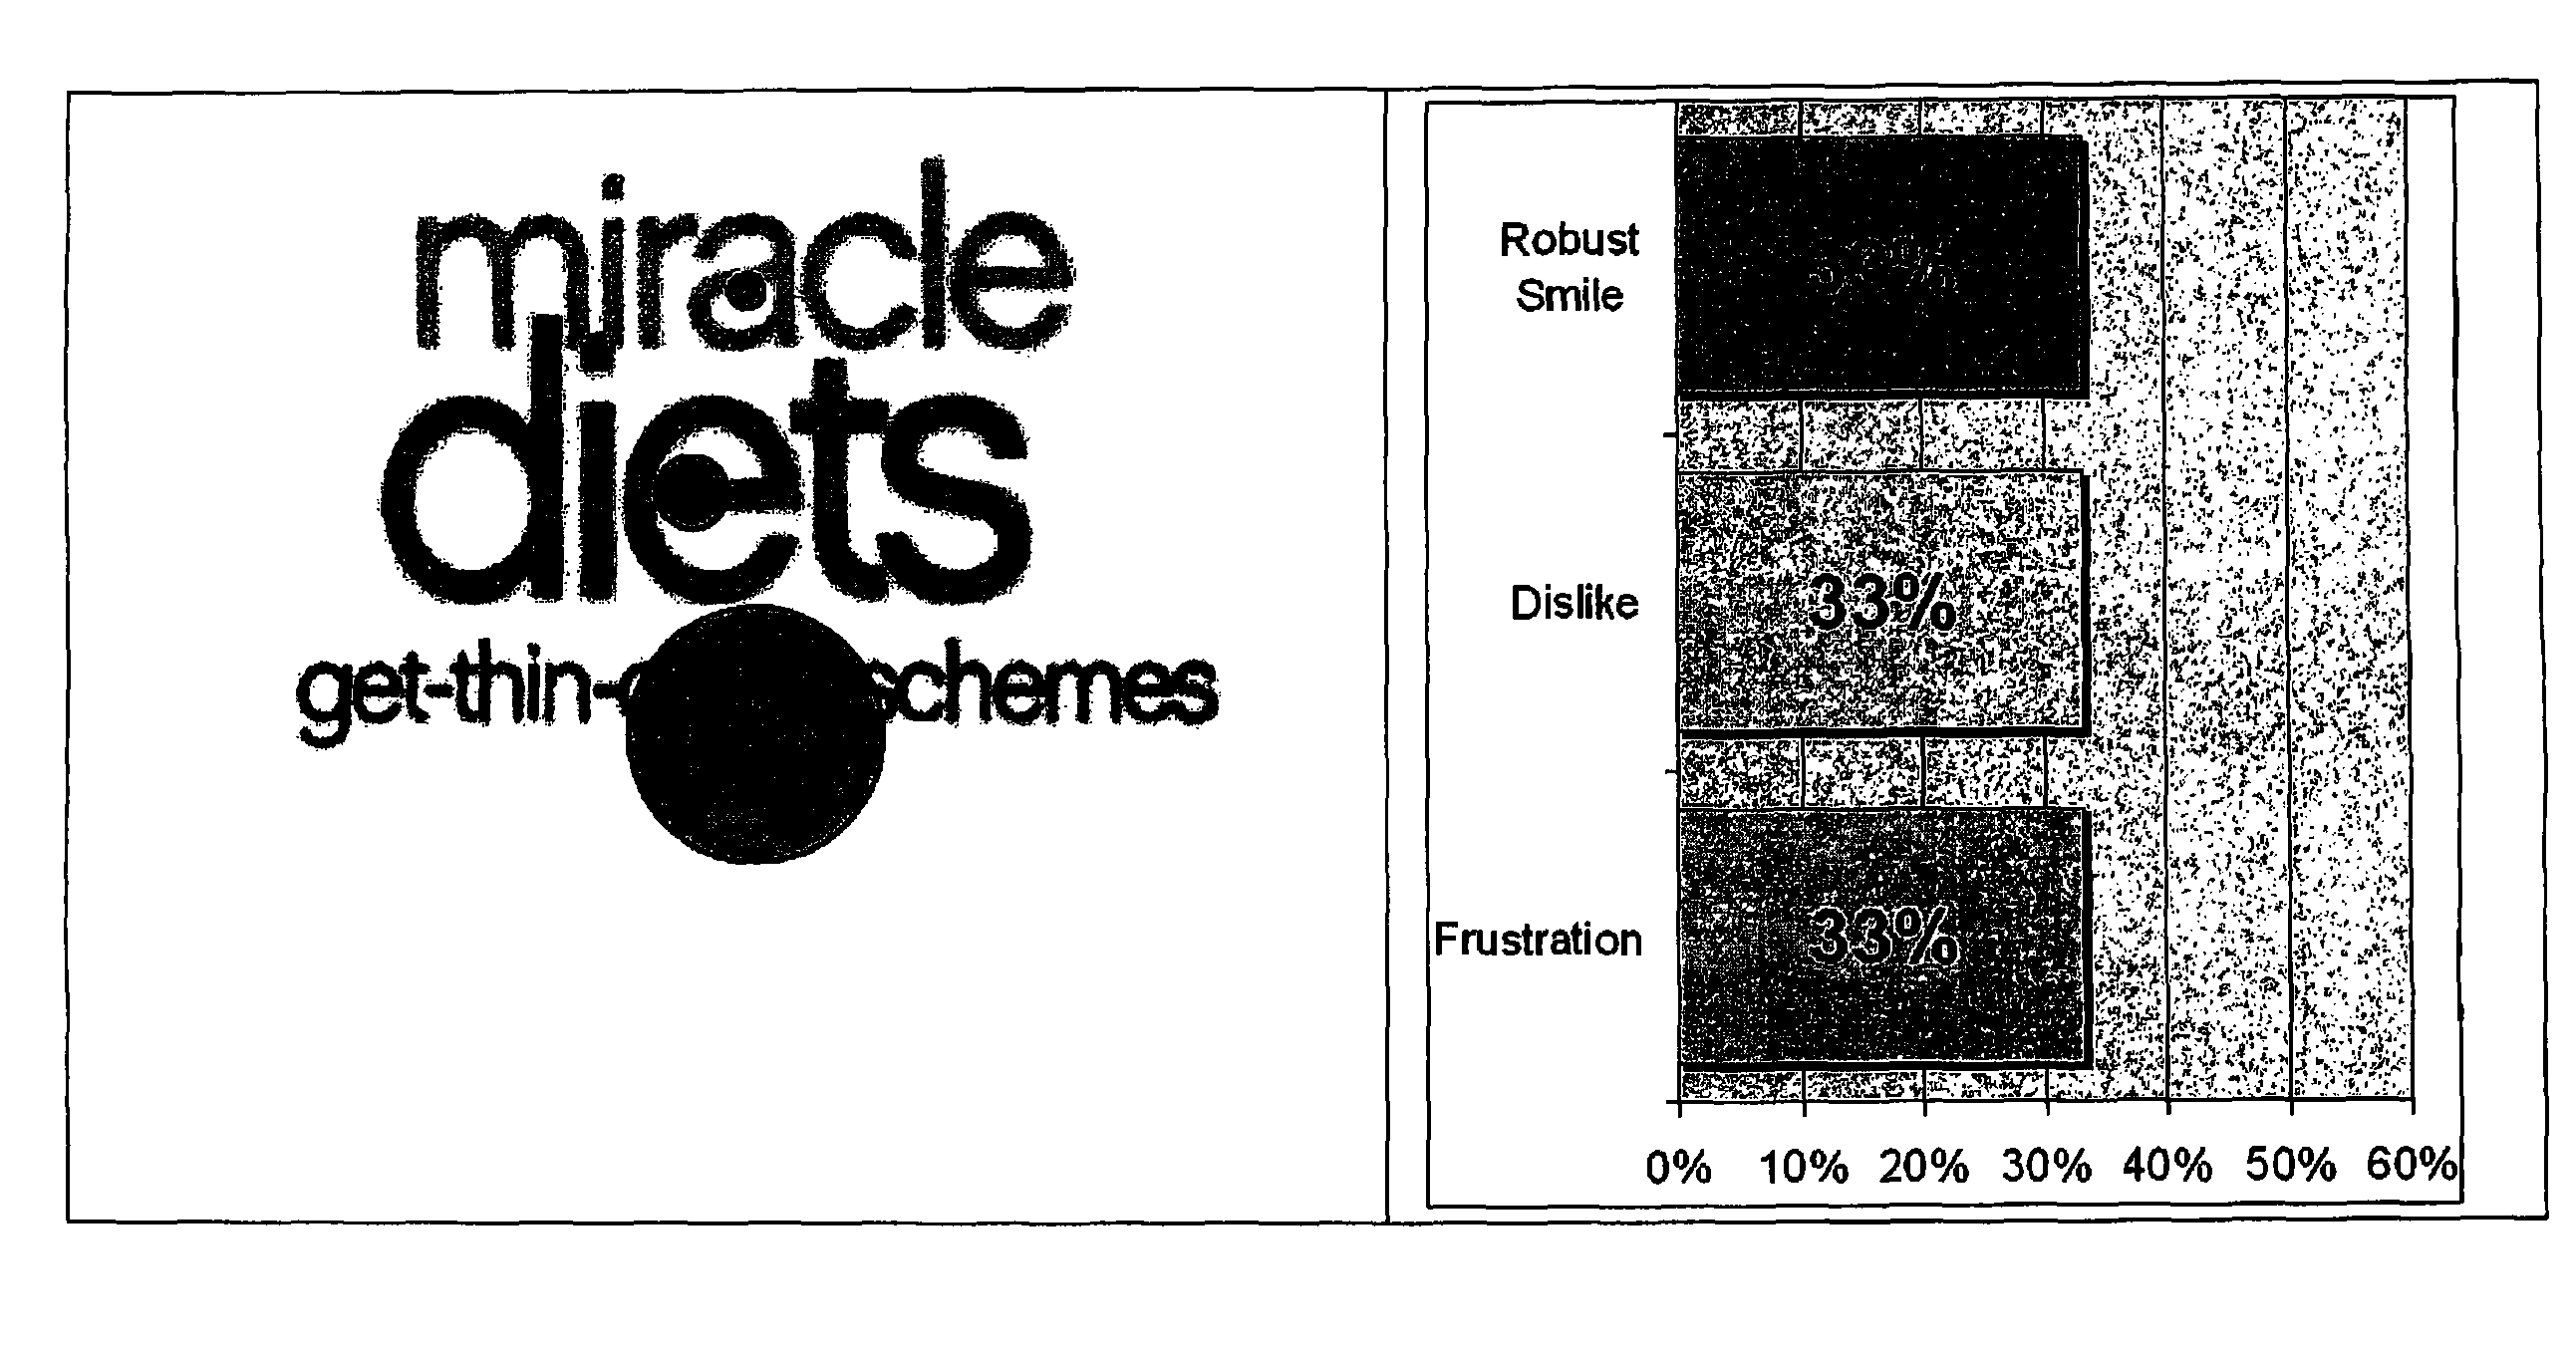
[0158]About thirty five participants were each exposed to a television spot, in each case for a duration of 30 seconds. The eye movements were captured using a Tobii Model 1750 Eye Tracker. The faces of the participants were also videotaped during the 30 second exposure period. The eye tracking output consisted of a dot map for each second of the television spot, with dots showing where the participants directed most of their gaze attention and dot size representing duration of fixation and number of participants. The videotape of each participant was analyzed using FACS. The top three coded emotions, by percentage of activity elicited by the television spot, was displayed alongside each dot map. One of the resultant reports is depicted in FIG. 3.
PUM
 Abstract
Description
Claims
Application Information