

Computer-aided diagnosis system for medical images using deep convolutional neural networks
Patent Information
- Authority / Receiving Office
- US · United States
- Current Assignee / Owner
- Publication Date
- 2017-03-07
- Estimated Expiration
- Not applicable · inactive patent
Smart Images
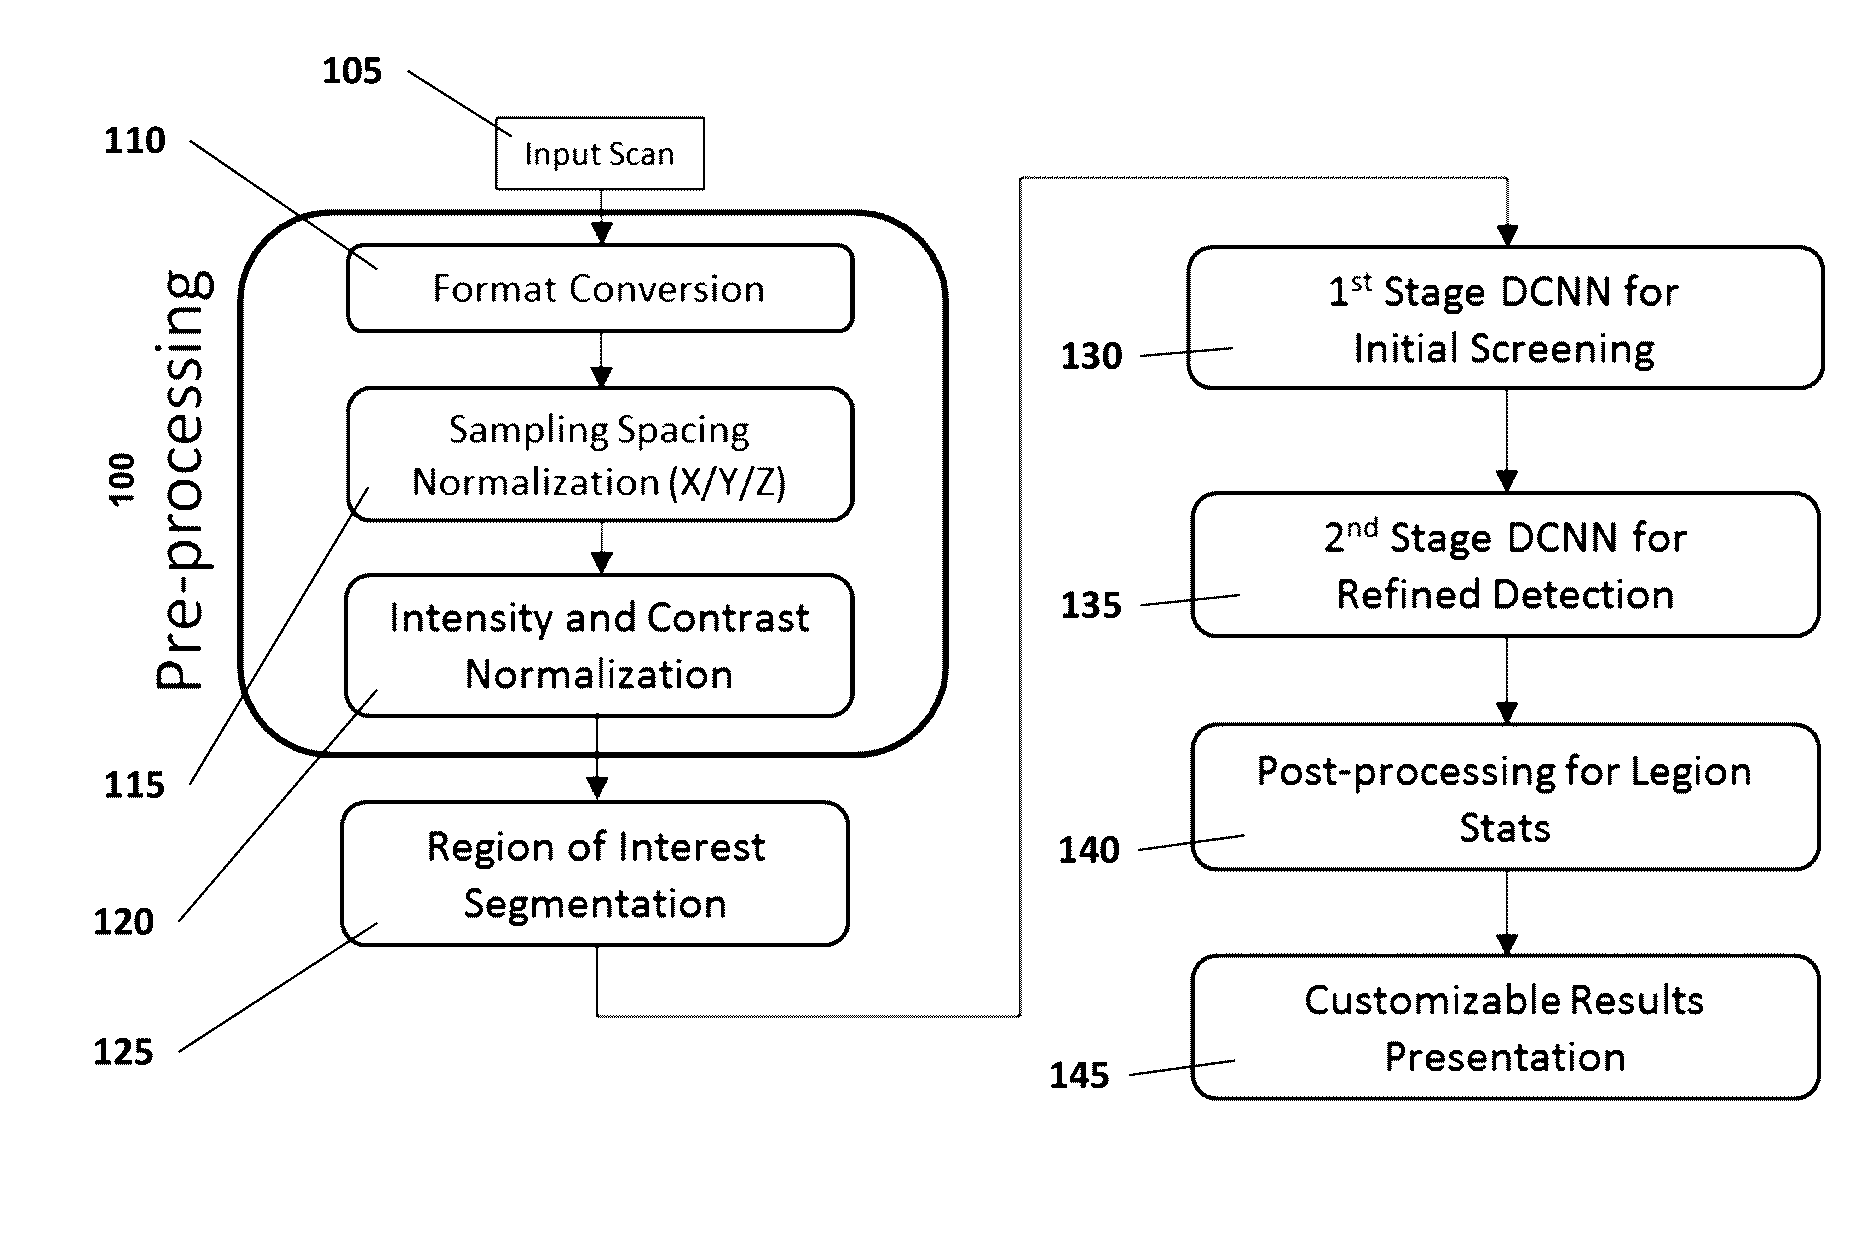
Figure 1 
Figure 2 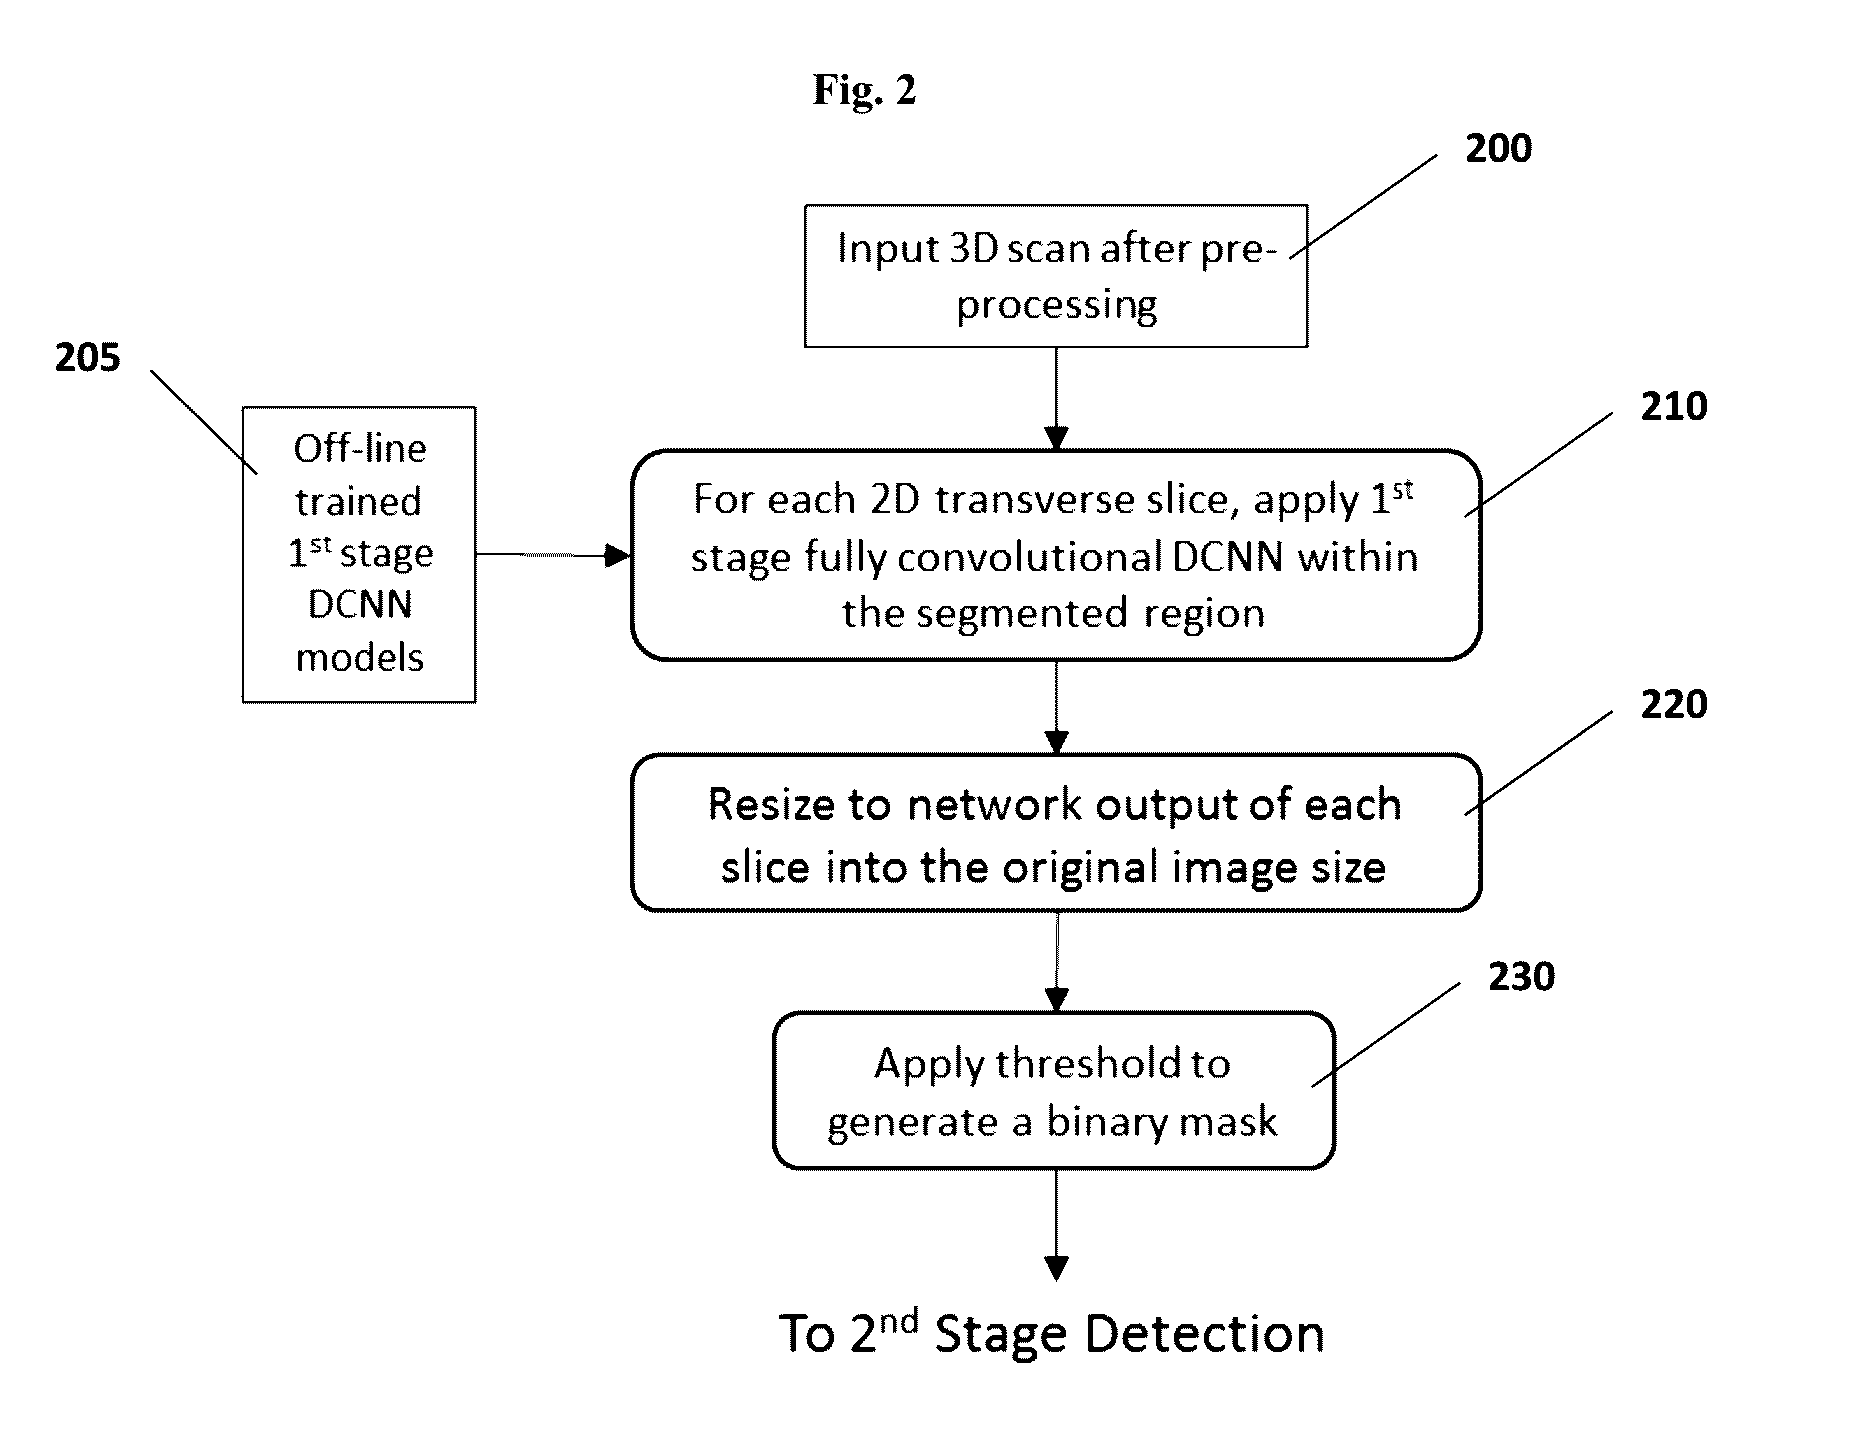
Figure 3
Abstract
Description
BACKGROUND OF THE INVENTION
[0001] Disease diagnosis is an important step in health examination. Medical imaging is a useful tool to diagnose many diseases and offers noninvasive diagnoses, which are a greater advantage than other tools. However, medical imaging generates a large volume of data, and analyzing medical images takes a long process. In early stage of disease diagnoses, abnormal tissues may not be prominent even under high resolution imaging modalities. Thus, new technologies to address the issues are necessary.SUMMARY OF THE INVENTION
[0002] Computer Aided Diagnostic (CAD) systems for medical images aim to help doctors diagnose diseases more efficiently, by reducing examination time, increasing diagnostic accuracy, and reduce diagnostic variations due to experiences and personal conditions. Using advanced computer technology, a CAD system highlights regions of potential medical conditions for doctors to scrutinize and to make final diagnostic decisions. The present disclosu...
Examples
example 1
Generation of Reports
[0062]FIG. 4 shows an example of an analysis report. The system identified location of the nodule was at upper right lung. The nodule was determined non-solid and ground glass. The centroid of the nodule was at x-y-z coordinate of 195-280-43. The nodule diameter along the long axis was 11 mm and along the short axis was 7 mm. The border shape of the nodule was irregular. The probability of being malignant was 84%.
[0063]FIG. 5 shows an example of a diagnostic report. In this example, the report comprises a user interface. Three projected views 501, 502, and 503 of a lung CT scan were presented to the user. The views 501, 502, and 503 comprised a cursor to allow the user pinpoint a location. The window 504 showed a 3D model of the segmented lung and detected nodule candidates (square dots). The 3D models were overlaid in the projected views 501, 502, and 503.
example 2
Validation of Lung Nodule Detection
[0064]The technologies disclosed herein were applied to a publically available lung nodule dataset (LIDC-IDRI) provided by National Institute of Health (NIH). The dataset consists of 1018 CT lung scans from 1012 patients. The scans were captured using a variety of CT machines and a diverse set of parameter settings. Each voxel inside a scan had been carefully annotated by four radiologists as normal (non-nodule) or abnormal (nodule). In a training step, a five-fold cross validation was employed for the evaluation. All scans were first divided into five sets, each of which contained about the same number of scans. Each scan was randomly assigned to one of the five sets. Each evaluation iteration used four of the five sets to train the lung nodule detector, and the remaining set was used for evaluating the trained detector. In a training iteration, segmentation and cascaded detection were applied to the datasets. The evaluation is repeated five times...